Free Statistics

of Irreproducible Research!

Author's title

Author*The author of this computation has been verified*
R Software Modulerwasp_autocorrelation.wasp
Title produced by software(Partial) Autocorrelation Function
Date of computationSun, 13 Dec 2009 05:35:04 -0700
Cite this page as followsStatistical Computations at FreeStatistics.org, Office for Research Development and Education, URL https://freestatistics.org/blog/index.php?v=date/2009/Dec/13/t1260707742wimves5xmoaqs84.htm/, Retrieved Sat, 27 Apr 2024 14:20:18 +0000
Statistical Computations at FreeStatistics.org, Office for Research Development and Education, URL https://freestatistics.org/blog/index.php?pk=67247, Retrieved Sat, 27 Apr 2024 14:20:18 +0000
QR Codes:

Original text written by user:
IsPrivate?No (this computation is public)
User-defined keywords
Estimated Impact89
Family? (F = Feedback message, R = changed R code, M = changed R Module, P = changed Parameters, D = changed Data)
-     [Univariate Explorative Data Analysis] [Run Sequence gebo...] [2008-12-12 13:32:37] [76963dc1903f0f612b6153510a3818cf]
- R  D  [Univariate Explorative Data Analysis] [Run Sequence gebo...] [2008-12-17 12:14:40] [76963dc1903f0f612b6153510a3818cf]
-         [Univariate Explorative Data Analysis] [Run Sequence Plot...] [2008-12-22 18:19:51] [1ce0d16c8f4225c977b42c8fa93bc163]
- RMP       [(Partial) Autocorrelation Function] [Identifying Integ...] [2009-11-22 12:16:10] [b98453cac15ba1066b407e146608df68]
- R PD          [(Partial) Autocorrelation Function] [] [2009-12-13 12:35:04] [21edaefb91319406e70b6c03c71b58b3] [Current]
Feedback Forum

Post a new message
Dataseries X:
595	
591	
589	
584	
573	
567	
569	
621	
629	
628	
612	
595	
597	
593	
590	
580	
574	
573	
573	
620	
626	
620	
588	
566	
557	
561	
549	
532	
526	
511	
499	
555	
565	
542	
527	
510	
514	
517	
508	
493	
490	
469	
478	
528	
534	
518	
506	
502	
516	
528	
533	
536	
537	
524	
536	
587	
597	
581	
564	
558


Summary of computational transaction
Raw Inputview raw input (R code)
Raw Outputview raw output of R engine
Computing time2 seconds
R Server'Gwilym Jenkins' @ 72.249.127.135

\begin{tabular}{lllllllll}
\hline
Summary of computational transaction \tabularnewline
Raw Input & view raw input (R code)  \tabularnewline
Raw Output & view raw output of R engine  \tabularnewline
Computing time & 2 seconds \tabularnewline
R Server & 'Gwilym Jenkins' @ 72.249.127.135 \tabularnewline
\hline
\end{tabular}
%Source: https://freestatistics.org/blog/index.php?pk=67247&T=0

[TABLE]
[ROW][C]Summary of computational transaction[/C][/ROW]
[ROW][C]Raw Input[/C][C]view raw input (R code) [/C][/ROW]
[ROW][C]Raw Output[/C][C]view raw output of R engine [/C][/ROW]
[ROW][C]Computing time[/C][C]2 seconds[/C][/ROW]
[ROW][C]R Server[/C][C]'Gwilym Jenkins' @ 72.249.127.135[/C][/ROW]
[/TABLE]
Source: https://freestatistics.org/blog/index.php?pk=67247&T=0

Globally Unique Identifier (entire table): ba.freestatistics.org/blog/index.php?pk=67247&T=0

As an alternative you can also use a QR Code:  

The GUIDs for individual cells are displayed in the table below:

Summary of computational transaction
Raw Inputview raw input (R code)
Raw Outputview raw output of R engine
Computing time2 seconds
R Server'Gwilym Jenkins' @ 72.249.127.135


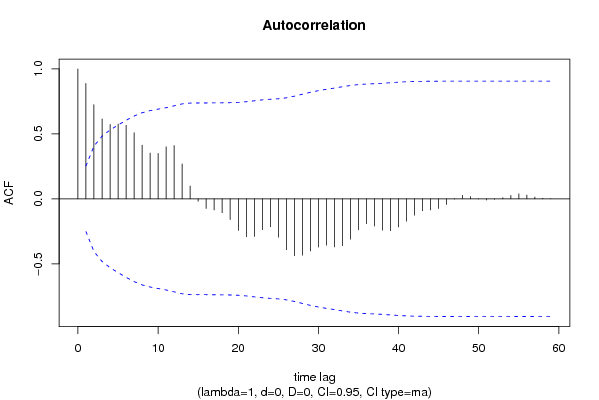
Autocorrelation Function
Time lag kACF(k)T-STATP-value
10.88846.88150
20.7244915.61190
30.6148344.76256e-06
40.5723514.43342e-05
50.5760274.46191.8e-05
60.565864.38312.4e-05
70.5088643.94160.000107
80.41323.20060.001097
90.3521722.72790.004174
100.3490852.7040.00445
110.4003343.1010.001469
120.4104413.17930.001168
130.2685812.08040.020883
140.0981940.76060.224936
15-0.019332-0.14970.440734
16-0.073801-0.57170.284844
17-0.085607-0.66310.254901
18-0.106471-0.82470.206398
19-0.159959-1.2390.110078
20-0.243602-1.88690.032005
21-0.292432-2.26520.013563
22-0.289211-2.24020.014396
23-0.23785-1.84240.035181
24-0.215635-1.67030.050035
25-0.295867-2.29180.012722
26-0.391813-3.0350.001777
27-0.437655-3.39010.00062
28-0.433817-3.36030.000679
29-0.401522-3.11020.00143
30-0.371411-2.87690.002777
31-0.356623-2.76240.003803
32-0.370571-2.87040.002827
33-0.361048-2.79670.003464
34-0.310675-2.40650.009602
35-0.238869-1.85030.0346
36-0.191277-1.48160.071837
37-0.209873-1.62570.054631
38-0.241318-1.86920.033236
39-0.245769-1.90370.030873
40-0.21615-1.67430.04964
41-0.172678-1.33760.093044
42-0.125959-0.97570.166572
43-0.092716-0.71820.237718
44-0.086057-0.66660.253793
45-0.073873-0.57220.284656
46-0.043732-0.33870.367991
47-0.00207-0.0160.493631
480.0270560.20960.417354
490.0188290.14590.442264
50-0.001135-0.00880.496508
51-0.009998-0.07740.469263
52-0.003633-0.02810.488822
530.0084710.06560.473952
540.0263060.20380.419612
550.0386070.2990.382969
560.0289960.22460.411525
570.0138460.10730.457474
580.0041430.03210.487253
590.0009230.00720.497159
60NANANA

\begin{tabular}{lllllllll}
\hline
Autocorrelation Function \tabularnewline
Time lag k & ACF(k) & T-STAT & P-value \tabularnewline
1 & 0.8884 & 6.8815 & 0 \tabularnewline
2 & 0.724491 & 5.6119 & 0 \tabularnewline
3 & 0.614834 & 4.7625 & 6e-06 \tabularnewline
4 & 0.572351 & 4.4334 & 2e-05 \tabularnewline
5 & 0.576027 & 4.4619 & 1.8e-05 \tabularnewline
6 & 0.56586 & 4.3831 & 2.4e-05 \tabularnewline
7 & 0.508864 & 3.9416 & 0.000107 \tabularnewline
8 & 0.4132 & 3.2006 & 0.001097 \tabularnewline
9 & 0.352172 & 2.7279 & 0.004174 \tabularnewline
10 & 0.349085 & 2.704 & 0.00445 \tabularnewline
11 & 0.400334 & 3.101 & 0.001469 \tabularnewline
12 & 0.410441 & 3.1793 & 0.001168 \tabularnewline
13 & 0.268581 & 2.0804 & 0.020883 \tabularnewline
14 & 0.098194 & 0.7606 & 0.224936 \tabularnewline
15 & -0.019332 & -0.1497 & 0.440734 \tabularnewline
16 & -0.073801 & -0.5717 & 0.284844 \tabularnewline
17 & -0.085607 & -0.6631 & 0.254901 \tabularnewline
18 & -0.106471 & -0.8247 & 0.206398 \tabularnewline
19 & -0.159959 & -1.239 & 0.110078 \tabularnewline
20 & -0.243602 & -1.8869 & 0.032005 \tabularnewline
21 & -0.292432 & -2.2652 & 0.013563 \tabularnewline
22 & -0.289211 & -2.2402 & 0.014396 \tabularnewline
23 & -0.23785 & -1.8424 & 0.035181 \tabularnewline
24 & -0.215635 & -1.6703 & 0.050035 \tabularnewline
25 & -0.295867 & -2.2918 & 0.012722 \tabularnewline
26 & -0.391813 & -3.035 & 0.001777 \tabularnewline
27 & -0.437655 & -3.3901 & 0.00062 \tabularnewline
28 & -0.433817 & -3.3603 & 0.000679 \tabularnewline
29 & -0.401522 & -3.1102 & 0.00143 \tabularnewline
30 & -0.371411 & -2.8769 & 0.002777 \tabularnewline
31 & -0.356623 & -2.7624 & 0.003803 \tabularnewline
32 & -0.370571 & -2.8704 & 0.002827 \tabularnewline
33 & -0.361048 & -2.7967 & 0.003464 \tabularnewline
34 & -0.310675 & -2.4065 & 0.009602 \tabularnewline
35 & -0.238869 & -1.8503 & 0.0346 \tabularnewline
36 & -0.191277 & -1.4816 & 0.071837 \tabularnewline
37 & -0.209873 & -1.6257 & 0.054631 \tabularnewline
38 & -0.241318 & -1.8692 & 0.033236 \tabularnewline
39 & -0.245769 & -1.9037 & 0.030873 \tabularnewline
40 & -0.21615 & -1.6743 & 0.04964 \tabularnewline
41 & -0.172678 & -1.3376 & 0.093044 \tabularnewline
42 & -0.125959 & -0.9757 & 0.166572 \tabularnewline
43 & -0.092716 & -0.7182 & 0.237718 \tabularnewline
44 & -0.086057 & -0.6666 & 0.253793 \tabularnewline
45 & -0.073873 & -0.5722 & 0.284656 \tabularnewline
46 & -0.043732 & -0.3387 & 0.367991 \tabularnewline
47 & -0.00207 & -0.016 & 0.493631 \tabularnewline
48 & 0.027056 & 0.2096 & 0.417354 \tabularnewline
49 & 0.018829 & 0.1459 & 0.442264 \tabularnewline
50 & -0.001135 & -0.0088 & 0.496508 \tabularnewline
51 & -0.009998 & -0.0774 & 0.469263 \tabularnewline
52 & -0.003633 & -0.0281 & 0.488822 \tabularnewline
53 & 0.008471 & 0.0656 & 0.473952 \tabularnewline
54 & 0.026306 & 0.2038 & 0.419612 \tabularnewline
55 & 0.038607 & 0.299 & 0.382969 \tabularnewline
56 & 0.028996 & 0.2246 & 0.411525 \tabularnewline
57 & 0.013846 & 0.1073 & 0.457474 \tabularnewline
58 & 0.004143 & 0.0321 & 0.487253 \tabularnewline
59 & 0.000923 & 0.0072 & 0.497159 \tabularnewline
60 & NA & NA & NA \tabularnewline
\hline
\end{tabular}
%Source: https://freestatistics.org/blog/index.php?pk=67247&T=1

[TABLE]
[ROW][C]Autocorrelation Function[/C][/ROW]
[ROW][C]Time lag k[/C][C]ACF(k)[/C][C]T-STAT[/C][C]P-value[/C][/ROW]
[ROW][C]1[/C][C]0.8884[/C][C]6.8815[/C][C]0[/C][/ROW]
[ROW][C]2[/C][C]0.724491[/C][C]5.6119[/C][C]0[/C][/ROW]
[ROW][C]3[/C][C]0.614834[/C][C]4.7625[/C][C]6e-06[/C][/ROW]
[ROW][C]4[/C][C]0.572351[/C][C]4.4334[/C][C]2e-05[/C][/ROW]
[ROW][C]5[/C][C]0.576027[/C][C]4.4619[/C][C]1.8e-05[/C][/ROW]
[ROW][C]6[/C][C]0.56586[/C][C]4.3831[/C][C]2.4e-05[/C][/ROW]
[ROW][C]7[/C][C]0.508864[/C][C]3.9416[/C][C]0.000107[/C][/ROW]
[ROW][C]8[/C][C]0.4132[/C][C]3.2006[/C][C]0.001097[/C][/ROW]
[ROW][C]9[/C][C]0.352172[/C][C]2.7279[/C][C]0.004174[/C][/ROW]
[ROW][C]10[/C][C]0.349085[/C][C]2.704[/C][C]0.00445[/C][/ROW]
[ROW][C]11[/C][C]0.400334[/C][C]3.101[/C][C]0.001469[/C][/ROW]
[ROW][C]12[/C][C]0.410441[/C][C]3.1793[/C][C]0.001168[/C][/ROW]
[ROW][C]13[/C][C]0.268581[/C][C]2.0804[/C][C]0.020883[/C][/ROW]
[ROW][C]14[/C][C]0.098194[/C][C]0.7606[/C][C]0.224936[/C][/ROW]
[ROW][C]15[/C][C]-0.019332[/C][C]-0.1497[/C][C]0.440734[/C][/ROW]
[ROW][C]16[/C][C]-0.073801[/C][C]-0.5717[/C][C]0.284844[/C][/ROW]
[ROW][C]17[/C][C]-0.085607[/C][C]-0.6631[/C][C]0.254901[/C][/ROW]
[ROW][C]18[/C][C]-0.106471[/C][C]-0.8247[/C][C]0.206398[/C][/ROW]
[ROW][C]19[/C][C]-0.159959[/C][C]-1.239[/C][C]0.110078[/C][/ROW]
[ROW][C]20[/C][C]-0.243602[/C][C]-1.8869[/C][C]0.032005[/C][/ROW]
[ROW][C]21[/C][C]-0.292432[/C][C]-2.2652[/C][C]0.013563[/C][/ROW]
[ROW][C]22[/C][C]-0.289211[/C][C]-2.2402[/C][C]0.014396[/C][/ROW]
[ROW][C]23[/C][C]-0.23785[/C][C]-1.8424[/C][C]0.035181[/C][/ROW]
[ROW][C]24[/C][C]-0.215635[/C][C]-1.6703[/C][C]0.050035[/C][/ROW]
[ROW][C]25[/C][C]-0.295867[/C][C]-2.2918[/C][C]0.012722[/C][/ROW]
[ROW][C]26[/C][C]-0.391813[/C][C]-3.035[/C][C]0.001777[/C][/ROW]
[ROW][C]27[/C][C]-0.437655[/C][C]-3.3901[/C][C]0.00062[/C][/ROW]
[ROW][C]28[/C][C]-0.433817[/C][C]-3.3603[/C][C]0.000679[/C][/ROW]
[ROW][C]29[/C][C]-0.401522[/C][C]-3.1102[/C][C]0.00143[/C][/ROW]
[ROW][C]30[/C][C]-0.371411[/C][C]-2.8769[/C][C]0.002777[/C][/ROW]
[ROW][C]31[/C][C]-0.356623[/C][C]-2.7624[/C][C]0.003803[/C][/ROW]
[ROW][C]32[/C][C]-0.370571[/C][C]-2.8704[/C][C]0.002827[/C][/ROW]
[ROW][C]33[/C][C]-0.361048[/C][C]-2.7967[/C][C]0.003464[/C][/ROW]
[ROW][C]34[/C][C]-0.310675[/C][C]-2.4065[/C][C]0.009602[/C][/ROW]
[ROW][C]35[/C][C]-0.238869[/C][C]-1.8503[/C][C]0.0346[/C][/ROW]
[ROW][C]36[/C][C]-0.191277[/C][C]-1.4816[/C][C]0.071837[/C][/ROW]
[ROW][C]37[/C][C]-0.209873[/C][C]-1.6257[/C][C]0.054631[/C][/ROW]
[ROW][C]38[/C][C]-0.241318[/C][C]-1.8692[/C][C]0.033236[/C][/ROW]
[ROW][C]39[/C][C]-0.245769[/C][C]-1.9037[/C][C]0.030873[/C][/ROW]
[ROW][C]40[/C][C]-0.21615[/C][C]-1.6743[/C][C]0.04964[/C][/ROW]
[ROW][C]41[/C][C]-0.172678[/C][C]-1.3376[/C][C]0.093044[/C][/ROW]
[ROW][C]42[/C][C]-0.125959[/C][C]-0.9757[/C][C]0.166572[/C][/ROW]
[ROW][C]43[/C][C]-0.092716[/C][C]-0.7182[/C][C]0.237718[/C][/ROW]
[ROW][C]44[/C][C]-0.086057[/C][C]-0.6666[/C][C]0.253793[/C][/ROW]
[ROW][C]45[/C][C]-0.073873[/C][C]-0.5722[/C][C]0.284656[/C][/ROW]
[ROW][C]46[/C][C]-0.043732[/C][C]-0.3387[/C][C]0.367991[/C][/ROW]
[ROW][C]47[/C][C]-0.00207[/C][C]-0.016[/C][C]0.493631[/C][/ROW]
[ROW][C]48[/C][C]0.027056[/C][C]0.2096[/C][C]0.417354[/C][/ROW]
[ROW][C]49[/C][C]0.018829[/C][C]0.1459[/C][C]0.442264[/C][/ROW]
[ROW][C]50[/C][C]-0.001135[/C][C]-0.0088[/C][C]0.496508[/C][/ROW]
[ROW][C]51[/C][C]-0.009998[/C][C]-0.0774[/C][C]0.469263[/C][/ROW]
[ROW][C]52[/C][C]-0.003633[/C][C]-0.0281[/C][C]0.488822[/C][/ROW]
[ROW][C]53[/C][C]0.008471[/C][C]0.0656[/C][C]0.473952[/C][/ROW]
[ROW][C]54[/C][C]0.026306[/C][C]0.2038[/C][C]0.419612[/C][/ROW]
[ROW][C]55[/C][C]0.038607[/C][C]0.299[/C][C]0.382969[/C][/ROW]
[ROW][C]56[/C][C]0.028996[/C][C]0.2246[/C][C]0.411525[/C][/ROW]
[ROW][C]57[/C][C]0.013846[/C][C]0.1073[/C][C]0.457474[/C][/ROW]
[ROW][C]58[/C][C]0.004143[/C][C]0.0321[/C][C]0.487253[/C][/ROW]
[ROW][C]59[/C][C]0.000923[/C][C]0.0072[/C][C]0.497159[/C][/ROW]
[ROW][C]60[/C][C]NA[/C][C]NA[/C][C]NA[/C][/ROW]
[/TABLE]
Source: https://freestatistics.org/blog/index.php?pk=67247&T=1

Globally Unique Identifier (entire table): ba.freestatistics.org/blog/index.php?pk=67247&T=1

As an alternative you can also use a QR Code:  

The GUIDs for individual cells are displayed in the table below:

Autocorrelation Function
Time lag kACF(k)T-STATP-value
10.88846.88150
20.7244915.61190
30.6148344.76256e-06
40.5723514.43342e-05
50.5760274.46191.8e-05
60.565864.38312.4e-05
70.5088643.94160.000107
80.41323.20060.001097
90.3521722.72790.004174
100.3490852.7040.00445
110.4003343.1010.001469
120.4104413.17930.001168
130.2685812.08040.020883
140.0981940.76060.224936
15-0.019332-0.14970.440734
16-0.073801-0.57170.284844
17-0.085607-0.66310.254901
18-0.106471-0.82470.206398
19-0.159959-1.2390.110078
20-0.243602-1.88690.032005
21-0.292432-2.26520.013563
22-0.289211-2.24020.014396
23-0.23785-1.84240.035181
24-0.215635-1.67030.050035
25-0.295867-2.29180.012722
26-0.391813-3.0350.001777
27-0.437655-3.39010.00062
28-0.433817-3.36030.000679
29-0.401522-3.11020.00143
30-0.371411-2.87690.002777
31-0.356623-2.76240.003803
32-0.370571-2.87040.002827
33-0.361048-2.79670.003464
34-0.310675-2.40650.009602
35-0.238869-1.85030.0346
36-0.191277-1.48160.071837
37-0.209873-1.62570.054631
38-0.241318-1.86920.033236
39-0.245769-1.90370.030873
40-0.21615-1.67430.04964
41-0.172678-1.33760.093044
42-0.125959-0.97570.166572
43-0.092716-0.71820.237718
44-0.086057-0.66660.253793
45-0.073873-0.57220.284656
46-0.043732-0.33870.367991
47-0.00207-0.0160.493631
480.0270560.20960.417354
490.0188290.14590.442264
50-0.001135-0.00880.496508
51-0.009998-0.07740.469263
52-0.003633-0.02810.488822
530.0084710.06560.473952
540.0263060.20380.419612
550.0386070.2990.382969
560.0289960.22460.411525
570.0138460.10730.457474
580.0041430.03210.487253
590.0009230.00720.497159
60NANANA


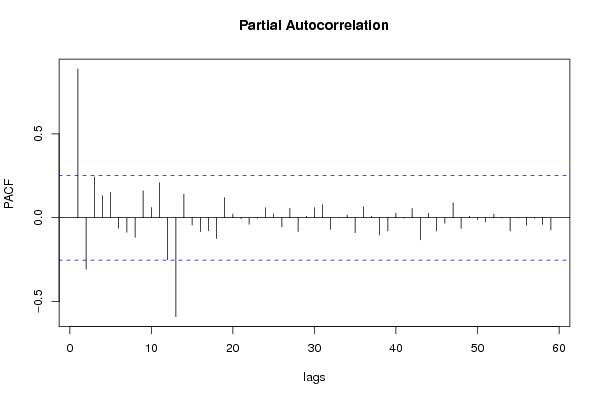
Partial Autocorrelation Function
Time lag kPACF(k)T-STATP-value
10.88846.88150
2-0.30731-2.38040.010243
30.2432011.88380.032218
40.1311261.01570.156926
50.1505751.16640.124044
6-0.06308-0.48860.313448
7-0.087407-0.67710.250487
8-0.116957-0.90590.184294
90.1603691.24220.109496
100.0606780.470.320027
110.2085761.61560.055711
12-0.251267-1.94630.028153
13-0.591153-4.57911.2e-05
140.1399011.08370.141423
15-0.044175-0.34220.366707
16-0.082816-0.64150.261825
17-0.078253-0.60610.273351
18-0.125042-0.96860.168323
190.1201630.93080.17785
200.0213750.16560.434526
21-0.005742-0.04450.482335
22-0.039177-0.30350.381295
23-0.003528-0.02730.489143
240.0589060.45630.324916
250.0225360.17460.431006
26-0.054239-0.42010.337946
270.0551630.42730.335349
28-0.082353-0.63790.262983
290.0085290.06610.473773
300.0605830.46930.320286
310.0773930.59950.275554
32-0.069183-0.53590.297008
33-0.000874-0.00680.49731
340.0155220.12020.452349
35-0.089908-0.69640.244427
360.0649320.5030.308418
370.0082990.06430.47448
38-0.103328-0.80040.213326
39-0.078585-0.60870.272506
400.0261740.20270.420011
41-0.002994-0.02320.490786
420.0541710.41960.338136
43-0.131894-1.02160.155524
440.0260370.20170.420422
45-0.079184-0.61340.270979
46-0.033367-0.25850.398469
470.0886830.68690.247386
48-0.063796-0.49420.3115
490.0081230.06290.475019
50-0.010268-0.07950.468435
51-0.026336-0.2040.419521
520.0203310.15750.437698
53-0.002394-0.01850.492633
54-0.079605-0.61660.269909
55-0.001411-0.01090.495658
56-0.045393-0.35160.36318
57-0.003857-0.02990.488133
58-0.040469-0.31350.377505
59-0.072335-0.56030.288679
60NANANA

\begin{tabular}{lllllllll}
\hline
Partial Autocorrelation Function \tabularnewline
Time lag k & PACF(k) & T-STAT & P-value \tabularnewline
1 & 0.8884 & 6.8815 & 0 \tabularnewline
2 & -0.30731 & -2.3804 & 0.010243 \tabularnewline
3 & 0.243201 & 1.8838 & 0.032218 \tabularnewline
4 & 0.131126 & 1.0157 & 0.156926 \tabularnewline
5 & 0.150575 & 1.1664 & 0.124044 \tabularnewline
6 & -0.06308 & -0.4886 & 0.313448 \tabularnewline
7 & -0.087407 & -0.6771 & 0.250487 \tabularnewline
8 & -0.116957 & -0.9059 & 0.184294 \tabularnewline
9 & 0.160369 & 1.2422 & 0.109496 \tabularnewline
10 & 0.060678 & 0.47 & 0.320027 \tabularnewline
11 & 0.208576 & 1.6156 & 0.055711 \tabularnewline
12 & -0.251267 & -1.9463 & 0.028153 \tabularnewline
13 & -0.591153 & -4.5791 & 1.2e-05 \tabularnewline
14 & 0.139901 & 1.0837 & 0.141423 \tabularnewline
15 & -0.044175 & -0.3422 & 0.366707 \tabularnewline
16 & -0.082816 & -0.6415 & 0.261825 \tabularnewline
17 & -0.078253 & -0.6061 & 0.273351 \tabularnewline
18 & -0.125042 & -0.9686 & 0.168323 \tabularnewline
19 & 0.120163 & 0.9308 & 0.17785 \tabularnewline
20 & 0.021375 & 0.1656 & 0.434526 \tabularnewline
21 & -0.005742 & -0.0445 & 0.482335 \tabularnewline
22 & -0.039177 & -0.3035 & 0.381295 \tabularnewline
23 & -0.003528 & -0.0273 & 0.489143 \tabularnewline
24 & 0.058906 & 0.4563 & 0.324916 \tabularnewline
25 & 0.022536 & 0.1746 & 0.431006 \tabularnewline
26 & -0.054239 & -0.4201 & 0.337946 \tabularnewline
27 & 0.055163 & 0.4273 & 0.335349 \tabularnewline
28 & -0.082353 & -0.6379 & 0.262983 \tabularnewline
29 & 0.008529 & 0.0661 & 0.473773 \tabularnewline
30 & 0.060583 & 0.4693 & 0.320286 \tabularnewline
31 & 0.077393 & 0.5995 & 0.275554 \tabularnewline
32 & -0.069183 & -0.5359 & 0.297008 \tabularnewline
33 & -0.000874 & -0.0068 & 0.49731 \tabularnewline
34 & 0.015522 & 0.1202 & 0.452349 \tabularnewline
35 & -0.089908 & -0.6964 & 0.244427 \tabularnewline
36 & 0.064932 & 0.503 & 0.308418 \tabularnewline
37 & 0.008299 & 0.0643 & 0.47448 \tabularnewline
38 & -0.103328 & -0.8004 & 0.213326 \tabularnewline
39 & -0.078585 & -0.6087 & 0.272506 \tabularnewline
40 & 0.026174 & 0.2027 & 0.420011 \tabularnewline
41 & -0.002994 & -0.0232 & 0.490786 \tabularnewline
42 & 0.054171 & 0.4196 & 0.338136 \tabularnewline
43 & -0.131894 & -1.0216 & 0.155524 \tabularnewline
44 & 0.026037 & 0.2017 & 0.420422 \tabularnewline
45 & -0.079184 & -0.6134 & 0.270979 \tabularnewline
46 & -0.033367 & -0.2585 & 0.398469 \tabularnewline
47 & 0.088683 & 0.6869 & 0.247386 \tabularnewline
48 & -0.063796 & -0.4942 & 0.3115 \tabularnewline
49 & 0.008123 & 0.0629 & 0.475019 \tabularnewline
50 & -0.010268 & -0.0795 & 0.468435 \tabularnewline
51 & -0.026336 & -0.204 & 0.419521 \tabularnewline
52 & 0.020331 & 0.1575 & 0.437698 \tabularnewline
53 & -0.002394 & -0.0185 & 0.492633 \tabularnewline
54 & -0.079605 & -0.6166 & 0.269909 \tabularnewline
55 & -0.001411 & -0.0109 & 0.495658 \tabularnewline
56 & -0.045393 & -0.3516 & 0.36318 \tabularnewline
57 & -0.003857 & -0.0299 & 0.488133 \tabularnewline
58 & -0.040469 & -0.3135 & 0.377505 \tabularnewline
59 & -0.072335 & -0.5603 & 0.288679 \tabularnewline
60 & NA & NA & NA \tabularnewline
\hline
\end{tabular}
%Source: https://freestatistics.org/blog/index.php?pk=67247&T=2

[TABLE]
[ROW][C]Partial Autocorrelation Function[/C][/ROW]
[ROW][C]Time lag k[/C][C]PACF(k)[/C][C]T-STAT[/C][C]P-value[/C][/ROW]
[ROW][C]1[/C][C]0.8884[/C][C]6.8815[/C][C]0[/C][/ROW]
[ROW][C]2[/C][C]-0.30731[/C][C]-2.3804[/C][C]0.010243[/C][/ROW]
[ROW][C]3[/C][C]0.243201[/C][C]1.8838[/C][C]0.032218[/C][/ROW]
[ROW][C]4[/C][C]0.131126[/C][C]1.0157[/C][C]0.156926[/C][/ROW]
[ROW][C]5[/C][C]0.150575[/C][C]1.1664[/C][C]0.124044[/C][/ROW]
[ROW][C]6[/C][C]-0.06308[/C][C]-0.4886[/C][C]0.313448[/C][/ROW]
[ROW][C]7[/C][C]-0.087407[/C][C]-0.6771[/C][C]0.250487[/C][/ROW]
[ROW][C]8[/C][C]-0.116957[/C][C]-0.9059[/C][C]0.184294[/C][/ROW]
[ROW][C]9[/C][C]0.160369[/C][C]1.2422[/C][C]0.109496[/C][/ROW]
[ROW][C]10[/C][C]0.060678[/C][C]0.47[/C][C]0.320027[/C][/ROW]
[ROW][C]11[/C][C]0.208576[/C][C]1.6156[/C][C]0.055711[/C][/ROW]
[ROW][C]12[/C][C]-0.251267[/C][C]-1.9463[/C][C]0.028153[/C][/ROW]
[ROW][C]13[/C][C]-0.591153[/C][C]-4.5791[/C][C]1.2e-05[/C][/ROW]
[ROW][C]14[/C][C]0.139901[/C][C]1.0837[/C][C]0.141423[/C][/ROW]
[ROW][C]15[/C][C]-0.044175[/C][C]-0.3422[/C][C]0.366707[/C][/ROW]
[ROW][C]16[/C][C]-0.082816[/C][C]-0.6415[/C][C]0.261825[/C][/ROW]
[ROW][C]17[/C][C]-0.078253[/C][C]-0.6061[/C][C]0.273351[/C][/ROW]
[ROW][C]18[/C][C]-0.125042[/C][C]-0.9686[/C][C]0.168323[/C][/ROW]
[ROW][C]19[/C][C]0.120163[/C][C]0.9308[/C][C]0.17785[/C][/ROW]
[ROW][C]20[/C][C]0.021375[/C][C]0.1656[/C][C]0.434526[/C][/ROW]
[ROW][C]21[/C][C]-0.005742[/C][C]-0.0445[/C][C]0.482335[/C][/ROW]
[ROW][C]22[/C][C]-0.039177[/C][C]-0.3035[/C][C]0.381295[/C][/ROW]
[ROW][C]23[/C][C]-0.003528[/C][C]-0.0273[/C][C]0.489143[/C][/ROW]
[ROW][C]24[/C][C]0.058906[/C][C]0.4563[/C][C]0.324916[/C][/ROW]
[ROW][C]25[/C][C]0.022536[/C][C]0.1746[/C][C]0.431006[/C][/ROW]
[ROW][C]26[/C][C]-0.054239[/C][C]-0.4201[/C][C]0.337946[/C][/ROW]
[ROW][C]27[/C][C]0.055163[/C][C]0.4273[/C][C]0.335349[/C][/ROW]
[ROW][C]28[/C][C]-0.082353[/C][C]-0.6379[/C][C]0.262983[/C][/ROW]
[ROW][C]29[/C][C]0.008529[/C][C]0.0661[/C][C]0.473773[/C][/ROW]
[ROW][C]30[/C][C]0.060583[/C][C]0.4693[/C][C]0.320286[/C][/ROW]
[ROW][C]31[/C][C]0.077393[/C][C]0.5995[/C][C]0.275554[/C][/ROW]
[ROW][C]32[/C][C]-0.069183[/C][C]-0.5359[/C][C]0.297008[/C][/ROW]
[ROW][C]33[/C][C]-0.000874[/C][C]-0.0068[/C][C]0.49731[/C][/ROW]
[ROW][C]34[/C][C]0.015522[/C][C]0.1202[/C][C]0.452349[/C][/ROW]
[ROW][C]35[/C][C]-0.089908[/C][C]-0.6964[/C][C]0.244427[/C][/ROW]
[ROW][C]36[/C][C]0.064932[/C][C]0.503[/C][C]0.308418[/C][/ROW]
[ROW][C]37[/C][C]0.008299[/C][C]0.0643[/C][C]0.47448[/C][/ROW]
[ROW][C]38[/C][C]-0.103328[/C][C]-0.8004[/C][C]0.213326[/C][/ROW]
[ROW][C]39[/C][C]-0.078585[/C][C]-0.6087[/C][C]0.272506[/C][/ROW]
[ROW][C]40[/C][C]0.026174[/C][C]0.2027[/C][C]0.420011[/C][/ROW]
[ROW][C]41[/C][C]-0.002994[/C][C]-0.0232[/C][C]0.490786[/C][/ROW]
[ROW][C]42[/C][C]0.054171[/C][C]0.4196[/C][C]0.338136[/C][/ROW]
[ROW][C]43[/C][C]-0.131894[/C][C]-1.0216[/C][C]0.155524[/C][/ROW]
[ROW][C]44[/C][C]0.026037[/C][C]0.2017[/C][C]0.420422[/C][/ROW]
[ROW][C]45[/C][C]-0.079184[/C][C]-0.6134[/C][C]0.270979[/C][/ROW]
[ROW][C]46[/C][C]-0.033367[/C][C]-0.2585[/C][C]0.398469[/C][/ROW]
[ROW][C]47[/C][C]0.088683[/C][C]0.6869[/C][C]0.247386[/C][/ROW]
[ROW][C]48[/C][C]-0.063796[/C][C]-0.4942[/C][C]0.3115[/C][/ROW]
[ROW][C]49[/C][C]0.008123[/C][C]0.0629[/C][C]0.475019[/C][/ROW]
[ROW][C]50[/C][C]-0.010268[/C][C]-0.0795[/C][C]0.468435[/C][/ROW]
[ROW][C]51[/C][C]-0.026336[/C][C]-0.204[/C][C]0.419521[/C][/ROW]
[ROW][C]52[/C][C]0.020331[/C][C]0.1575[/C][C]0.437698[/C][/ROW]
[ROW][C]53[/C][C]-0.002394[/C][C]-0.0185[/C][C]0.492633[/C][/ROW]
[ROW][C]54[/C][C]-0.079605[/C][C]-0.6166[/C][C]0.269909[/C][/ROW]
[ROW][C]55[/C][C]-0.001411[/C][C]-0.0109[/C][C]0.495658[/C][/ROW]
[ROW][C]56[/C][C]-0.045393[/C][C]-0.3516[/C][C]0.36318[/C][/ROW]
[ROW][C]57[/C][C]-0.003857[/C][C]-0.0299[/C][C]0.488133[/C][/ROW]
[ROW][C]58[/C][C]-0.040469[/C][C]-0.3135[/C][C]0.377505[/C][/ROW]
[ROW][C]59[/C][C]-0.072335[/C][C]-0.5603[/C][C]0.288679[/C][/ROW]
[ROW][C]60[/C][C]NA[/C][C]NA[/C][C]NA[/C][/ROW]
[/TABLE]
Source: https://freestatistics.org/blog/index.php?pk=67247&T=2

Globally Unique Identifier (entire table): ba.freestatistics.org/blog/index.php?pk=67247&T=2

As an alternative you can also use a QR Code:  

The GUIDs for individual cells are displayed in the table below:

Partial Autocorrelation Function
Time lag kPACF(k)T-STATP-value
10.88846.88150
2-0.30731-2.38040.010243
30.2432011.88380.032218
40.1311261.01570.156926
50.1505751.16640.124044
6-0.06308-0.48860.313448
7-0.087407-0.67710.250487
8-0.116957-0.90590.184294
90.1603691.24220.109496
100.0606780.470.320027
110.2085761.61560.055711
12-0.251267-1.94630.028153
13-0.591153-4.57911.2e-05
140.1399011.08370.141423
15-0.044175-0.34220.366707
16-0.082816-0.64150.261825
17-0.078253-0.60610.273351
18-0.125042-0.96860.168323
190.1201630.93080.17785
200.0213750.16560.434526
21-0.005742-0.04450.482335
22-0.039177-0.30350.381295
23-0.003528-0.02730.489143
240.0589060.45630.324916
250.0225360.17460.431006
26-0.054239-0.42010.337946
270.0551630.42730.335349
28-0.082353-0.63790.262983
290.0085290.06610.473773
300.0605830.46930.320286
310.0773930.59950.275554
32-0.069183-0.53590.297008
33-0.000874-0.00680.49731
340.0155220.12020.452349
35-0.089908-0.69640.244427
360.0649320.5030.308418
370.0082990.06430.47448
38-0.103328-0.80040.213326
39-0.078585-0.60870.272506
400.0261740.20270.420011
41-0.002994-0.02320.490786
420.0541710.41960.338136
43-0.131894-1.02160.155524
440.0260370.20170.420422
45-0.079184-0.61340.270979
46-0.033367-0.25850.398469
470.0886830.68690.247386
48-0.063796-0.49420.3115
490.0081230.06290.475019
50-0.010268-0.07950.468435
51-0.026336-0.2040.419521
520.0203310.15750.437698
53-0.002394-0.01850.492633
54-0.079605-0.61660.269909
55-0.001411-0.01090.495658
56-0.045393-0.35160.36318
57-0.003857-0.02990.488133
58-0.040469-0.31350.377505
59-0.072335-0.56030.288679
60NANANA


Parameters (Session):
par1 = 60 ; par2 = 1 ; par3 = 0 ; par4 = 0 ; par5 = 12 ; par6 = MA ; par7 = 0.95 ;
Parameters (R input):
par1 = 60 ; par2 = 1 ; par3 = 0 ; par4 = 0 ; par5 = 12 ; par6 = MA ; par7 = 0.95 ;
R code (references can be found in the software module):
if (par1 == 'Default') {
par1 = 10*log10(length(x))
} else {
par1 <- as.numeric(par1)
}
par2 <- as.numeric(par2)
par3 <- as.numeric(par3)
par4 <- as.numeric(par4)
par5 <- as.numeric(par5)
if (par6 == 'White Noise') par6 <- 'white' else par6 <- 'ma'
par7 <- as.numeric(par7)
if (par2 == 0) {
x <- log(x)
} else {
x <- (x ^ par2 - 1) / par2
}
if (par3 > 0) x <- diff(x,lag=1,difference=par3)
if (par4 > 0) x <- diff(x,lag=par5,difference=par4)
bitmap(file='pic1.png')
racf <- acf(x, par1, main='Autocorrelation', xlab='time lag', ylab='ACF', ci.type=par6, ci=par7, sub=paste('(lambda=',par2,', d=',par3,', D=',par4,', CI=', par7, ', CI type=',par6,')',sep=''))
dev.off()
bitmap(file='pic2.png')
rpacf <- pacf(x,par1,main='Partial Autocorrelation',xlab='lags',ylab='PACF')
dev.off()
(myacf <- c(racf$acf))
(mypacf <- c(rpacf$acf))
lengthx <- length(x)
sqrtn <- sqrt(lengthx)
load(file='createtable')
a<-table.start()
a<-table.row.start(a)
a<-table.element(a,'Autocorrelation Function',4,TRUE)
a<-table.row.end(a)
a<-table.row.start(a)
a<-table.element(a,'Time lag k',header=TRUE)
a<-table.element(a,hyperlink('basics.htm','ACF(k)','click here for more information about the Autocorrelation Function'),header=TRUE)
a<-table.element(a,'T-STAT',header=TRUE)
a<-table.element(a,'P-value',header=TRUE)
a<-table.row.end(a)
for (i in 2:(par1+1)) {
a<-table.row.start(a)
a<-table.element(a,i-1,header=TRUE)
a<-table.element(a,round(myacf[i],6))
mytstat <- myacf[i]*sqrtn
a<-table.element(a,round(mytstat,4))
a<-table.element(a,round(1-pt(abs(mytstat),lengthx),6))
a<-table.row.end(a)
}
a<-table.end(a)
table.save(a,file='mytable.tab')
a<-table.start()
a<-table.row.start(a)
a<-table.element(a,'Partial Autocorrelation Function',4,TRUE)
a<-table.row.end(a)
a<-table.row.start(a)
a<-table.element(a,'Time lag k',header=TRUE)
a<-table.element(a,hyperlink('basics.htm','PACF(k)','click here for more information about the Partial Autocorrelation Function'),header=TRUE)
a<-table.element(a,'T-STAT',header=TRUE)
a<-table.element(a,'P-value',header=TRUE)
a<-table.row.end(a)
for (i in 1:par1) {
a<-table.row.start(a)
a<-table.element(a,i,header=TRUE)
a<-table.element(a,round(mypacf[i],6))
mytstat <- mypacf[i]*sqrtn
a<-table.element(a,round(mytstat,4))
a<-table.element(a,round(1-pt(abs(mytstat),lengthx),6))
a<-table.row.end(a)
}
a<-table.end(a)
table.save(a,file='mytable1.tab')