Free Statistics

of Irreproducible Research!

Author's title

Author*The author of this computation has been verified*
R Software Modulerwasp_arimabackwardselection.wasp
Title produced by softwareARIMA Backward Selection
Date of computationThu, 17 Dec 2009 05:23:25 -0700
Cite this page as followsStatistical Computations at FreeStatistics.org, Office for Research Development and Education, URL https://freestatistics.org/blog/index.php?v=date/2009/Dec/17/t1261052684r5smlq7hdegnclk.htm/, Retrieved Tue, 30 Apr 2024 06:10:31 +0000
Statistical Computations at FreeStatistics.org, Office for Research Development and Education, URL https://freestatistics.org/blog/index.php?pk=68791, Retrieved Tue, 30 Apr 2024 06:10:31 +0000
QR Codes:

Original text written by user:
IsPrivate?No (this computation is public)
User-defined keywords
Estimated Impact175
Family? (F = Feedback message, R = changed R code, M = changed R Module, P = changed Parameters, D = changed Data)
-     [Univariate Explorative Data Analysis] [Run Sequence gebo...] [2008-12-12 13:32:37] [76963dc1903f0f612b6153510a3818cf]
- R  D  [Univariate Explorative Data Analysis] [Run Sequence gebo...] [2008-12-17 12:14:40] [76963dc1903f0f612b6153510a3818cf]
-         [Univariate Explorative Data Analysis] [Run Sequence Plot...] [2008-12-22 18:19:51] [1ce0d16c8f4225c977b42c8fa93bc163]
- RMP       [(Partial) Autocorrelation Function] [Identifying Integ...] [2009-11-22 12:16:10] [b98453cac15ba1066b407e146608df68]
-    D        [(Partial) Autocorrelation Function] [ws8] [2009-11-24 20:12:27] [8b1aef4e7013bd33fbc2a5833375c5f5]
-    D          [(Partial) Autocorrelation Function] [SHw WS8] [2009-11-25 18:52:43] [af2352cd9a951bedd08ebe247d0de1a2]
- RMPD            [Bivariate Granger Causality] [] [2009-12-11 18:26:06] [09f192433169b2c787c4a71fde86e883]
- RMPD                [ARIMA Backward Selection] [] [2009-12-17 12:23:25] [71596e6a53ccce532e52aaf6113616ef] [Current]
Feedback Forum

Post a new message
Dataseries X:
1322.4
1089.2
1147.3
1196.4
1190.2
1146
1139.8
1045.6
1050.9
1117.3
1120
1052.1
1065.8
1092.5
1422
1367.5
1136.3
1293.7
1154.8
1206.7
1199
1265
1247.1
1116.5
1153.9
1077.4
1132.5
1058.8
1195.1
1263.4
1023.1
1141
1116.3
1135.6
1210.5
1230
1136.5
1068.7
1372.5
1049.9
1302.2
1305.9
1173.5
1277.4
1238.6
1508.6
1423.4
1375.1
1344.1
1287.5
1446.9
1451
1604.4
1501.5
1522.8
1328
1420.5
1648
1631.1
1396.6
1663.4
1283
1582.4
1785.2
1853.6
1994.1
2042.8
1586.1
1942.4
1763.6
1819.9
1836
1449.9
1513.3
1677.7
1494.4
1375.3
1577.7
1537.7
1356.6
1469.6


Summary of computational transaction
Raw Inputview raw input (R code)
Raw Outputview raw output of R engine
Computing time2 seconds
R Server'Gwilym Jenkins' @ 72.249.127.135

\begin{tabular}{lllllllll}
\hline
Summary of computational transaction \tabularnewline
Raw Input & view raw input (R code)  \tabularnewline
Raw Output & view raw output of R engine  \tabularnewline
Computing time & 2 seconds \tabularnewline
R Server & 'Gwilym Jenkins' @ 72.249.127.135 \tabularnewline
\hline
\end{tabular}
%Source: https://freestatistics.org/blog/index.php?pk=68791&T=0

[TABLE]
[ROW][C]Summary of computational transaction[/C][/ROW]
[ROW][C]Raw Input[/C][C]view raw input (R code) [/C][/ROW]
[ROW][C]Raw Output[/C][C]view raw output of R engine [/C][/ROW]
[ROW][C]Computing time[/C][C]2 seconds[/C][/ROW]
[ROW][C]R Server[/C][C]'Gwilym Jenkins' @ 72.249.127.135[/C][/ROW]
[/TABLE]
Source: https://freestatistics.org/blog/index.php?pk=68791&T=0

Globally Unique Identifier (entire table): ba.freestatistics.org/blog/index.php?pk=68791&T=0

As an alternative you can also use a QR Code:  

The GUIDs for individual cells are displayed in the table below:

Summary of computational transaction
Raw Inputview raw input (R code)
Raw Outputview raw output of R engine
Computing time2 seconds
R Server'Gwilym Jenkins' @ 72.249.127.135


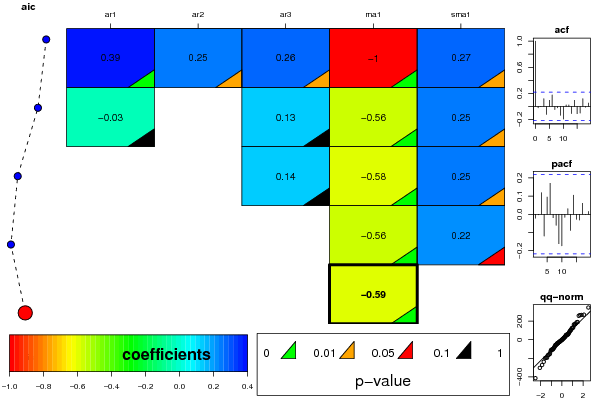
ARIMA Parameter Estimation and Backward Selection
Iterationar1ar2ar3ma1sma1
Estimates ( 1 )0.38890.25080.2645-10.2726
(p-val)(7e-04 )(0.0313 )(0.018 )(0 )(0.0246 )
Estimates ( 2 )-0.03300.1289-0.5560.2504
(p-val)(0.8814 )(NA )(0.302 )(0.0056 )(0.0453 )
Estimates ( 3 )000.1356-0.58090.2494
(p-val)(NA )(NA )(0.2516 )(0 )(0.0459 )
Estimates ( 4 )000-0.55910.2224
(p-val)(NA )(NA )(NA )(0 )(0.0765 )
Estimates ( 5 )000-0.58670
(p-val)(NA )(NA )(NA )(0 )(NA )
Estimates ( 6 )NANANANANA
(p-val)(NA )(NA )(NA )(NA )(NA )
Estimates ( 7 )NANANANANA
(p-val)(NA )(NA )(NA )(NA )(NA )
Estimates ( 8 )NANANANANA
(p-val)(NA )(NA )(NA )(NA )(NA )
Estimates ( 9 )NANANANANA
(p-val)(NA )(NA )(NA )(NA )(NA )

\begin{tabular}{lllllllll}
\hline
ARIMA Parameter Estimation and Backward Selection \tabularnewline
Iteration & ar1 & ar2 & ar3 & ma1 & sma1 \tabularnewline
Estimates ( 1 ) & 0.3889 & 0.2508 & 0.2645 & -1 & 0.2726 \tabularnewline
(p-val) & (7e-04 ) & (0.0313 ) & (0.018 ) & (0 ) & (0.0246 ) \tabularnewline
Estimates ( 2 ) & -0.033 & 0 & 0.1289 & -0.556 & 0.2504 \tabularnewline
(p-val) & (0.8814 ) & (NA ) & (0.302 ) & (0.0056 ) & (0.0453 ) \tabularnewline
Estimates ( 3 ) & 0 & 0 & 0.1356 & -0.5809 & 0.2494 \tabularnewline
(p-val) & (NA ) & (NA ) & (0.2516 ) & (0 ) & (0.0459 ) \tabularnewline
Estimates ( 4 ) & 0 & 0 & 0 & -0.5591 & 0.2224 \tabularnewline
(p-val) & (NA ) & (NA ) & (NA ) & (0 ) & (0.0765 ) \tabularnewline
Estimates ( 5 ) & 0 & 0 & 0 & -0.5867 & 0 \tabularnewline
(p-val) & (NA ) & (NA ) & (NA ) & (0 ) & (NA ) \tabularnewline
Estimates ( 6 ) & NA & NA & NA & NA & NA \tabularnewline
(p-val) & (NA ) & (NA ) & (NA ) & (NA ) & (NA ) \tabularnewline
Estimates ( 7 ) & NA & NA & NA & NA & NA \tabularnewline
(p-val) & (NA ) & (NA ) & (NA ) & (NA ) & (NA ) \tabularnewline
Estimates ( 8 ) & NA & NA & NA & NA & NA \tabularnewline
(p-val) & (NA ) & (NA ) & (NA ) & (NA ) & (NA ) \tabularnewline
Estimates ( 9 ) & NA & NA & NA & NA & NA \tabularnewline
(p-val) & (NA ) & (NA ) & (NA ) & (NA ) & (NA ) \tabularnewline
\hline
\end{tabular}
%Source: https://freestatistics.org/blog/index.php?pk=68791&T=1

[TABLE]
[ROW][C]ARIMA Parameter Estimation and Backward Selection[/C][/ROW]
[ROW][C]Iteration[/C][C]ar1[/C][C]ar2[/C][C]ar3[/C][C]ma1[/C][C]sma1[/C][/ROW]
[ROW][C]Estimates ( 1 )[/C][C]0.3889[/C][C]0.2508[/C][C]0.2645[/C][C]-1[/C][C]0.2726[/C][/ROW]
[ROW][C](p-val)[/C][C](7e-04 )[/C][C](0.0313 )[/C][C](0.018 )[/C][C](0 )[/C][C](0.0246 )[/C][/ROW]
[ROW][C]Estimates ( 2 )[/C][C]-0.033[/C][C]0[/C][C]0.1289[/C][C]-0.556[/C][C]0.2504[/C][/ROW]
[ROW][C](p-val)[/C][C](0.8814 )[/C][C](NA )[/C][C](0.302 )[/C][C](0.0056 )[/C][C](0.0453 )[/C][/ROW]
[ROW][C]Estimates ( 3 )[/C][C]0[/C][C]0[/C][C]0.1356[/C][C]-0.5809[/C][C]0.2494[/C][/ROW]
[ROW][C](p-val)[/C][C](NA )[/C][C](NA )[/C][C](0.2516 )[/C][C](0 )[/C][C](0.0459 )[/C][/ROW]
[ROW][C]Estimates ( 4 )[/C][C]0[/C][C]0[/C][C]0[/C][C]-0.5591[/C][C]0.2224[/C][/ROW]
[ROW][C](p-val)[/C][C](NA )[/C][C](NA )[/C][C](NA )[/C][C](0 )[/C][C](0.0765 )[/C][/ROW]
[ROW][C]Estimates ( 5 )[/C][C]0[/C][C]0[/C][C]0[/C][C]-0.5867[/C][C]0[/C][/ROW]
[ROW][C](p-val)[/C][C](NA )[/C][C](NA )[/C][C](NA )[/C][C](0 )[/C][C](NA )[/C][/ROW]
[ROW][C]Estimates ( 6 )[/C][C]NA[/C][C]NA[/C][C]NA[/C][C]NA[/C][C]NA[/C][/ROW]
[ROW][C](p-val)[/C][C](NA )[/C][C](NA )[/C][C](NA )[/C][C](NA )[/C][C](NA )[/C][/ROW]
[ROW][C]Estimates ( 7 )[/C][C]NA[/C][C]NA[/C][C]NA[/C][C]NA[/C][C]NA[/C][/ROW]
[ROW][C](p-val)[/C][C](NA )[/C][C](NA )[/C][C](NA )[/C][C](NA )[/C][C](NA )[/C][/ROW]
[ROW][C]Estimates ( 8 )[/C][C]NA[/C][C]NA[/C][C]NA[/C][C]NA[/C][C]NA[/C][/ROW]
[ROW][C](p-val)[/C][C](NA )[/C][C](NA )[/C][C](NA )[/C][C](NA )[/C][C](NA )[/C][/ROW]
[ROW][C]Estimates ( 9 )[/C][C]NA[/C][C]NA[/C][C]NA[/C][C]NA[/C][C]NA[/C][/ROW]
[ROW][C](p-val)[/C][C](NA )[/C][C](NA )[/C][C](NA )[/C][C](NA )[/C][C](NA )[/C][/ROW]
[/TABLE]
Source: https://freestatistics.org/blog/index.php?pk=68791&T=1

Globally Unique Identifier (entire table): ba.freestatistics.org/blog/index.php?pk=68791&T=1

As an alternative you can also use a QR Code:  

The GUIDs for individual cells are displayed in the table below:

ARIMA Parameter Estimation and Backward Selection
Iterationar1ar2ar3ma1sma1
Estimates ( 1 )0.38890.25080.2645-10.2726
(p-val)(7e-04 )(0.0313 )(0.018 )(0 )(0.0246 )
Estimates ( 2 )-0.03300.1289-0.5560.2504
(p-val)(0.8814 )(NA )(0.302 )(0.0056 )(0.0453 )
Estimates ( 3 )000.1356-0.58090.2494
(p-val)(NA )(NA )(0.2516 )(0 )(0.0459 )
Estimates ( 4 )000-0.55910.2224
(p-val)(NA )(NA )(NA )(0 )(0.0765 )
Estimates ( 5 )000-0.58670
(p-val)(NA )(NA )(NA )(0 )(NA )
Estimates ( 6 )NANANANANA
(p-val)(NA )(NA )(NA )(NA )(NA )
Estimates ( 7 )NANANANANA
(p-val)(NA )(NA )(NA )(NA )(NA )
Estimates ( 8 )NANANANANA
(p-val)(NA )(NA )(NA )(NA )(NA )
Estimates ( 9 )NANANANANA
(p-val)(NA )(NA )(NA )(NA )(NA )


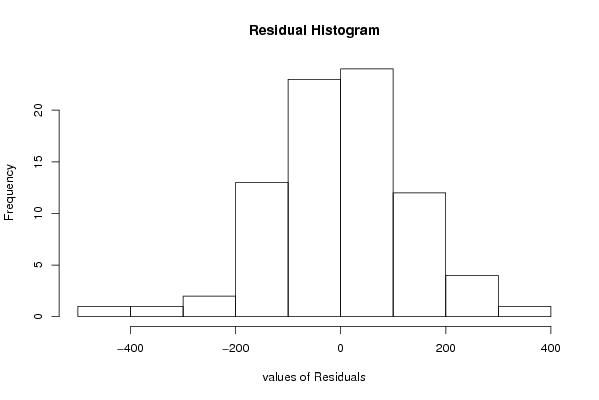
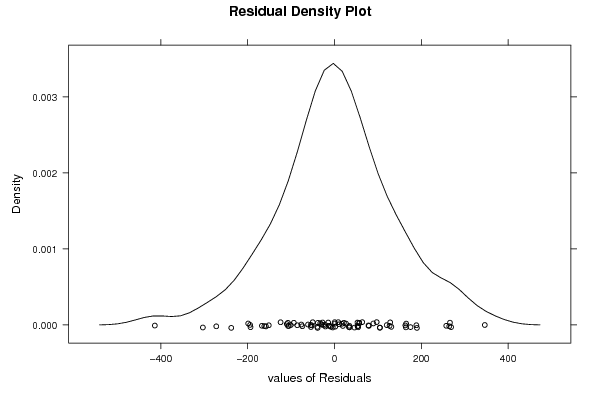
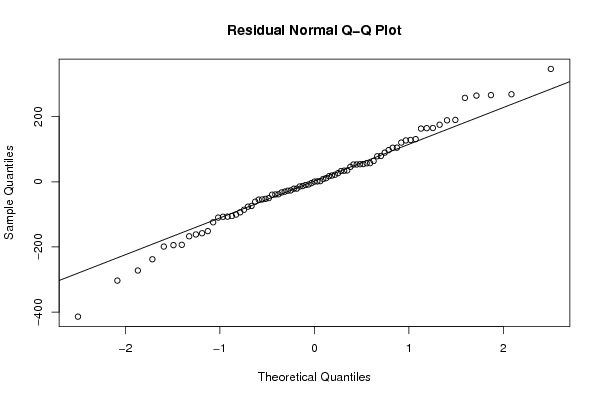
Estimated ARIMA Residuals
Value
1.32239908923026
-198.695969292951
-38.8258547893241
26.7010829087054
8.6876076901968
-38.2659113053339
-27.4143713371379
-107.264598885902
-54.7860309448781
34.188737453394
21.7489370252606
-54.1219158402805
-39.5320094939942
54.0080679866638
346.349006960169
128.451464104984
-157.817339766154
78.351548256856
-93.6236955562506
19.4359395982899
2.05304924688231
53.0177945130826
11.1895072167813
-109.821867780115
-20.967202363485
-105.068780733800
-73.9885994353073
-100.656290846427
131.017324245361
104.546790493881
-151.316248388005
17.3569842399628
-13.0376896541730
0.489840591326389
79.267379557419
89.5946214407044
-52.4130909119827
-76.3362785528505
264.517025060564
-161.533336762969
120.347567443937
64.0215776104083
-49.9655348094616
53.2964299816905
-3.94732478823684
266.062806138734
45.9807796985562
-32.6619384086238
-26.4674341442036
-60.937482323429
57.0221289557427
104.782558177311
165.1369523156
-9.85355925509095
34.8609759841153
-193.373574723796
-8.10409206531696
163.314720841515
97.2542948270346
-167.149780150889
175.178247107948
-272.204555081690
126.965706038675
257.569980029648
188.702185642345
268.716437947414
189.951746282412
-303.171465920752
164.571235783460
-124.118296542923
-14.4130468825157
57.3015108239108
-413.798782161496
-85.6310078160027
54.4541201830663
-194.348291390475
-237.693417992601
33.2199080908088
-30.2612262430432
-106.987697525117
-21.0975782968355

\begin{tabular}{lllllllll}
\hline
Estimated ARIMA Residuals \tabularnewline
Value \tabularnewline
1.32239908923026 \tabularnewline
-198.695969292951 \tabularnewline
-38.8258547893241 \tabularnewline
26.7010829087054 \tabularnewline
8.6876076901968 \tabularnewline
-38.2659113053339 \tabularnewline
-27.4143713371379 \tabularnewline
-107.264598885902 \tabularnewline
-54.7860309448781 \tabularnewline
34.188737453394 \tabularnewline
21.7489370252606 \tabularnewline
-54.1219158402805 \tabularnewline
-39.5320094939942 \tabularnewline
54.0080679866638 \tabularnewline
346.349006960169 \tabularnewline
128.451464104984 \tabularnewline
-157.817339766154 \tabularnewline
78.351548256856 \tabularnewline
-93.6236955562506 \tabularnewline
19.4359395982899 \tabularnewline
2.05304924688231 \tabularnewline
53.0177945130826 \tabularnewline
11.1895072167813 \tabularnewline
-109.821867780115 \tabularnewline
-20.967202363485 \tabularnewline
-105.068780733800 \tabularnewline
-73.9885994353073 \tabularnewline
-100.656290846427 \tabularnewline
131.017324245361 \tabularnewline
104.546790493881 \tabularnewline
-151.316248388005 \tabularnewline
17.3569842399628 \tabularnewline
-13.0376896541730 \tabularnewline
0.489840591326389 \tabularnewline
79.267379557419 \tabularnewline
89.5946214407044 \tabularnewline
-52.4130909119827 \tabularnewline
-76.3362785528505 \tabularnewline
264.517025060564 \tabularnewline
-161.533336762969 \tabularnewline
120.347567443937 \tabularnewline
64.0215776104083 \tabularnewline
-49.9655348094616 \tabularnewline
53.2964299816905 \tabularnewline
-3.94732478823684 \tabularnewline
266.062806138734 \tabularnewline
45.9807796985562 \tabularnewline
-32.6619384086238 \tabularnewline
-26.4674341442036 \tabularnewline
-60.937482323429 \tabularnewline
57.0221289557427 \tabularnewline
104.782558177311 \tabularnewline
165.1369523156 \tabularnewline
-9.85355925509095 \tabularnewline
34.8609759841153 \tabularnewline
-193.373574723796 \tabularnewline
-8.10409206531696 \tabularnewline
163.314720841515 \tabularnewline
97.2542948270346 \tabularnewline
-167.149780150889 \tabularnewline
175.178247107948 \tabularnewline
-272.204555081690 \tabularnewline
126.965706038675 \tabularnewline
257.569980029648 \tabularnewline
188.702185642345 \tabularnewline
268.716437947414 \tabularnewline
189.951746282412 \tabularnewline
-303.171465920752 \tabularnewline
164.571235783460 \tabularnewline
-124.118296542923 \tabularnewline
-14.4130468825157 \tabularnewline
57.3015108239108 \tabularnewline
-413.798782161496 \tabularnewline
-85.6310078160027 \tabularnewline
54.4541201830663 \tabularnewline
-194.348291390475 \tabularnewline
-237.693417992601 \tabularnewline
33.2199080908088 \tabularnewline
-30.2612262430432 \tabularnewline
-106.987697525117 \tabularnewline
-21.0975782968355 \tabularnewline
\hline
\end{tabular}
%Source: https://freestatistics.org/blog/index.php?pk=68791&T=2

[TABLE]
[ROW][C]Estimated ARIMA Residuals[/C][/ROW]
[ROW][C]Value[/C][/ROW]
[ROW][C]1.32239908923026[/C][/ROW]
[ROW][C]-198.695969292951[/C][/ROW]
[ROW][C]-38.8258547893241[/C][/ROW]
[ROW][C]26.7010829087054[/C][/ROW]
[ROW][C]8.6876076901968[/C][/ROW]
[ROW][C]-38.2659113053339[/C][/ROW]
[ROW][C]-27.4143713371379[/C][/ROW]
[ROW][C]-107.264598885902[/C][/ROW]
[ROW][C]-54.7860309448781[/C][/ROW]
[ROW][C]34.188737453394[/C][/ROW]
[ROW][C]21.7489370252606[/C][/ROW]
[ROW][C]-54.1219158402805[/C][/ROW]
[ROW][C]-39.5320094939942[/C][/ROW]
[ROW][C]54.0080679866638[/C][/ROW]
[ROW][C]346.349006960169[/C][/ROW]
[ROW][C]128.451464104984[/C][/ROW]
[ROW][C]-157.817339766154[/C][/ROW]
[ROW][C]78.351548256856[/C][/ROW]
[ROW][C]-93.6236955562506[/C][/ROW]
[ROW][C]19.4359395982899[/C][/ROW]
[ROW][C]2.05304924688231[/C][/ROW]
[ROW][C]53.0177945130826[/C][/ROW]
[ROW][C]11.1895072167813[/C][/ROW]
[ROW][C]-109.821867780115[/C][/ROW]
[ROW][C]-20.967202363485[/C][/ROW]
[ROW][C]-105.068780733800[/C][/ROW]
[ROW][C]-73.9885994353073[/C][/ROW]
[ROW][C]-100.656290846427[/C][/ROW]
[ROW][C]131.017324245361[/C][/ROW]
[ROW][C]104.546790493881[/C][/ROW]
[ROW][C]-151.316248388005[/C][/ROW]
[ROW][C]17.3569842399628[/C][/ROW]
[ROW][C]-13.0376896541730[/C][/ROW]
[ROW][C]0.489840591326389[/C][/ROW]
[ROW][C]79.267379557419[/C][/ROW]
[ROW][C]89.5946214407044[/C][/ROW]
[ROW][C]-52.4130909119827[/C][/ROW]
[ROW][C]-76.3362785528505[/C][/ROW]
[ROW][C]264.517025060564[/C][/ROW]
[ROW][C]-161.533336762969[/C][/ROW]
[ROW][C]120.347567443937[/C][/ROW]
[ROW][C]64.0215776104083[/C][/ROW]
[ROW][C]-49.9655348094616[/C][/ROW]
[ROW][C]53.2964299816905[/C][/ROW]
[ROW][C]-3.94732478823684[/C][/ROW]
[ROW][C]266.062806138734[/C][/ROW]
[ROW][C]45.9807796985562[/C][/ROW]
[ROW][C]-32.6619384086238[/C][/ROW]
[ROW][C]-26.4674341442036[/C][/ROW]
[ROW][C]-60.937482323429[/C][/ROW]
[ROW][C]57.0221289557427[/C][/ROW]
[ROW][C]104.782558177311[/C][/ROW]
[ROW][C]165.1369523156[/C][/ROW]
[ROW][C]-9.85355925509095[/C][/ROW]
[ROW][C]34.8609759841153[/C][/ROW]
[ROW][C]-193.373574723796[/C][/ROW]
[ROW][C]-8.10409206531696[/C][/ROW]
[ROW][C]163.314720841515[/C][/ROW]
[ROW][C]97.2542948270346[/C][/ROW]
[ROW][C]-167.149780150889[/C][/ROW]
[ROW][C]175.178247107948[/C][/ROW]
[ROW][C]-272.204555081690[/C][/ROW]
[ROW][C]126.965706038675[/C][/ROW]
[ROW][C]257.569980029648[/C][/ROW]
[ROW][C]188.702185642345[/C][/ROW]
[ROW][C]268.716437947414[/C][/ROW]
[ROW][C]189.951746282412[/C][/ROW]
[ROW][C]-303.171465920752[/C][/ROW]
[ROW][C]164.571235783460[/C][/ROW]
[ROW][C]-124.118296542923[/C][/ROW]
[ROW][C]-14.4130468825157[/C][/ROW]
[ROW][C]57.3015108239108[/C][/ROW]
[ROW][C]-413.798782161496[/C][/ROW]
[ROW][C]-85.6310078160027[/C][/ROW]
[ROW][C]54.4541201830663[/C][/ROW]
[ROW][C]-194.348291390475[/C][/ROW]
[ROW][C]-237.693417992601[/C][/ROW]
[ROW][C]33.2199080908088[/C][/ROW]
[ROW][C]-30.2612262430432[/C][/ROW]
[ROW][C]-106.987697525117[/C][/ROW]
[ROW][C]-21.0975782968355[/C][/ROW]
[/TABLE]
Source: https://freestatistics.org/blog/index.php?pk=68791&T=2

Globally Unique Identifier (entire table): ba.freestatistics.org/blog/index.php?pk=68791&T=2

As an alternative you can also use a QR Code:  

The GUIDs for individual cells are displayed in the table below:

Estimated ARIMA Residuals
Value
1.32239908923026
-198.695969292951
-38.8258547893241
26.7010829087054
8.6876076901968
-38.2659113053339
-27.4143713371379
-107.264598885902
-54.7860309448781
34.188737453394
21.7489370252606
-54.1219158402805
-39.5320094939942
54.0080679866638
346.349006960169
128.451464104984
-157.817339766154
78.351548256856
-93.6236955562506
19.4359395982899
2.05304924688231
53.0177945130826
11.1895072167813
-109.821867780115
-20.967202363485
-105.068780733800
-73.9885994353073
-100.656290846427
131.017324245361
104.546790493881
-151.316248388005
17.3569842399628
-13.0376896541730
0.489840591326389
79.267379557419
89.5946214407044
-52.4130909119827
-76.3362785528505
264.517025060564
-161.533336762969
120.347567443937
64.0215776104083
-49.9655348094616
53.2964299816905
-3.94732478823684
266.062806138734
45.9807796985562
-32.6619384086238
-26.4674341442036
-60.937482323429
57.0221289557427
104.782558177311
165.1369523156
-9.85355925509095
34.8609759841153
-193.373574723796
-8.10409206531696
163.314720841515
97.2542948270346
-167.149780150889
175.178247107948
-272.204555081690
126.965706038675
257.569980029648
188.702185642345
268.716437947414
189.951746282412
-303.171465920752
164.571235783460
-124.118296542923
-14.4130468825157
57.3015108239108
-413.798782161496
-85.6310078160027
54.4541201830663
-194.348291390475
-237.693417992601
33.2199080908088
-30.2612262430432
-106.987697525117
-21.0975782968355


Parameters (Session):
par1 = FALSE ; par2 = 1 ; par3 = 1 ; par4 = 0 ; par5 = 12 ; par6 = 3 ; par7 = 1 ; par8 = 0 ; par9 = 1 ;
Parameters (R input):
par1 = FALSE ; par2 = 1 ; par3 = 1 ; par4 = 0 ; par5 = 12 ; par6 = 3 ; par7 = 1 ; par8 = 0 ; par9 = 1 ;
R code (references can be found in the software module):
library(lattice)
if (par1 == 'TRUE') par1 <- TRUE
if (par1 == 'FALSE') par1 <- FALSE
par2 <- as.numeric(par2) #Box-Cox lambda transformation parameter
par3 <- as.numeric(par3) #degree of non-seasonal differencing
par4 <- as.numeric(par4) #degree of seasonal differencing
par5 <- as.numeric(par5) #seasonal period
par6 <- as.numeric(par6) #degree (p) of the non-seasonal AR(p) polynomial
par7 <- as.numeric(par7) #degree (q) of the non-seasonal MA(q) polynomial
par8 <- as.numeric(par8) #degree (P) of the seasonal AR(P) polynomial
par9 <- as.numeric(par9) #degree (Q) of the seasonal MA(Q) polynomial
armaGR <- function(arima.out, names, n){
try1 <- arima.out$coef
try2 <- sqrt(diag(arima.out$var.coef))
try.data.frame <- data.frame(matrix(NA,ncol=4,nrow=length(names)))
dimnames(try.data.frame) <- list(names,c('coef','std','tstat','pv'))
try.data.frame[,1] <- try1
for(i in 1:length(try2)) try.data.frame[which(rownames(try.data.frame)==names(try2)[i]),2] <- try2[i]
try.data.frame[,3] <- try.data.frame[,1] / try.data.frame[,2]
try.data.frame[,4] <- round((1-pt(abs(try.data.frame[,3]),df=n-(length(try2)+1)))*2,5)
vector <- rep(NA,length(names))
vector[is.na(try.data.frame[,4])] <- 0
maxi <- which.max(try.data.frame[,4])
continue <- max(try.data.frame[,4],na.rm=TRUE) > .05
vector[maxi] <- 0
list(summary=try.data.frame,next.vector=vector,continue=continue)
}
arimaSelect <- function(series, order=c(13,0,0), seasonal=list(order=c(2,0,0),period=12), include.mean=F){
nrc <- order[1]+order[3]+seasonal$order[1]+seasonal$order[3]
coeff <- matrix(NA, nrow=nrc*2, ncol=nrc)
pval <- matrix(NA, nrow=nrc*2, ncol=nrc)
mylist <- rep(list(NULL), nrc)
names <- NULL
if(order[1] > 0) names <- paste('ar',1:order[1],sep='')
if(order[3] > 0) names <- c( names , paste('ma',1:order[3],sep='') )
if(seasonal$order[1] > 0) names <- c(names, paste('sar',1:seasonal$order[1],sep=''))
if(seasonal$order[3] > 0) names <- c(names, paste('sma',1:seasonal$order[3],sep=''))
arima.out <- arima(series, order=order, seasonal=seasonal, include.mean=include.mean, method='ML')
mylist[[1]] <- arima.out
last.arma <- armaGR(arima.out, names, length(series))
mystop <- FALSE
i <- 1
coeff[i,] <- last.arma[[1]][,1]
pval [i,] <- last.arma[[1]][,4]
i <- 2
aic <- arima.out$aic
while(!mystop){
mylist[[i]] <- arima.out
arima.out <- arima(series, order=order, seasonal=seasonal, include.mean=include.mean, method='ML', fixed=last.arma$next.vector)
aic <- c(aic, arima.out$aic)
last.arma <- armaGR(arima.out, names, length(series))
mystop <- !last.arma$continue
coeff[i,] <- last.arma[[1]][,1]
pval [i,] <- last.arma[[1]][,4]
i <- i+1
}
list(coeff, pval, mylist, aic=aic)
}
arimaSelectplot <- function(arimaSelect.out,noms,choix){
noms <- names(arimaSelect.out[[3]][[1]]$coef)
coeff <- arimaSelect.out[[1]]
k <- min(which(is.na(coeff[,1])))-1
coeff <- coeff[1:k,]
pval <- arimaSelect.out[[2]][1:k,]
aic <- arimaSelect.out$aic[1:k]
coeff[coeff==0] <- NA
n <- ncol(coeff)
if(missing(choix)) choix <- k
layout(matrix(c(1,1,1,2,
3,3,3,2,
3,3,3,4,
5,6,7,7),nr=4),
widths=c(10,35,45,15),
heights=c(30,30,15,15))
couleurs <- rainbow(75)[1:50]#(50)
ticks <- pretty(coeff)
par(mar=c(1,1,3,1))
plot(aic,k:1-.5,type='o',pch=21,bg='blue',cex=2,axes=F,lty=2,xpd=NA)
points(aic[choix],k-choix+.5,pch=21,cex=4,bg=2,xpd=NA)
title('aic',line=2)
par(mar=c(3,0,0,0))
plot(0,axes=F,xlab='',ylab='',xlim=range(ticks),ylim=c(.1,1))
rect(xleft = min(ticks) + (0:49)/50*(max(ticks)-min(ticks)),
xright = min(ticks) + (1:50)/50*(max(ticks)-min(ticks)),
ytop = rep(1,50),
ybottom= rep(0,50),col=couleurs,border=NA)
axis(1,ticks)
rect(xleft=min(ticks),xright=max(ticks),ytop=1,ybottom=0)
text(mean(coeff,na.rm=T),.5,'coefficients',cex=2,font=2)
par(mar=c(1,1,3,1))
image(1:n,1:k,t(coeff[k:1,]),axes=F,col=couleurs,zlim=range(ticks))
for(i in 1:n) for(j in 1:k) if(!is.na(coeff[j,i])) {
if(pval[j,i]<.01) symb = 'green'
else if( (pval[j,i]<.05) & (pval[j,i]>=.01)) symb = 'orange'
else if( (pval[j,i]<.1) & (pval[j,i]>=.05)) symb = 'red'
else symb = 'black'
polygon(c(i+.5 ,i+.2 ,i+.5 ,i+.5),
c(k-j+0.5,k-j+0.5,k-j+0.8,k-j+0.5),
col=symb)
if(j==choix) {
rect(xleft=i-.5,
xright=i+.5,
ybottom=k-j+1.5,
ytop=k-j+.5,
lwd=4)
text(i,
k-j+1,
round(coeff[j,i],2),
cex=1.2,
font=2)
}
else{
rect(xleft=i-.5,xright=i+.5,ybottom=k-j+1.5,ytop=k-j+.5)
text(i,k-j+1,round(coeff[j,i],2),cex=1.2,font=1)
}
}
axis(3,1:n,noms)
par(mar=c(0.5,0,0,0.5))
plot(0,axes=F,xlab='',ylab='',type='n',xlim=c(0,8),ylim=c(-.2,.8))
cols <- c('green','orange','red','black')
niv <- c('0','0.01','0.05','0.1')
for(i in 0:3){
polygon(c(1+2*i ,1+2*i ,1+2*i-.5 ,1+2*i),
c(.4 ,.7 , .4 , .4),
col=cols[i+1])
text(2*i,0.5,niv[i+1],cex=1.5)
}
text(8,.5,1,cex=1.5)
text(4,0,'p-value',cex=2)
box()
residus <- arimaSelect.out[[3]][[choix]]$res
par(mar=c(1,2,4,1))
acf(residus,main='')
title('acf',line=.5)
par(mar=c(1,2,4,1))
pacf(residus,main='')
title('pacf',line=.5)
par(mar=c(2,2,4,1))
qqnorm(residus,main='')
title('qq-norm',line=.5)
qqline(residus)
residus
}
if (par2 == 0) x <- log(x)
if (par2 != 0) x <- x^par2
(selection <- arimaSelect(x, order=c(par6,par3,par7), seasonal=list(order=c(par8,par4,par9), period=par5)))
bitmap(file='test1.png')
resid <- arimaSelectplot(selection)
dev.off()
resid
bitmap(file='test2.png')
acf(resid,length(resid)/2, main='Residual Autocorrelation Function')
dev.off()
bitmap(file='test3.png')
pacf(resid,length(resid)/2, main='Residual Partial Autocorrelation Function')
dev.off()
bitmap(file='test4.png')
cpgram(resid, main='Residual Cumulative Periodogram')
dev.off()
bitmap(file='test5.png')
hist(resid, main='Residual Histogram', xlab='values of Residuals')
dev.off()
bitmap(file='test6.png')
densityplot(~resid,col='black',main='Residual Density Plot', xlab='values of Residuals')
dev.off()
bitmap(file='test7.png')
qqnorm(resid, main='Residual Normal Q-Q Plot')
qqline(resid)
dev.off()
ncols <- length(selection[[1]][1,])
nrows <- length(selection[[2]][,1])-1
load(file='createtable')
a<-table.start()
a<-table.row.start(a)
a<-table.element(a,'ARIMA Parameter Estimation and Backward Selection', ncols+1,TRUE)
a<-table.row.end(a)
a<-table.row.start(a)
a<-table.element(a,'Iteration', header=TRUE)
for (i in 1:ncols) {
a<-table.element(a,names(selection[[3]][[1]]$coef)[i],header=TRUE)
}
a<-table.row.end(a)
for (j in 1:nrows) {
a<-table.row.start(a)
mydum <- 'Estimates ('
mydum <- paste(mydum,j)
mydum <- paste(mydum,')')
a<-table.element(a,mydum, header=TRUE)
for (i in 1:ncols) {
a<-table.element(a,round(selection[[1]][j,i],4))
}
a<-table.row.end(a)
a<-table.row.start(a)
a<-table.element(a,'(p-val)', header=TRUE)
for (i in 1:ncols) {
mydum <- '('
mydum <- paste(mydum,round(selection[[2]][j,i],4),sep='')
mydum <- paste(mydum,')')
a<-table.element(a,mydum)
}
a<-table.row.end(a)
}
a<-table.end(a)
table.save(a,file='mytable.tab')
a<-table.start()
a<-table.row.start(a)
a<-table.element(a,'Estimated ARIMA Residuals', 1,TRUE)
a<-table.row.end(a)
a<-table.row.start(a)
a<-table.element(a,'Value', 1,TRUE)
a<-table.row.end(a)
for (i in (par4*par5+par3):length(resid)) {
a<-table.row.start(a)
a<-table.element(a,resid[i])
a<-table.row.end(a)
}
a<-table.end(a)
table.save(a,file='mytable1.tab')