Free Statistics

of Irreproducible Research!

Author's title

Author*The author of this computation has been verified*
R Software Modulerwasp_arimabackwardselection.wasp
Title produced by softwareARIMA Backward Selection
Date of computationFri, 18 Dec 2009 15:06:40 -0700
Cite this page as followsStatistical Computations at FreeStatistics.org, Office for Research Development and Education, URL https://freestatistics.org/blog/index.php?v=date/2009/Dec/18/t1261174097qodm7ob6eukd3x7.htm/, Retrieved Sat, 27 Apr 2024 08:04:17 +0000
Statistical Computations at FreeStatistics.org, Office for Research Development and Education, URL https://freestatistics.org/blog/index.php?pk=69457, Retrieved Sat, 27 Apr 2024 08:04:17 +0000
QR Codes:

Original text written by user:
IsPrivate?No (this computation is public)
User-defined keywords
Estimated Impact121
Family? (F = Feedback message, R = changed R code, M = changed R Module, P = changed Parameters, D = changed Data)
-     [Standard Deviation-Mean Plot] [autocorrelation] [2009-12-12 14:01:45] [f84db15a18b564cd160ebc7b4eade151]
- RMP     [ARIMA Backward Selection] [Paper. ARIMA Back...] [2009-12-18 22:06:40] [852eae237d08746109043531619a60c9] [Current]
-    D      [ARIMA Backward Selection] [ARIMA Backward Se...] [2010-12-21 20:10:27] [616fb52b46273b7e6805de1e68b3a688]
Feedback Forum

Post a new message
Dataseries X:
593530
610763
612613
611324
594167
595454
590865
589379
584428
573100
567456
569028
620735
628884
628232
612117
595404
597141
593408
590072
579799
574205
572775
572942
619567
625809
619916
587625
565742
557274
560576
548854
531673
525919
511038
498662
555362
564591
541657
527070
509846
514258
516922
507561
492622
490243
469357
477580
528379
533590
517945
506174
501866
516141
528222
532638
536322
536535
523597
536214
586570


Summary of computational transaction
Raw Inputview raw input (R code)
Raw Outputview raw output of R engine
Computing time15 seconds
R Server'Gwilym Jenkins' @ 72.249.127.135

\begin{tabular}{lllllllll}
\hline
Summary of computational transaction \tabularnewline
Raw Input & view raw input (R code)  \tabularnewline
Raw Output & view raw output of R engine  \tabularnewline
Computing time & 15 seconds \tabularnewline
R Server & 'Gwilym Jenkins' @ 72.249.127.135 \tabularnewline
\hline
\end{tabular}
%Source: https://freestatistics.org/blog/index.php?pk=69457&T=0

[TABLE]
[ROW][C]Summary of computational transaction[/C][/ROW]
[ROW][C]Raw Input[/C][C]view raw input (R code) [/C][/ROW]
[ROW][C]Raw Output[/C][C]view raw output of R engine [/C][/ROW]
[ROW][C]Computing time[/C][C]15 seconds[/C][/ROW]
[ROW][C]R Server[/C][C]'Gwilym Jenkins' @ 72.249.127.135[/C][/ROW]
[/TABLE]
Source: https://freestatistics.org/blog/index.php?pk=69457&T=0

Globally Unique Identifier (entire table): ba.freestatistics.org/blog/index.php?pk=69457&T=0

As an alternative you can also use a QR Code:  

The GUIDs for individual cells are displayed in the table below:

Summary of computational transaction
Raw Inputview raw input (R code)
Raw Outputview raw output of R engine
Computing time15 seconds
R Server'Gwilym Jenkins' @ 72.249.127.135


ARIMA Parameter Estimation and Backward Selection
Iterationar1ar2ar3ma1sar1sar2sma1
Estimates ( 1 )0.53390.12910.1345-0.4404-0.8939-0.49440.9947
(p-val)(0.4122 )(0.4943 )(0.6351 )(0.4927 )(0 )(0.0229 )(0.4162 )
Estimates ( 2 )0.7930.11110-0.692-0.8518-0.54041.0046
(p-val)(0.0045 )(0.5286 )(NA )(0.0068 )(0 )(0.0022 )(0.4542 )
Estimates ( 3 )0.934100-0.7691-0.8446-0.56731.0007
(p-val)(0 )(NA )(NA )(0 )(0 )(8e-04 )(0.4113 )
Estimates ( 4 )0.91400-0.7526-0.2611-0.41330
(p-val)(0 )(NA )(NA )(1e-04 )(0.0978 )(0.0245 )(NA )
Estimates ( 5 )0.909300-0.78030-0.31970
(p-val)(0 )(NA )(NA )(0 )(NA )(0.0994 )(NA )
Estimates ( 6 )0.926700-0.7795000
(p-val)(0 )(NA )(NA )(0 )(NA )(NA )(NA )
Estimates ( 7 )NANANANANANANA
(p-val)(NA )(NA )(NA )(NA )(NA )(NA )(NA )
Estimates ( 8 )NANANANANANANA
(p-val)(NA )(NA )(NA )(NA )(NA )(NA )(NA )
Estimates ( 9 )NANANANANANANA
(p-val)(NA )(NA )(NA )(NA )(NA )(NA )(NA )
Estimates ( 10 )NANANANANANANA
(p-val)(NA )(NA )(NA )(NA )(NA )(NA )(NA )
Estimates ( 11 )NANANANANANANA
(p-val)(NA )(NA )(NA )(NA )(NA )(NA )(NA )
Estimates ( 12 )NANANANANANANA
(p-val)(NA )(NA )(NA )(NA )(NA )(NA )(NA )
Estimates ( 13 )NANANANANANANA
(p-val)(NA )(NA )(NA )(NA )(NA )(NA )(NA )

\begin{tabular}{lllllllll}
\hline
ARIMA Parameter Estimation and Backward Selection \tabularnewline
Iteration & ar1 & ar2 & ar3 & ma1 & sar1 & sar2 & sma1 \tabularnewline
Estimates ( 1 ) & 0.5339 & 0.1291 & 0.1345 & -0.4404 & -0.8939 & -0.4944 & 0.9947 \tabularnewline
(p-val) & (0.4122 ) & (0.4943 ) & (0.6351 ) & (0.4927 ) & (0 ) & (0.0229 ) & (0.4162 ) \tabularnewline
Estimates ( 2 ) & 0.793 & 0.1111 & 0 & -0.692 & -0.8518 & -0.5404 & 1.0046 \tabularnewline
(p-val) & (0.0045 ) & (0.5286 ) & (NA ) & (0.0068 ) & (0 ) & (0.0022 ) & (0.4542 ) \tabularnewline
Estimates ( 3 ) & 0.9341 & 0 & 0 & -0.7691 & -0.8446 & -0.5673 & 1.0007 \tabularnewline
(p-val) & (0 ) & (NA ) & (NA ) & (0 ) & (0 ) & (8e-04 ) & (0.4113 ) \tabularnewline
Estimates ( 4 ) & 0.914 & 0 & 0 & -0.7526 & -0.2611 & -0.4133 & 0 \tabularnewline
(p-val) & (0 ) & (NA ) & (NA ) & (1e-04 ) & (0.0978 ) & (0.0245 ) & (NA ) \tabularnewline
Estimates ( 5 ) & 0.9093 & 0 & 0 & -0.7803 & 0 & -0.3197 & 0 \tabularnewline
(p-val) & (0 ) & (NA ) & (NA ) & (0 ) & (NA ) & (0.0994 ) & (NA ) \tabularnewline
Estimates ( 6 ) & 0.9267 & 0 & 0 & -0.7795 & 0 & 0 & 0 \tabularnewline
(p-val) & (0 ) & (NA ) & (NA ) & (0 ) & (NA ) & (NA ) & (NA ) \tabularnewline
Estimates ( 7 ) & NA & NA & NA & NA & NA & NA & NA \tabularnewline
(p-val) & (NA ) & (NA ) & (NA ) & (NA ) & (NA ) & (NA ) & (NA ) \tabularnewline
Estimates ( 8 ) & NA & NA & NA & NA & NA & NA & NA \tabularnewline
(p-val) & (NA ) & (NA ) & (NA ) & (NA ) & (NA ) & (NA ) & (NA ) \tabularnewline
Estimates ( 9 ) & NA & NA & NA & NA & NA & NA & NA \tabularnewline
(p-val) & (NA ) & (NA ) & (NA ) & (NA ) & (NA ) & (NA ) & (NA ) \tabularnewline
Estimates ( 10 ) & NA & NA & NA & NA & NA & NA & NA \tabularnewline
(p-val) & (NA ) & (NA ) & (NA ) & (NA ) & (NA ) & (NA ) & (NA ) \tabularnewline
Estimates ( 11 ) & NA & NA & NA & NA & NA & NA & NA \tabularnewline
(p-val) & (NA ) & (NA ) & (NA ) & (NA ) & (NA ) & (NA ) & (NA ) \tabularnewline
Estimates ( 12 ) & NA & NA & NA & NA & NA & NA & NA \tabularnewline
(p-val) & (NA ) & (NA ) & (NA ) & (NA ) & (NA ) & (NA ) & (NA ) \tabularnewline
Estimates ( 13 ) & NA & NA & NA & NA & NA & NA & NA \tabularnewline
(p-val) & (NA ) & (NA ) & (NA ) & (NA ) & (NA ) & (NA ) & (NA ) \tabularnewline
\hline
\end{tabular}
%Source: https://freestatistics.org/blog/index.php?pk=69457&T=1

[TABLE]
[ROW][C]ARIMA Parameter Estimation and Backward Selection[/C][/ROW]
[ROW][C]Iteration[/C][C]ar1[/C][C]ar2[/C][C]ar3[/C][C]ma1[/C][C]sar1[/C][C]sar2[/C][C]sma1[/C][/ROW]
[ROW][C]Estimates ( 1 )[/C][C]0.5339[/C][C]0.1291[/C][C]0.1345[/C][C]-0.4404[/C][C]-0.8939[/C][C]-0.4944[/C][C]0.9947[/C][/ROW]
[ROW][C](p-val)[/C][C](0.4122 )[/C][C](0.4943 )[/C][C](0.6351 )[/C][C](0.4927 )[/C][C](0 )[/C][C](0.0229 )[/C][C](0.4162 )[/C][/ROW]
[ROW][C]Estimates ( 2 )[/C][C]0.793[/C][C]0.1111[/C][C]0[/C][C]-0.692[/C][C]-0.8518[/C][C]-0.5404[/C][C]1.0046[/C][/ROW]
[ROW][C](p-val)[/C][C](0.0045 )[/C][C](0.5286 )[/C][C](NA )[/C][C](0.0068 )[/C][C](0 )[/C][C](0.0022 )[/C][C](0.4542 )[/C][/ROW]
[ROW][C]Estimates ( 3 )[/C][C]0.9341[/C][C]0[/C][C]0[/C][C]-0.7691[/C][C]-0.8446[/C][C]-0.5673[/C][C]1.0007[/C][/ROW]
[ROW][C](p-val)[/C][C](0 )[/C][C](NA )[/C][C](NA )[/C][C](0 )[/C][C](0 )[/C][C](8e-04 )[/C][C](0.4113 )[/C][/ROW]
[ROW][C]Estimates ( 4 )[/C][C]0.914[/C][C]0[/C][C]0[/C][C]-0.7526[/C][C]-0.2611[/C][C]-0.4133[/C][C]0[/C][/ROW]
[ROW][C](p-val)[/C][C](0 )[/C][C](NA )[/C][C](NA )[/C][C](1e-04 )[/C][C](0.0978 )[/C][C](0.0245 )[/C][C](NA )[/C][/ROW]
[ROW][C]Estimates ( 5 )[/C][C]0.9093[/C][C]0[/C][C]0[/C][C]-0.7803[/C][C]0[/C][C]-0.3197[/C][C]0[/C][/ROW]
[ROW][C](p-val)[/C][C](0 )[/C][C](NA )[/C][C](NA )[/C][C](0 )[/C][C](NA )[/C][C](0.0994 )[/C][C](NA )[/C][/ROW]
[ROW][C]Estimates ( 6 )[/C][C]0.9267[/C][C]0[/C][C]0[/C][C]-0.7795[/C][C]0[/C][C]0[/C][C]0[/C][/ROW]
[ROW][C](p-val)[/C][C](0 )[/C][C](NA )[/C][C](NA )[/C][C](0 )[/C][C](NA )[/C][C](NA )[/C][C](NA )[/C][/ROW]
[ROW][C]Estimates ( 7 )[/C][C]NA[/C][C]NA[/C][C]NA[/C][C]NA[/C][C]NA[/C][C]NA[/C][C]NA[/C][/ROW]
[ROW][C](p-val)[/C][C](NA )[/C][C](NA )[/C][C](NA )[/C][C](NA )[/C][C](NA )[/C][C](NA )[/C][C](NA )[/C][/ROW]
[ROW][C]Estimates ( 8 )[/C][C]NA[/C][C]NA[/C][C]NA[/C][C]NA[/C][C]NA[/C][C]NA[/C][C]NA[/C][/ROW]
[ROW][C](p-val)[/C][C](NA )[/C][C](NA )[/C][C](NA )[/C][C](NA )[/C][C](NA )[/C][C](NA )[/C][C](NA )[/C][/ROW]
[ROW][C]Estimates ( 9 )[/C][C]NA[/C][C]NA[/C][C]NA[/C][C]NA[/C][C]NA[/C][C]NA[/C][C]NA[/C][/ROW]
[ROW][C](p-val)[/C][C](NA )[/C][C](NA )[/C][C](NA )[/C][C](NA )[/C][C](NA )[/C][C](NA )[/C][C](NA )[/C][/ROW]
[ROW][C]Estimates ( 10 )[/C][C]NA[/C][C]NA[/C][C]NA[/C][C]NA[/C][C]NA[/C][C]NA[/C][C]NA[/C][/ROW]
[ROW][C](p-val)[/C][C](NA )[/C][C](NA )[/C][C](NA )[/C][C](NA )[/C][C](NA )[/C][C](NA )[/C][C](NA )[/C][/ROW]
[ROW][C]Estimates ( 11 )[/C][C]NA[/C][C]NA[/C][C]NA[/C][C]NA[/C][C]NA[/C][C]NA[/C][C]NA[/C][/ROW]
[ROW][C](p-val)[/C][C](NA )[/C][C](NA )[/C][C](NA )[/C][C](NA )[/C][C](NA )[/C][C](NA )[/C][C](NA )[/C][/ROW]
[ROW][C]Estimates ( 12 )[/C][C]NA[/C][C]NA[/C][C]NA[/C][C]NA[/C][C]NA[/C][C]NA[/C][C]NA[/C][/ROW]
[ROW][C](p-val)[/C][C](NA )[/C][C](NA )[/C][C](NA )[/C][C](NA )[/C][C](NA )[/C][C](NA )[/C][C](NA )[/C][/ROW]
[ROW][C]Estimates ( 13 )[/C][C]NA[/C][C]NA[/C][C]NA[/C][C]NA[/C][C]NA[/C][C]NA[/C][C]NA[/C][/ROW]
[ROW][C](p-val)[/C][C](NA )[/C][C](NA )[/C][C](NA )[/C][C](NA )[/C][C](NA )[/C][C](NA )[/C][C](NA )[/C][/ROW]
[/TABLE]
Source: https://freestatistics.org/blog/index.php?pk=69457&T=1

Globally Unique Identifier (entire table): ba.freestatistics.org/blog/index.php?pk=69457&T=1

As an alternative you can also use a QR Code:  

The GUIDs for individual cells are displayed in the table below:

ARIMA Parameter Estimation and Backward Selection
Iterationar1ar2ar3ma1sar1sar2sma1
Estimates ( 1 )0.53390.12910.1345-0.4404-0.8939-0.49440.9947
(p-val)(0.4122 )(0.4943 )(0.6351 )(0.4927 )(0 )(0.0229 )(0.4162 )
Estimates ( 2 )0.7930.11110-0.692-0.8518-0.54041.0046
(p-val)(0.0045 )(0.5286 )(NA )(0.0068 )(0 )(0.0022 )(0.4542 )
Estimates ( 3 )0.934100-0.7691-0.8446-0.56731.0007
(p-val)(0 )(NA )(NA )(0 )(0 )(8e-04 )(0.4113 )
Estimates ( 4 )0.91400-0.7526-0.2611-0.41330
(p-val)(0 )(NA )(NA )(1e-04 )(0.0978 )(0.0245 )(NA )
Estimates ( 5 )0.909300-0.78030-0.31970
(p-val)(0 )(NA )(NA )(0 )(NA )(0.0994 )(NA )
Estimates ( 6 )0.926700-0.7795000
(p-val)(0 )(NA )(NA )(0 )(NA )(NA )(NA )
Estimates ( 7 )NANANANANANANA
(p-val)(NA )(NA )(NA )(NA )(NA )(NA )(NA )
Estimates ( 8 )NANANANANANANA
(p-val)(NA )(NA )(NA )(NA )(NA )(NA )(NA )
Estimates ( 9 )NANANANANANANA
(p-val)(NA )(NA )(NA )(NA )(NA )(NA )(NA )
Estimates ( 10 )NANANANANANANA
(p-val)(NA )(NA )(NA )(NA )(NA )(NA )(NA )
Estimates ( 11 )NANANANANANANA
(p-val)(NA )(NA )(NA )(NA )(NA )(NA )(NA )
Estimates ( 12 )NANANANANANANA
(p-val)(NA )(NA )(NA )(NA )(NA )(NA )(NA )
Estimates ( 13 )NANANANANANANA
(p-val)(NA )(NA )(NA )(NA )(NA )(NA )(NA )


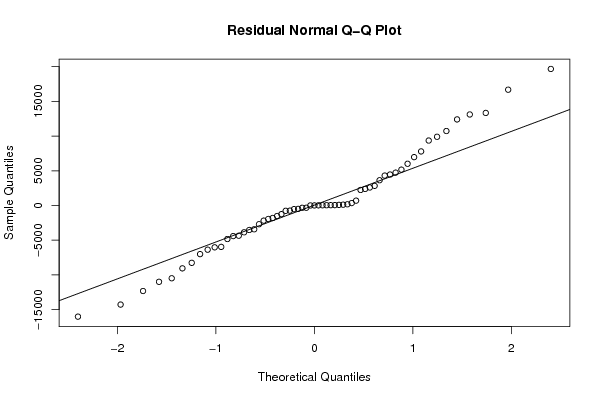
Estimated ARIMA Residuals
Value
-1948.53424348201
-8271.52486860352
-747.904231945972
-12331.8930465592
3633.94114508291
2826.66060052425
2591.71734389293
-498.532853010712
-3869.29396087853
6965.91881268112
4457.23687703582
-1521.07056302695
-4838.90866515136
-1256.84719455505
-4361.63322146661
-14288.7332735515
-2193.52504733670
-7013.30717859536
9898.77108998963
-6377.04922830969
-4413.34781020456
2234.33847647442
-11007.9006908612
-9065.13728082258
13114.8908992021
2378.34880050454
-16028.4417470945
16684.7096114881
6007.69484344387
13334.8717631972
-1806.12922920031
691.81060134699
-528.643579435657
4303.86709960318
-6034.95840745054
19675.4515208568
-10494.3324675339
-5973.52956869903
5159.98235434147
-3433.15103311707
10725.9238382357
4728.90779439813
9354.57486713946
7787.99666786448
12402.4501550291
-2706.39634702263
-774.423230672611
-3537.01882014896
-331.181123460865

\begin{tabular}{lllllllll}
\hline
Estimated ARIMA Residuals \tabularnewline
Value \tabularnewline
-1948.53424348201 \tabularnewline
-8271.52486860352 \tabularnewline
-747.904231945972 \tabularnewline
-12331.8930465592 \tabularnewline
3633.94114508291 \tabularnewline
2826.66060052425 \tabularnewline
2591.71734389293 \tabularnewline
-498.532853010712 \tabularnewline
-3869.29396087853 \tabularnewline
6965.91881268112 \tabularnewline
4457.23687703582 \tabularnewline
-1521.07056302695 \tabularnewline
-4838.90866515136 \tabularnewline
-1256.84719455505 \tabularnewline
-4361.63322146661 \tabularnewline
-14288.7332735515 \tabularnewline
-2193.52504733670 \tabularnewline
-7013.30717859536 \tabularnewline
9898.77108998963 \tabularnewline
-6377.04922830969 \tabularnewline
-4413.34781020456 \tabularnewline
2234.33847647442 \tabularnewline
-11007.9006908612 \tabularnewline
-9065.13728082258 \tabularnewline
13114.8908992021 \tabularnewline
2378.34880050454 \tabularnewline
-16028.4417470945 \tabularnewline
16684.7096114881 \tabularnewline
6007.69484344387 \tabularnewline
13334.8717631972 \tabularnewline
-1806.12922920031 \tabularnewline
691.81060134699 \tabularnewline
-528.643579435657 \tabularnewline
4303.86709960318 \tabularnewline
-6034.95840745054 \tabularnewline
19675.4515208568 \tabularnewline
-10494.3324675339 \tabularnewline
-5973.52956869903 \tabularnewline
5159.98235434147 \tabularnewline
-3433.15103311707 \tabularnewline
10725.9238382357 \tabularnewline
4728.90779439813 \tabularnewline
9354.57486713946 \tabularnewline
7787.99666786448 \tabularnewline
12402.4501550291 \tabularnewline
-2706.39634702263 \tabularnewline
-774.423230672611 \tabularnewline
-3537.01882014896 \tabularnewline
-331.181123460865 \tabularnewline
\hline
\end{tabular}
%Source: https://freestatistics.org/blog/index.php?pk=69457&T=2

[TABLE]
[ROW][C]Estimated ARIMA Residuals[/C][/ROW]
[ROW][C]Value[/C][/ROW]
[ROW][C]-1948.53424348201[/C][/ROW]
[ROW][C]-8271.52486860352[/C][/ROW]
[ROW][C]-747.904231945972[/C][/ROW]
[ROW][C]-12331.8930465592[/C][/ROW]
[ROW][C]3633.94114508291[/C][/ROW]
[ROW][C]2826.66060052425[/C][/ROW]
[ROW][C]2591.71734389293[/C][/ROW]
[ROW][C]-498.532853010712[/C][/ROW]
[ROW][C]-3869.29396087853[/C][/ROW]
[ROW][C]6965.91881268112[/C][/ROW]
[ROW][C]4457.23687703582[/C][/ROW]
[ROW][C]-1521.07056302695[/C][/ROW]
[ROW][C]-4838.90866515136[/C][/ROW]
[ROW][C]-1256.84719455505[/C][/ROW]
[ROW][C]-4361.63322146661[/C][/ROW]
[ROW][C]-14288.7332735515[/C][/ROW]
[ROW][C]-2193.52504733670[/C][/ROW]
[ROW][C]-7013.30717859536[/C][/ROW]
[ROW][C]9898.77108998963[/C][/ROW]
[ROW][C]-6377.04922830969[/C][/ROW]
[ROW][C]-4413.34781020456[/C][/ROW]
[ROW][C]2234.33847647442[/C][/ROW]
[ROW][C]-11007.9006908612[/C][/ROW]
[ROW][C]-9065.13728082258[/C][/ROW]
[ROW][C]13114.8908992021[/C][/ROW]
[ROW][C]2378.34880050454[/C][/ROW]
[ROW][C]-16028.4417470945[/C][/ROW]
[ROW][C]16684.7096114881[/C][/ROW]
[ROW][C]6007.69484344387[/C][/ROW]
[ROW][C]13334.8717631972[/C][/ROW]
[ROW][C]-1806.12922920031[/C][/ROW]
[ROW][C]691.81060134699[/C][/ROW]
[ROW][C]-528.643579435657[/C][/ROW]
[ROW][C]4303.86709960318[/C][/ROW]
[ROW][C]-6034.95840745054[/C][/ROW]
[ROW][C]19675.4515208568[/C][/ROW]
[ROW][C]-10494.3324675339[/C][/ROW]
[ROW][C]-5973.52956869903[/C][/ROW]
[ROW][C]5159.98235434147[/C][/ROW]
[ROW][C]-3433.15103311707[/C][/ROW]
[ROW][C]10725.9238382357[/C][/ROW]
[ROW][C]4728.90779439813[/C][/ROW]
[ROW][C]9354.57486713946[/C][/ROW]
[ROW][C]7787.99666786448[/C][/ROW]
[ROW][C]12402.4501550291[/C][/ROW]
[ROW][C]-2706.39634702263[/C][/ROW]
[ROW][C]-774.423230672611[/C][/ROW]
[ROW][C]-3537.01882014896[/C][/ROW]
[ROW][C]-331.181123460865[/C][/ROW]
[/TABLE]
Source: https://freestatistics.org/blog/index.php?pk=69457&T=2

Globally Unique Identifier (entire table): ba.freestatistics.org/blog/index.php?pk=69457&T=2

As an alternative you can also use a QR Code:  

The GUIDs for individual cells are displayed in the table below:

Estimated ARIMA Residuals
Value
-1948.53424348201
-8271.52486860352
-747.904231945972
-12331.8930465592
3633.94114508291
2826.66060052425
2591.71734389293
-498.532853010712
-3869.29396087853
6965.91881268112
4457.23687703582
-1521.07056302695
-4838.90866515136
-1256.84719455505
-4361.63322146661
-14288.7332735515
-2193.52504733670
-7013.30717859536
9898.77108998963
-6377.04922830969
-4413.34781020456
2234.33847647442
-11007.9006908612
-9065.13728082258
13114.8908992021
2378.34880050454
-16028.4417470945
16684.7096114881
6007.69484344387
13334.8717631972
-1806.12922920031
691.81060134699
-528.643579435657
4303.86709960318
-6034.95840745054
19675.4515208568
-10494.3324675339
-5973.52956869903
5159.98235434147
-3433.15103311707
10725.9238382357
4728.90779439813
9354.57486713946
7787.99666786448
12402.4501550291
-2706.39634702263
-774.423230672611
-3537.01882014896
-331.181123460865


Parameters (Session):
par1 = FALSE ; par2 = 1 ; par3 = 1 ; par4 = 1 ; par5 = 12 ; par6 = 3 ; par7 = 1 ; par8 = 2 ; par9 = 1 ;
Parameters (R input):
par1 = FALSE ; par2 = 1 ; par3 = 1 ; par4 = 1 ; par5 = 12 ; par6 = 3 ; par7 = 1 ; par8 = 2 ; par9 = 1 ;
R code (references can be found in the software module):
library(lattice)
if (par1 == 'TRUE') par1 <- TRUE
if (par1 == 'FALSE') par1 <- FALSE
par2 <- as.numeric(par2) #Box-Cox lambda transformation parameter
par3 <- as.numeric(par3) #degree of non-seasonal differencing
par4 <- as.numeric(par4) #degree of seasonal differencing
par5 <- as.numeric(par5) #seasonal period
par6 <- as.numeric(par6) #degree (p) of the non-seasonal AR(p) polynomial
par7 <- as.numeric(par7) #degree (q) of the non-seasonal MA(q) polynomial
par8 <- as.numeric(par8) #degree (P) of the seasonal AR(P) polynomial
par9 <- as.numeric(par9) #degree (Q) of the seasonal MA(Q) polynomial
armaGR <- function(arima.out, names, n){
try1 <- arima.out$coef
try2 <- sqrt(diag(arima.out$var.coef))
try.data.frame <- data.frame(matrix(NA,ncol=4,nrow=length(names)))
dimnames(try.data.frame) <- list(names,c('coef','std','tstat','pv'))
try.data.frame[,1] <- try1
for(i in 1:length(try2)) try.data.frame[which(rownames(try.data.frame)==names(try2)[i]),2] <- try2[i]
try.data.frame[,3] <- try.data.frame[,1] / try.data.frame[,2]
try.data.frame[,4] <- round((1-pt(abs(try.data.frame[,3]),df=n-(length(try2)+1)))*2,5)
vector <- rep(NA,length(names))
vector[is.na(try.data.frame[,4])] <- 0
maxi <- which.max(try.data.frame[,4])
continue <- max(try.data.frame[,4],na.rm=TRUE) > .05
vector[maxi] <- 0
list(summary=try.data.frame,next.vector=vector,continue=continue)
}
arimaSelect <- function(series, order=c(13,0,0), seasonal=list(order=c(2,0,0),period=12), include.mean=F){
nrc <- order[1]+order[3]+seasonal$order[1]+seasonal$order[3]
coeff <- matrix(NA, nrow=nrc*2, ncol=nrc)
pval <- matrix(NA, nrow=nrc*2, ncol=nrc)
mylist <- rep(list(NULL), nrc)
names <- NULL
if(order[1] > 0) names <- paste('ar',1:order[1],sep='')
if(order[3] > 0) names <- c( names , paste('ma',1:order[3],sep='') )
if(seasonal$order[1] > 0) names <- c(names, paste('sar',1:seasonal$order[1],sep=''))
if(seasonal$order[3] > 0) names <- c(names, paste('sma',1:seasonal$order[3],sep=''))
arima.out <- arima(series, order=order, seasonal=seasonal, include.mean=include.mean, method='ML')
mylist[[1]] <- arima.out
last.arma <- armaGR(arima.out, names, length(series))
mystop <- FALSE
i <- 1
coeff[i,] <- last.arma[[1]][,1]
pval [i,] <- last.arma[[1]][,4]
i <- 2
aic <- arima.out$aic
while(!mystop){
mylist[[i]] <- arima.out
arima.out <- arima(series, order=order, seasonal=seasonal, include.mean=include.mean, method='ML', fixed=last.arma$next.vector)
aic <- c(aic, arima.out$aic)
last.arma <- armaGR(arima.out, names, length(series))
mystop <- !last.arma$continue
coeff[i,] <- last.arma[[1]][,1]
pval [i,] <- last.arma[[1]][,4]
i <- i+1
}
list(coeff, pval, mylist, aic=aic)
}
arimaSelectplot <- function(arimaSelect.out,noms,choix){
noms <- names(arimaSelect.out[[3]][[1]]$coef)
coeff <- arimaSelect.out[[1]]
k <- min(which(is.na(coeff[,1])))-1
coeff <- coeff[1:k,]
pval <- arimaSelect.out[[2]][1:k,]
aic <- arimaSelect.out$aic[1:k]
coeff[coeff==0] <- NA
n <- ncol(coeff)
if(missing(choix)) choix <- k
layout(matrix(c(1,1,1,2,
3,3,3,2,
3,3,3,4,
5,6,7,7),nr=4),
widths=c(10,35,45,15),
heights=c(30,30,15,15))
couleurs <- rainbow(75)[1:50]#(50)
ticks <- pretty(coeff)
par(mar=c(1,1,3,1))
plot(aic,k:1-.5,type='o',pch=21,bg='blue',cex=2,axes=F,lty=2,xpd=NA)
points(aic[choix],k-choix+.5,pch=21,cex=4,bg=2,xpd=NA)
title('aic',line=2)
par(mar=c(3,0,0,0))
plot(0,axes=F,xlab='',ylab='',xlim=range(ticks),ylim=c(.1,1))
rect(xleft = min(ticks) + (0:49)/50*(max(ticks)-min(ticks)),
xright = min(ticks) + (1:50)/50*(max(ticks)-min(ticks)),
ytop = rep(1,50),
ybottom= rep(0,50),col=couleurs,border=NA)
axis(1,ticks)
rect(xleft=min(ticks),xright=max(ticks),ytop=1,ybottom=0)
text(mean(coeff,na.rm=T),.5,'coefficients',cex=2,font=2)
par(mar=c(1,1,3,1))
image(1:n,1:k,t(coeff[k:1,]),axes=F,col=couleurs,zlim=range(ticks))
for(i in 1:n) for(j in 1:k) if(!is.na(coeff[j,i])) {
if(pval[j,i]<.01) symb = 'green'
else if( (pval[j,i]<.05) & (pval[j,i]>=.01)) symb = 'orange'
else if( (pval[j,i]<.1) & (pval[j,i]>=.05)) symb = 'red'
else symb = 'black'
polygon(c(i+.5 ,i+.2 ,i+.5 ,i+.5),
c(k-j+0.5,k-j+0.5,k-j+0.8,k-j+0.5),
col=symb)
if(j==choix) {
rect(xleft=i-.5,
xright=i+.5,
ybottom=k-j+1.5,
ytop=k-j+.5,
lwd=4)
text(i,
k-j+1,
round(coeff[j,i],2),
cex=1.2,
font=2)
}
else{
rect(xleft=i-.5,xright=i+.5,ybottom=k-j+1.5,ytop=k-j+.5)
text(i,k-j+1,round(coeff[j,i],2),cex=1.2,font=1)
}
}
axis(3,1:n,noms)
par(mar=c(0.5,0,0,0.5))
plot(0,axes=F,xlab='',ylab='',type='n',xlim=c(0,8),ylim=c(-.2,.8))
cols <- c('green','orange','red','black')
niv <- c('0','0.01','0.05','0.1')
for(i in 0:3){
polygon(c(1+2*i ,1+2*i ,1+2*i-.5 ,1+2*i),
c(.4 ,.7 , .4 , .4),
col=cols[i+1])
text(2*i,0.5,niv[i+1],cex=1.5)
}
text(8,.5,1,cex=1.5)
text(4,0,'p-value',cex=2)
box()
residus <- arimaSelect.out[[3]][[choix]]$res
par(mar=c(1,2,4,1))
acf(residus,main='')
title('acf',line=.5)
par(mar=c(1,2,4,1))
pacf(residus,main='')
title('pacf',line=.5)
par(mar=c(2,2,4,1))
qqnorm(residus,main='')
title('qq-norm',line=.5)
qqline(residus)
residus
}
if (par2 == 0) x <- log(x)
if (par2 != 0) x <- x^par2
(selection <- arimaSelect(x, order=c(par6,par3,par7), seasonal=list(order=c(par8,par4,par9), period=par5)))
bitmap(file='test1.png')
resid <- arimaSelectplot(selection)
dev.off()
resid
bitmap(file='test2.png')
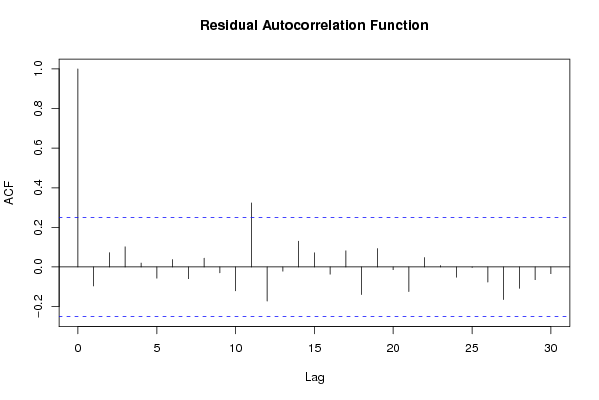
acf(resid,length(resid)/2, main='Residual Autocorrelation Function')
dev.off()
bitmap(file='test3.png')
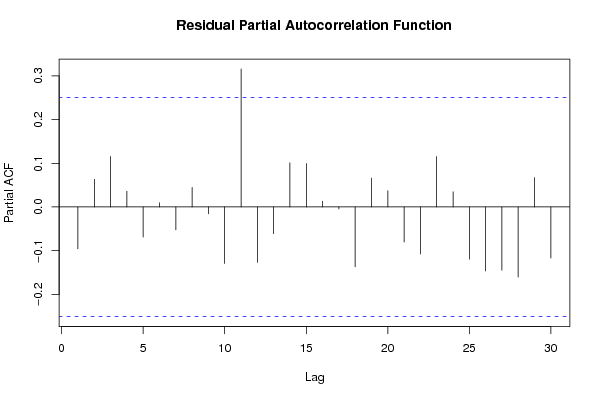
pacf(resid,length(resid)/2, main='Residual Partial Autocorrelation Function')
dev.off()
bitmap(file='test4.png')
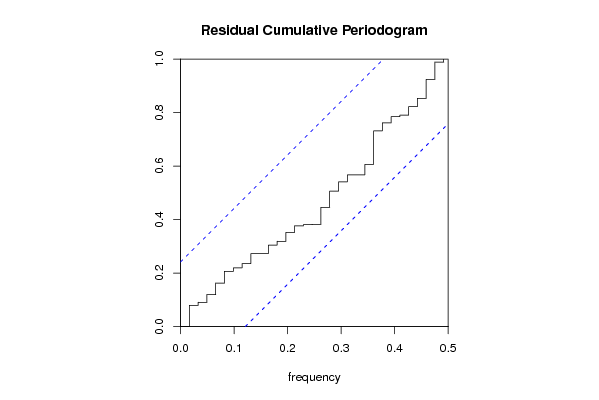
cpgram(resid, main='Residual Cumulative Periodogram')
dev.off()
bitmap(file='test5.png')
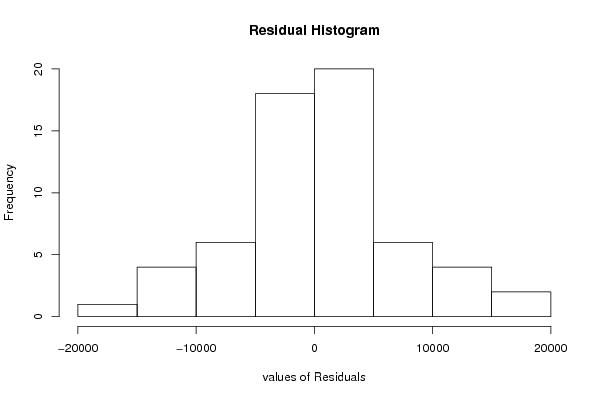
hist(resid, main='Residual Histogram', xlab='values of Residuals')
dev.off()
bitmap(file='test6.png')
densityplot(~resid,col='black',main='Residual Density Plot', xlab='values of Residuals')
dev.off()
bitmap(file='test7.png')
qqnorm(resid, main='Residual Normal Q-Q Plot')
qqline(resid)
dev.off()
ncols <- length(selection[[1]][1,])
nrows <- length(selection[[2]][,1])-1
load(file='createtable')
a<-table.start()
a<-table.row.start(a)
a<-table.element(a,'ARIMA Parameter Estimation and Backward Selection', ncols+1,TRUE)
a<-table.row.end(a)
a<-table.row.start(a)
a<-table.element(a,'Iteration', header=TRUE)
for (i in 1:ncols) {
a<-table.element(a,names(selection[[3]][[1]]$coef)[i],header=TRUE)
}
a<-table.row.end(a)
for (j in 1:nrows) {
a<-table.row.start(a)
mydum <- 'Estimates ('
mydum <- paste(mydum,j)
mydum <- paste(mydum,')')
a<-table.element(a,mydum, header=TRUE)
for (i in 1:ncols) {
a<-table.element(a,round(selection[[1]][j,i],4))
}
a<-table.row.end(a)
a<-table.row.start(a)
a<-table.element(a,'(p-val)', header=TRUE)
for (i in 1:ncols) {
mydum <- '('
mydum <- paste(mydum,round(selection[[2]][j,i],4),sep='')
mydum <- paste(mydum,')')
a<-table.element(a,mydum)
}
a<-table.row.end(a)
}
a<-table.end(a)
table.save(a,file='mytable.tab')
a<-table.start()
a<-table.row.start(a)
a<-table.element(a,'Estimated ARIMA Residuals', 1,TRUE)
a<-table.row.end(a)
a<-table.row.start(a)
a<-table.element(a,'Value', 1,TRUE)
a<-table.row.end(a)
for (i in (par4*par5+par3):length(resid)) {
a<-table.row.start(a)
a<-table.element(a,resid[i])
a<-table.row.end(a)
}
a<-table.end(a)
table.save(a,file='mytable1.tab')