Free Statistics

of Irreproducible Research!

Author's title

Author*The author of this computation has been verified*
R Software Modulerwasp_autocorrelation.wasp
Title produced by software(Partial) Autocorrelation Function
Date of computationSun, 20 Dec 2009 05:18:59 -0700
Cite this page as followsStatistical Computations at FreeStatistics.org, Office for Research Development and Education, URL https://freestatistics.org/blog/index.php?v=date/2009/Dec/20/t126131160826c0rjff2vrbo7n.htm/, Retrieved Sat, 27 Apr 2024 07:56:17 +0000
Statistical Computations at FreeStatistics.org, Office for Research Development and Education, URL https://freestatistics.org/blog/index.php?pk=69853, Retrieved Sat, 27 Apr 2024 07:56:17 +0000
QR Codes:

Original text written by user:
IsPrivate?No (this computation is public)
User-defined keywords
Estimated Impact117
Family? (F = Feedback message, R = changed R code, M = changed R Module, P = changed Parameters, D = changed Data)
-     [Univariate Explorative Data Analysis] [Run Sequence gebo...] [2008-12-12 13:32:37] [76963dc1903f0f612b6153510a3818cf]
- R  D  [Univariate Explorative Data Analysis] [Run Sequence gebo...] [2008-12-17 12:14:40] [76963dc1903f0f612b6153510a3818cf]
-         [Univariate Explorative Data Analysis] [Run Sequence Plot...] [2008-12-22 18:19:51] [1ce0d16c8f4225c977b42c8fa93bc163]
- RMP       [(Partial) Autocorrelation Function] [Identifying Integ...] [2009-11-22 12:16:10] [b98453cac15ba1066b407e146608df68]
-   PD          [(Partial) Autocorrelation Function] [ACF (d=D=0)] [2009-12-20 12:18:59] [fe2edc5b0acc9545190e03904e9be55e] [Current]
Feedback Forum

Post a new message
Dataseries X:
921365
987921
1132614
1332224
1418133
1411549
1695920
1636173
1539653
1395314
1127575
1036076
989236
1008380
1207763
1368839
1469798
1498721
1761769
1653214
1599104
1421179
1163995
1037735
1015407
1039210
1258049
1469445
1552346
1549144
1785895
1662335
1629440
1467430
1202209
1076982
1039367
1063449
1335135
1491602
1591972
1641248
1898849
1798580
1762444
1622044
1368955
1262973
1195650
1269530
1479279
1607819
1712466
1721766
1949843
1821326
1757802
1590367
1260647
1149235


Summary of computational transaction
Raw Inputview raw input (R code)
Raw Outputview raw output of R engine
Computing time1 seconds
R Server'Gwilym Jenkins' @ 72.249.127.135

\begin{tabular}{lllllllll}
\hline
Summary of computational transaction \tabularnewline
Raw Input & view raw input (R code)  \tabularnewline
Raw Output & view raw output of R engine  \tabularnewline
Computing time & 1 seconds \tabularnewline
R Server & 'Gwilym Jenkins' @ 72.249.127.135 \tabularnewline
\hline
\end{tabular}
%Source: https://freestatistics.org/blog/index.php?pk=69853&T=0

[TABLE]
[ROW][C]Summary of computational transaction[/C][/ROW]
[ROW][C]Raw Input[/C][C]view raw input (R code) [/C][/ROW]
[ROW][C]Raw Output[/C][C]view raw output of R engine [/C][/ROW]
[ROW][C]Computing time[/C][C]1 seconds[/C][/ROW]
[ROW][C]R Server[/C][C]'Gwilym Jenkins' @ 72.249.127.135[/C][/ROW]
[/TABLE]
Source: https://freestatistics.org/blog/index.php?pk=69853&T=0

Globally Unique Identifier (entire table): ba.freestatistics.org/blog/index.php?pk=69853&T=0

As an alternative you can also use a QR Code:  

The GUIDs for individual cells are displayed in the table below:

Summary of computational transaction
Raw Inputview raw input (R code)
Raw Outputview raw output of R engine
Computing time1 seconds
R Server'Gwilym Jenkins' @ 72.249.127.135


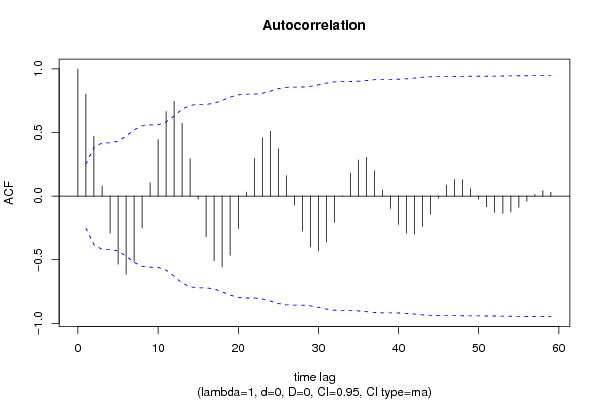
Autocorrelation Function
Time lag kACF(k)T-STATP-value
10.8026136.2170
20.4711653.64960.000276
30.078590.60880.272493
4-0.290623-2.25120.014026
5-0.535233-4.14595.4e-05
6-0.614509-4.766e-06
7-0.51252-3.979.7e-05
8-0.251061-1.94470.028251
90.1047660.81150.21014
100.4449773.44680.000521
110.6653095.15352e-06
120.745265.77280
130.5720524.43112e-05
140.2943892.28030.013078
15-0.023663-0.18330.427594
16-0.319515-2.4750.008084
17-0.508492-3.93880.000108
18-0.557567-4.31893e-05
19-0.465414-3.60510.000318
20-0.254927-1.97470.026457
210.0317230.24570.403367
220.2962652.29490.012627
230.4587463.55340.000374
240.509913.94970.000104
250.3719822.88140.002743
260.1607331.2450.108981
27-0.069772-0.54050.295443
28-0.275695-2.13550.018405
29-0.400444-3.10180.001465
30-0.432586-3.35080.000699
31-0.360289-2.79080.00352
32-0.206805-1.60190.057215
33-0.001397-0.01080.495702
340.181871.40880.082034
350.2847872.2060.015614
360.3052922.36480.010646
370.1987881.53980.064433
380.0476040.36870.35681
39-0.098457-0.76260.224333
40-0.223093-1.72810.04456
41-0.290964-2.25380.013937
42-0.298836-2.31480.012032
43-0.23865-1.84860.034724
44-0.14201-1.10.137862
45-0.017717-0.13720.445654
460.086630.6710.252387
470.1307121.01250.157685
480.127710.98920.163259
490.0581980.45080.32688
50-0.023332-0.18070.428595
51-0.084592-0.65520.257406
52-0.128579-0.9960.161633
53-0.13592-1.05280.148319
54-0.124928-0.96770.168542
55-0.087565-0.67830.250102
56-0.040606-0.31450.377103
570.0124730.09660.461676
580.043290.33530.369277
590.0299290.23180.40873
60NANANA

\begin{tabular}{lllllllll}
\hline
Autocorrelation Function \tabularnewline
Time lag k & ACF(k) & T-STAT & P-value \tabularnewline
1 & 0.802613 & 6.217 & 0 \tabularnewline
2 & 0.471165 & 3.6496 & 0.000276 \tabularnewline
3 & 0.07859 & 0.6088 & 0.272493 \tabularnewline
4 & -0.290623 & -2.2512 & 0.014026 \tabularnewline
5 & -0.535233 & -4.1459 & 5.4e-05 \tabularnewline
6 & -0.614509 & -4.76 & 6e-06 \tabularnewline
7 & -0.51252 & -3.97 & 9.7e-05 \tabularnewline
8 & -0.251061 & -1.9447 & 0.028251 \tabularnewline
9 & 0.104766 & 0.8115 & 0.21014 \tabularnewline
10 & 0.444977 & 3.4468 & 0.000521 \tabularnewline
11 & 0.665309 & 5.1535 & 2e-06 \tabularnewline
12 & 0.74526 & 5.7728 & 0 \tabularnewline
13 & 0.572052 & 4.4311 & 2e-05 \tabularnewline
14 & 0.294389 & 2.2803 & 0.013078 \tabularnewline
15 & -0.023663 & -0.1833 & 0.427594 \tabularnewline
16 & -0.319515 & -2.475 & 0.008084 \tabularnewline
17 & -0.508492 & -3.9388 & 0.000108 \tabularnewline
18 & -0.557567 & -4.3189 & 3e-05 \tabularnewline
19 & -0.465414 & -3.6051 & 0.000318 \tabularnewline
20 & -0.254927 & -1.9747 & 0.026457 \tabularnewline
21 & 0.031723 & 0.2457 & 0.403367 \tabularnewline
22 & 0.296265 & 2.2949 & 0.012627 \tabularnewline
23 & 0.458746 & 3.5534 & 0.000374 \tabularnewline
24 & 0.50991 & 3.9497 & 0.000104 \tabularnewline
25 & 0.371982 & 2.8814 & 0.002743 \tabularnewline
26 & 0.160733 & 1.245 & 0.108981 \tabularnewline
27 & -0.069772 & -0.5405 & 0.295443 \tabularnewline
28 & -0.275695 & -2.1355 & 0.018405 \tabularnewline
29 & -0.400444 & -3.1018 & 0.001465 \tabularnewline
30 & -0.432586 & -3.3508 & 0.000699 \tabularnewline
31 & -0.360289 & -2.7908 & 0.00352 \tabularnewline
32 & -0.206805 & -1.6019 & 0.057215 \tabularnewline
33 & -0.001397 & -0.0108 & 0.495702 \tabularnewline
34 & 0.18187 & 1.4088 & 0.082034 \tabularnewline
35 & 0.284787 & 2.206 & 0.015614 \tabularnewline
36 & 0.305292 & 2.3648 & 0.010646 \tabularnewline
37 & 0.198788 & 1.5398 & 0.064433 \tabularnewline
38 & 0.047604 & 0.3687 & 0.35681 \tabularnewline
39 & -0.098457 & -0.7626 & 0.224333 \tabularnewline
40 & -0.223093 & -1.7281 & 0.04456 \tabularnewline
41 & -0.290964 & -2.2538 & 0.013937 \tabularnewline
42 & -0.298836 & -2.3148 & 0.012032 \tabularnewline
43 & -0.23865 & -1.8486 & 0.034724 \tabularnewline
44 & -0.14201 & -1.1 & 0.137862 \tabularnewline
45 & -0.017717 & -0.1372 & 0.445654 \tabularnewline
46 & 0.08663 & 0.671 & 0.252387 \tabularnewline
47 & 0.130712 & 1.0125 & 0.157685 \tabularnewline
48 & 0.12771 & 0.9892 & 0.163259 \tabularnewline
49 & 0.058198 & 0.4508 & 0.32688 \tabularnewline
50 & -0.023332 & -0.1807 & 0.428595 \tabularnewline
51 & -0.084592 & -0.6552 & 0.257406 \tabularnewline
52 & -0.128579 & -0.996 & 0.161633 \tabularnewline
53 & -0.13592 & -1.0528 & 0.148319 \tabularnewline
54 & -0.124928 & -0.9677 & 0.168542 \tabularnewline
55 & -0.087565 & -0.6783 & 0.250102 \tabularnewline
56 & -0.040606 & -0.3145 & 0.377103 \tabularnewline
57 & 0.012473 & 0.0966 & 0.461676 \tabularnewline
58 & 0.04329 & 0.3353 & 0.369277 \tabularnewline
59 & 0.029929 & 0.2318 & 0.40873 \tabularnewline
60 & NA & NA & NA \tabularnewline
\hline
\end{tabular}
%Source: https://freestatistics.org/blog/index.php?pk=69853&T=1

[TABLE]
[ROW][C]Autocorrelation Function[/C][/ROW]
[ROW][C]Time lag k[/C][C]ACF(k)[/C][C]T-STAT[/C][C]P-value[/C][/ROW]
[ROW][C]1[/C][C]0.802613[/C][C]6.217[/C][C]0[/C][/ROW]
[ROW][C]2[/C][C]0.471165[/C][C]3.6496[/C][C]0.000276[/C][/ROW]
[ROW][C]3[/C][C]0.07859[/C][C]0.6088[/C][C]0.272493[/C][/ROW]
[ROW][C]4[/C][C]-0.290623[/C][C]-2.2512[/C][C]0.014026[/C][/ROW]
[ROW][C]5[/C][C]-0.535233[/C][C]-4.1459[/C][C]5.4e-05[/C][/ROW]
[ROW][C]6[/C][C]-0.614509[/C][C]-4.76[/C][C]6e-06[/C][/ROW]
[ROW][C]7[/C][C]-0.51252[/C][C]-3.97[/C][C]9.7e-05[/C][/ROW]
[ROW][C]8[/C][C]-0.251061[/C][C]-1.9447[/C][C]0.028251[/C][/ROW]
[ROW][C]9[/C][C]0.104766[/C][C]0.8115[/C][C]0.21014[/C][/ROW]
[ROW][C]10[/C][C]0.444977[/C][C]3.4468[/C][C]0.000521[/C][/ROW]
[ROW][C]11[/C][C]0.665309[/C][C]5.1535[/C][C]2e-06[/C][/ROW]
[ROW][C]12[/C][C]0.74526[/C][C]5.7728[/C][C]0[/C][/ROW]
[ROW][C]13[/C][C]0.572052[/C][C]4.4311[/C][C]2e-05[/C][/ROW]
[ROW][C]14[/C][C]0.294389[/C][C]2.2803[/C][C]0.013078[/C][/ROW]
[ROW][C]15[/C][C]-0.023663[/C][C]-0.1833[/C][C]0.427594[/C][/ROW]
[ROW][C]16[/C][C]-0.319515[/C][C]-2.475[/C][C]0.008084[/C][/ROW]
[ROW][C]17[/C][C]-0.508492[/C][C]-3.9388[/C][C]0.000108[/C][/ROW]
[ROW][C]18[/C][C]-0.557567[/C][C]-4.3189[/C][C]3e-05[/C][/ROW]
[ROW][C]19[/C][C]-0.465414[/C][C]-3.6051[/C][C]0.000318[/C][/ROW]
[ROW][C]20[/C][C]-0.254927[/C][C]-1.9747[/C][C]0.026457[/C][/ROW]
[ROW][C]21[/C][C]0.031723[/C][C]0.2457[/C][C]0.403367[/C][/ROW]
[ROW][C]22[/C][C]0.296265[/C][C]2.2949[/C][C]0.012627[/C][/ROW]
[ROW][C]23[/C][C]0.458746[/C][C]3.5534[/C][C]0.000374[/C][/ROW]
[ROW][C]24[/C][C]0.50991[/C][C]3.9497[/C][C]0.000104[/C][/ROW]
[ROW][C]25[/C][C]0.371982[/C][C]2.8814[/C][C]0.002743[/C][/ROW]
[ROW][C]26[/C][C]0.160733[/C][C]1.245[/C][C]0.108981[/C][/ROW]
[ROW][C]27[/C][C]-0.069772[/C][C]-0.5405[/C][C]0.295443[/C][/ROW]
[ROW][C]28[/C][C]-0.275695[/C][C]-2.1355[/C][C]0.018405[/C][/ROW]
[ROW][C]29[/C][C]-0.400444[/C][C]-3.1018[/C][C]0.001465[/C][/ROW]
[ROW][C]30[/C][C]-0.432586[/C][C]-3.3508[/C][C]0.000699[/C][/ROW]
[ROW][C]31[/C][C]-0.360289[/C][C]-2.7908[/C][C]0.00352[/C][/ROW]
[ROW][C]32[/C][C]-0.206805[/C][C]-1.6019[/C][C]0.057215[/C][/ROW]
[ROW][C]33[/C][C]-0.001397[/C][C]-0.0108[/C][C]0.495702[/C][/ROW]
[ROW][C]34[/C][C]0.18187[/C][C]1.4088[/C][C]0.082034[/C][/ROW]
[ROW][C]35[/C][C]0.284787[/C][C]2.206[/C][C]0.015614[/C][/ROW]
[ROW][C]36[/C][C]0.305292[/C][C]2.3648[/C][C]0.010646[/C][/ROW]
[ROW][C]37[/C][C]0.198788[/C][C]1.5398[/C][C]0.064433[/C][/ROW]
[ROW][C]38[/C][C]0.047604[/C][C]0.3687[/C][C]0.35681[/C][/ROW]
[ROW][C]39[/C][C]-0.098457[/C][C]-0.7626[/C][C]0.224333[/C][/ROW]
[ROW][C]40[/C][C]-0.223093[/C][C]-1.7281[/C][C]0.04456[/C][/ROW]
[ROW][C]41[/C][C]-0.290964[/C][C]-2.2538[/C][C]0.013937[/C][/ROW]
[ROW][C]42[/C][C]-0.298836[/C][C]-2.3148[/C][C]0.012032[/C][/ROW]
[ROW][C]43[/C][C]-0.23865[/C][C]-1.8486[/C][C]0.034724[/C][/ROW]
[ROW][C]44[/C][C]-0.14201[/C][C]-1.1[/C][C]0.137862[/C][/ROW]
[ROW][C]45[/C][C]-0.017717[/C][C]-0.1372[/C][C]0.445654[/C][/ROW]
[ROW][C]46[/C][C]0.08663[/C][C]0.671[/C][C]0.252387[/C][/ROW]
[ROW][C]47[/C][C]0.130712[/C][C]1.0125[/C][C]0.157685[/C][/ROW]
[ROW][C]48[/C][C]0.12771[/C][C]0.9892[/C][C]0.163259[/C][/ROW]
[ROW][C]49[/C][C]0.058198[/C][C]0.4508[/C][C]0.32688[/C][/ROW]
[ROW][C]50[/C][C]-0.023332[/C][C]-0.1807[/C][C]0.428595[/C][/ROW]
[ROW][C]51[/C][C]-0.084592[/C][C]-0.6552[/C][C]0.257406[/C][/ROW]
[ROW][C]52[/C][C]-0.128579[/C][C]-0.996[/C][C]0.161633[/C][/ROW]
[ROW][C]53[/C][C]-0.13592[/C][C]-1.0528[/C][C]0.148319[/C][/ROW]
[ROW][C]54[/C][C]-0.124928[/C][C]-0.9677[/C][C]0.168542[/C][/ROW]
[ROW][C]55[/C][C]-0.087565[/C][C]-0.6783[/C][C]0.250102[/C][/ROW]
[ROW][C]56[/C][C]-0.040606[/C][C]-0.3145[/C][C]0.377103[/C][/ROW]
[ROW][C]57[/C][C]0.012473[/C][C]0.0966[/C][C]0.461676[/C][/ROW]
[ROW][C]58[/C][C]0.04329[/C][C]0.3353[/C][C]0.369277[/C][/ROW]
[ROW][C]59[/C][C]0.029929[/C][C]0.2318[/C][C]0.40873[/C][/ROW]
[ROW][C]60[/C][C]NA[/C][C]NA[/C][C]NA[/C][/ROW]
[/TABLE]
Source: https://freestatistics.org/blog/index.php?pk=69853&T=1

Globally Unique Identifier (entire table): ba.freestatistics.org/blog/index.php?pk=69853&T=1

As an alternative you can also use a QR Code:  

The GUIDs for individual cells are displayed in the table below:

Autocorrelation Function
Time lag kACF(k)T-STATP-value
10.8026136.2170
20.4711653.64960.000276
30.078590.60880.272493
4-0.290623-2.25120.014026
5-0.535233-4.14595.4e-05
6-0.614509-4.766e-06
7-0.51252-3.979.7e-05
8-0.251061-1.94470.028251
90.1047660.81150.21014
100.4449773.44680.000521
110.6653095.15352e-06
120.745265.77280
130.5720524.43112e-05
140.2943892.28030.013078
15-0.023663-0.18330.427594
16-0.319515-2.4750.008084
17-0.508492-3.93880.000108
18-0.557567-4.31893e-05
19-0.465414-3.60510.000318
20-0.254927-1.97470.026457
210.0317230.24570.403367
220.2962652.29490.012627
230.4587463.55340.000374
240.509913.94970.000104
250.3719822.88140.002743
260.1607331.2450.108981
27-0.069772-0.54050.295443
28-0.275695-2.13550.018405
29-0.400444-3.10180.001465
30-0.432586-3.35080.000699
31-0.360289-2.79080.00352
32-0.206805-1.60190.057215
33-0.001397-0.01080.495702
340.181871.40880.082034
350.2847872.2060.015614
360.3052922.36480.010646
370.1987881.53980.064433
380.0476040.36870.35681
39-0.098457-0.76260.224333
40-0.223093-1.72810.04456
41-0.290964-2.25380.013937
42-0.298836-2.31480.012032
43-0.23865-1.84860.034724
44-0.14201-1.10.137862
45-0.017717-0.13720.445654
460.086630.6710.252387
470.1307121.01250.157685
480.127710.98920.163259
490.0581980.45080.32688
50-0.023332-0.18070.428595
51-0.084592-0.65520.257406
52-0.128579-0.9960.161633
53-0.13592-1.05280.148319
54-0.124928-0.96770.168542
55-0.087565-0.67830.250102
56-0.040606-0.31450.377103
570.0124730.09660.461676
580.043290.33530.369277
590.0299290.23180.40873
60NANANA


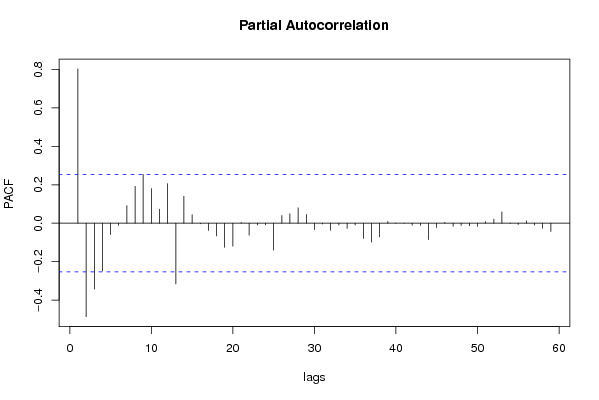
Partial Autocorrelation Function
Time lag kPACF(k)T-STATP-value
10.8026136.2170
2-0.486271-3.76660.00019
3-0.342966-2.65660.005049
4-0.248823-1.92740.029336
5-0.058897-0.45620.324943
6-0.0115-0.08910.464657
70.091420.70810.240801
80.1920441.48760.071051
90.2537351.96540.027
100.1799151.39360.084288
110.0729810.56530.286986
120.2056691.59310.058196
13-0.315823-2.44640.00869
140.1401471.08560.141005
150.0444970.34470.365772
16-0.003473-0.02690.489313
17-0.037954-0.2940.384889
18-0.066425-0.51450.304389
19-0.125317-0.97070.167797
20-0.119614-0.92650.178943
210.0032350.02510.490046
22-0.062257-0.48220.315694
23-0.009249-0.07160.471562
24-0.008426-0.06530.47409
25-0.139931-1.08390.141372
260.0400020.30990.378872
270.0494340.38290.351567
280.0803430.62230.26804
290.0454250.35190.363088
30-0.033364-0.25840.398476
31-0.004646-0.0360.485705
32-0.037339-0.28920.386703
33-0.008876-0.06880.472709
34-0.026453-0.20490.419172
35-0.009814-0.0760.469828
36-0.079488-0.61570.270207
37-0.097873-0.75810.225673
38-0.070804-0.54840.292709
390.0090330.070.472225
400.0016720.01290.494856
41-0.000693-0.00540.497866
42-0.010247-0.07940.468501
43-0.011507-0.08910.464636
44-0.085465-0.6620.255249
45-0.022487-0.17420.431153
460.0041720.03230.487163
47-0.015826-0.12260.451421
48-0.011646-0.09020.464212
49-0.013623-0.10550.458155
50-0.01685-0.13050.448297
510.0082290.06370.474694
520.020890.16180.435998
530.0586070.4540.325744
54-0.001939-0.0150.494032
55-0.00685-0.05310.478931
560.0126060.09760.461269
57-0.009768-0.07570.469971
58-0.026475-0.20510.419103
59-0.043088-0.33380.369862
60NANANA

\begin{tabular}{lllllllll}
\hline
Partial Autocorrelation Function \tabularnewline
Time lag k & PACF(k) & T-STAT & P-value \tabularnewline
1 & 0.802613 & 6.217 & 0 \tabularnewline
2 & -0.486271 & -3.7666 & 0.00019 \tabularnewline
3 & -0.342966 & -2.6566 & 0.005049 \tabularnewline
4 & -0.248823 & -1.9274 & 0.029336 \tabularnewline
5 & -0.058897 & -0.4562 & 0.324943 \tabularnewline
6 & -0.0115 & -0.0891 & 0.464657 \tabularnewline
7 & 0.09142 & 0.7081 & 0.240801 \tabularnewline
8 & 0.192044 & 1.4876 & 0.071051 \tabularnewline
9 & 0.253735 & 1.9654 & 0.027 \tabularnewline
10 & 0.179915 & 1.3936 & 0.084288 \tabularnewline
11 & 0.072981 & 0.5653 & 0.286986 \tabularnewline
12 & 0.205669 & 1.5931 & 0.058196 \tabularnewline
13 & -0.315823 & -2.4464 & 0.00869 \tabularnewline
14 & 0.140147 & 1.0856 & 0.141005 \tabularnewline
15 & 0.044497 & 0.3447 & 0.365772 \tabularnewline
16 & -0.003473 & -0.0269 & 0.489313 \tabularnewline
17 & -0.037954 & -0.294 & 0.384889 \tabularnewline
18 & -0.066425 & -0.5145 & 0.304389 \tabularnewline
19 & -0.125317 & -0.9707 & 0.167797 \tabularnewline
20 & -0.119614 & -0.9265 & 0.178943 \tabularnewline
21 & 0.003235 & 0.0251 & 0.490046 \tabularnewline
22 & -0.062257 & -0.4822 & 0.315694 \tabularnewline
23 & -0.009249 & -0.0716 & 0.471562 \tabularnewline
24 & -0.008426 & -0.0653 & 0.47409 \tabularnewline
25 & -0.139931 & -1.0839 & 0.141372 \tabularnewline
26 & 0.040002 & 0.3099 & 0.378872 \tabularnewline
27 & 0.049434 & 0.3829 & 0.351567 \tabularnewline
28 & 0.080343 & 0.6223 & 0.26804 \tabularnewline
29 & 0.045425 & 0.3519 & 0.363088 \tabularnewline
30 & -0.033364 & -0.2584 & 0.398476 \tabularnewline
31 & -0.004646 & -0.036 & 0.485705 \tabularnewline
32 & -0.037339 & -0.2892 & 0.386703 \tabularnewline
33 & -0.008876 & -0.0688 & 0.472709 \tabularnewline
34 & -0.026453 & -0.2049 & 0.419172 \tabularnewline
35 & -0.009814 & -0.076 & 0.469828 \tabularnewline
36 & -0.079488 & -0.6157 & 0.270207 \tabularnewline
37 & -0.097873 & -0.7581 & 0.225673 \tabularnewline
38 & -0.070804 & -0.5484 & 0.292709 \tabularnewline
39 & 0.009033 & 0.07 & 0.472225 \tabularnewline
40 & 0.001672 & 0.0129 & 0.494856 \tabularnewline
41 & -0.000693 & -0.0054 & 0.497866 \tabularnewline
42 & -0.010247 & -0.0794 & 0.468501 \tabularnewline
43 & -0.011507 & -0.0891 & 0.464636 \tabularnewline
44 & -0.085465 & -0.662 & 0.255249 \tabularnewline
45 & -0.022487 & -0.1742 & 0.431153 \tabularnewline
46 & 0.004172 & 0.0323 & 0.487163 \tabularnewline
47 & -0.015826 & -0.1226 & 0.451421 \tabularnewline
48 & -0.011646 & -0.0902 & 0.464212 \tabularnewline
49 & -0.013623 & -0.1055 & 0.458155 \tabularnewline
50 & -0.01685 & -0.1305 & 0.448297 \tabularnewline
51 & 0.008229 & 0.0637 & 0.474694 \tabularnewline
52 & 0.02089 & 0.1618 & 0.435998 \tabularnewline
53 & 0.058607 & 0.454 & 0.325744 \tabularnewline
54 & -0.001939 & -0.015 & 0.494032 \tabularnewline
55 & -0.00685 & -0.0531 & 0.478931 \tabularnewline
56 & 0.012606 & 0.0976 & 0.461269 \tabularnewline
57 & -0.009768 & -0.0757 & 0.469971 \tabularnewline
58 & -0.026475 & -0.2051 & 0.419103 \tabularnewline
59 & -0.043088 & -0.3338 & 0.369862 \tabularnewline
60 & NA & NA & NA \tabularnewline
\hline
\end{tabular}
%Source: https://freestatistics.org/blog/index.php?pk=69853&T=2

[TABLE]
[ROW][C]Partial Autocorrelation Function[/C][/ROW]
[ROW][C]Time lag k[/C][C]PACF(k)[/C][C]T-STAT[/C][C]P-value[/C][/ROW]
[ROW][C]1[/C][C]0.802613[/C][C]6.217[/C][C]0[/C][/ROW]
[ROW][C]2[/C][C]-0.486271[/C][C]-3.7666[/C][C]0.00019[/C][/ROW]
[ROW][C]3[/C][C]-0.342966[/C][C]-2.6566[/C][C]0.005049[/C][/ROW]
[ROW][C]4[/C][C]-0.248823[/C][C]-1.9274[/C][C]0.029336[/C][/ROW]
[ROW][C]5[/C][C]-0.058897[/C][C]-0.4562[/C][C]0.324943[/C][/ROW]
[ROW][C]6[/C][C]-0.0115[/C][C]-0.0891[/C][C]0.464657[/C][/ROW]
[ROW][C]7[/C][C]0.09142[/C][C]0.7081[/C][C]0.240801[/C][/ROW]
[ROW][C]8[/C][C]0.192044[/C][C]1.4876[/C][C]0.071051[/C][/ROW]
[ROW][C]9[/C][C]0.253735[/C][C]1.9654[/C][C]0.027[/C][/ROW]
[ROW][C]10[/C][C]0.179915[/C][C]1.3936[/C][C]0.084288[/C][/ROW]
[ROW][C]11[/C][C]0.072981[/C][C]0.5653[/C][C]0.286986[/C][/ROW]
[ROW][C]12[/C][C]0.205669[/C][C]1.5931[/C][C]0.058196[/C][/ROW]
[ROW][C]13[/C][C]-0.315823[/C][C]-2.4464[/C][C]0.00869[/C][/ROW]
[ROW][C]14[/C][C]0.140147[/C][C]1.0856[/C][C]0.141005[/C][/ROW]
[ROW][C]15[/C][C]0.044497[/C][C]0.3447[/C][C]0.365772[/C][/ROW]
[ROW][C]16[/C][C]-0.003473[/C][C]-0.0269[/C][C]0.489313[/C][/ROW]
[ROW][C]17[/C][C]-0.037954[/C][C]-0.294[/C][C]0.384889[/C][/ROW]
[ROW][C]18[/C][C]-0.066425[/C][C]-0.5145[/C][C]0.304389[/C][/ROW]
[ROW][C]19[/C][C]-0.125317[/C][C]-0.9707[/C][C]0.167797[/C][/ROW]
[ROW][C]20[/C][C]-0.119614[/C][C]-0.9265[/C][C]0.178943[/C][/ROW]
[ROW][C]21[/C][C]0.003235[/C][C]0.0251[/C][C]0.490046[/C][/ROW]
[ROW][C]22[/C][C]-0.062257[/C][C]-0.4822[/C][C]0.315694[/C][/ROW]
[ROW][C]23[/C][C]-0.009249[/C][C]-0.0716[/C][C]0.471562[/C][/ROW]
[ROW][C]24[/C][C]-0.008426[/C][C]-0.0653[/C][C]0.47409[/C][/ROW]
[ROW][C]25[/C][C]-0.139931[/C][C]-1.0839[/C][C]0.141372[/C][/ROW]
[ROW][C]26[/C][C]0.040002[/C][C]0.3099[/C][C]0.378872[/C][/ROW]
[ROW][C]27[/C][C]0.049434[/C][C]0.3829[/C][C]0.351567[/C][/ROW]
[ROW][C]28[/C][C]0.080343[/C][C]0.6223[/C][C]0.26804[/C][/ROW]
[ROW][C]29[/C][C]0.045425[/C][C]0.3519[/C][C]0.363088[/C][/ROW]
[ROW][C]30[/C][C]-0.033364[/C][C]-0.2584[/C][C]0.398476[/C][/ROW]
[ROW][C]31[/C][C]-0.004646[/C][C]-0.036[/C][C]0.485705[/C][/ROW]
[ROW][C]32[/C][C]-0.037339[/C][C]-0.2892[/C][C]0.386703[/C][/ROW]
[ROW][C]33[/C][C]-0.008876[/C][C]-0.0688[/C][C]0.472709[/C][/ROW]
[ROW][C]34[/C][C]-0.026453[/C][C]-0.2049[/C][C]0.419172[/C][/ROW]
[ROW][C]35[/C][C]-0.009814[/C][C]-0.076[/C][C]0.469828[/C][/ROW]
[ROW][C]36[/C][C]-0.079488[/C][C]-0.6157[/C][C]0.270207[/C][/ROW]
[ROW][C]37[/C][C]-0.097873[/C][C]-0.7581[/C][C]0.225673[/C][/ROW]
[ROW][C]38[/C][C]-0.070804[/C][C]-0.5484[/C][C]0.292709[/C][/ROW]
[ROW][C]39[/C][C]0.009033[/C][C]0.07[/C][C]0.472225[/C][/ROW]
[ROW][C]40[/C][C]0.001672[/C][C]0.0129[/C][C]0.494856[/C][/ROW]
[ROW][C]41[/C][C]-0.000693[/C][C]-0.0054[/C][C]0.497866[/C][/ROW]
[ROW][C]42[/C][C]-0.010247[/C][C]-0.0794[/C][C]0.468501[/C][/ROW]
[ROW][C]43[/C][C]-0.011507[/C][C]-0.0891[/C][C]0.464636[/C][/ROW]
[ROW][C]44[/C][C]-0.085465[/C][C]-0.662[/C][C]0.255249[/C][/ROW]
[ROW][C]45[/C][C]-0.022487[/C][C]-0.1742[/C][C]0.431153[/C][/ROW]
[ROW][C]46[/C][C]0.004172[/C][C]0.0323[/C][C]0.487163[/C][/ROW]
[ROW][C]47[/C][C]-0.015826[/C][C]-0.1226[/C][C]0.451421[/C][/ROW]
[ROW][C]48[/C][C]-0.011646[/C][C]-0.0902[/C][C]0.464212[/C][/ROW]
[ROW][C]49[/C][C]-0.013623[/C][C]-0.1055[/C][C]0.458155[/C][/ROW]
[ROW][C]50[/C][C]-0.01685[/C][C]-0.1305[/C][C]0.448297[/C][/ROW]
[ROW][C]51[/C][C]0.008229[/C][C]0.0637[/C][C]0.474694[/C][/ROW]
[ROW][C]52[/C][C]0.02089[/C][C]0.1618[/C][C]0.435998[/C][/ROW]
[ROW][C]53[/C][C]0.058607[/C][C]0.454[/C][C]0.325744[/C][/ROW]
[ROW][C]54[/C][C]-0.001939[/C][C]-0.015[/C][C]0.494032[/C][/ROW]
[ROW][C]55[/C][C]-0.00685[/C][C]-0.0531[/C][C]0.478931[/C][/ROW]
[ROW][C]56[/C][C]0.012606[/C][C]0.0976[/C][C]0.461269[/C][/ROW]
[ROW][C]57[/C][C]-0.009768[/C][C]-0.0757[/C][C]0.469971[/C][/ROW]
[ROW][C]58[/C][C]-0.026475[/C][C]-0.2051[/C][C]0.419103[/C][/ROW]
[ROW][C]59[/C][C]-0.043088[/C][C]-0.3338[/C][C]0.369862[/C][/ROW]
[ROW][C]60[/C][C]NA[/C][C]NA[/C][C]NA[/C][/ROW]
[/TABLE]
Source: https://freestatistics.org/blog/index.php?pk=69853&T=2

Globally Unique Identifier (entire table): ba.freestatistics.org/blog/index.php?pk=69853&T=2

As an alternative you can also use a QR Code:  

The GUIDs for individual cells are displayed in the table below:

Partial Autocorrelation Function
Time lag kPACF(k)T-STATP-value
10.8026136.2170
2-0.486271-3.76660.00019
3-0.342966-2.65660.005049
4-0.248823-1.92740.029336
5-0.058897-0.45620.324943
6-0.0115-0.08910.464657
70.091420.70810.240801
80.1920441.48760.071051
90.2537351.96540.027
100.1799151.39360.084288
110.0729810.56530.286986
120.2056691.59310.058196
13-0.315823-2.44640.00869
140.1401471.08560.141005
150.0444970.34470.365772
16-0.003473-0.02690.489313
17-0.037954-0.2940.384889
18-0.066425-0.51450.304389
19-0.125317-0.97070.167797
20-0.119614-0.92650.178943
210.0032350.02510.490046
22-0.062257-0.48220.315694
23-0.009249-0.07160.471562
24-0.008426-0.06530.47409
25-0.139931-1.08390.141372
260.0400020.30990.378872
270.0494340.38290.351567
280.0803430.62230.26804
290.0454250.35190.363088
30-0.033364-0.25840.398476
31-0.004646-0.0360.485705
32-0.037339-0.28920.386703
33-0.008876-0.06880.472709
34-0.026453-0.20490.419172
35-0.009814-0.0760.469828
36-0.079488-0.61570.270207
37-0.097873-0.75810.225673
38-0.070804-0.54840.292709
390.0090330.070.472225
400.0016720.01290.494856
41-0.000693-0.00540.497866
42-0.010247-0.07940.468501
43-0.011507-0.08910.464636
44-0.085465-0.6620.255249
45-0.022487-0.17420.431153
460.0041720.03230.487163
47-0.015826-0.12260.451421
48-0.011646-0.09020.464212
49-0.013623-0.10550.458155
50-0.01685-0.13050.448297
510.0082290.06370.474694
520.020890.16180.435998
530.0586070.4540.325744
54-0.001939-0.0150.494032
55-0.00685-0.05310.478931
560.0126060.09760.461269
57-0.009768-0.07570.469971
58-0.026475-0.20510.419103
59-0.043088-0.33380.369862
60NANANA


Parameters (Session):
par1 = 60 ; par2 = 1 ; par3 = 0 ; par4 = 0 ; par5 = 12 ; par6 = MA ; par7 = 0.95 ;
Parameters (R input):
par1 = 60 ; par2 = 1 ; par3 = 0 ; par4 = 0 ; par5 = 12 ; par6 = MA ; par7 = 0.95 ;
R code (references can be found in the software module):
if (par1 == 'Default') {
par1 = 10*log10(length(x))
} else {
par1 <- as.numeric(par1)
}
par2 <- as.numeric(par2)
par3 <- as.numeric(par3)
par4 <- as.numeric(par4)
par5 <- as.numeric(par5)
if (par6 == 'White Noise') par6 <- 'white' else par6 <- 'ma'
par7 <- as.numeric(par7)
if (par2 == 0) {
x <- log(x)
} else {
x <- (x ^ par2 - 1) / par2
}
if (par3 > 0) x <- diff(x,lag=1,difference=par3)
if (par4 > 0) x <- diff(x,lag=par5,difference=par4)
bitmap(file='pic1.png')
racf <- acf(x, par1, main='Autocorrelation', xlab='time lag', ylab='ACF', ci.type=par6, ci=par7, sub=paste('(lambda=',par2,', d=',par3,', D=',par4,', CI=', par7, ', CI type=',par6,')',sep=''))
dev.off()
bitmap(file='pic2.png')
rpacf <- pacf(x,par1,main='Partial Autocorrelation',xlab='lags',ylab='PACF')
dev.off()
(myacf <- c(racf$acf))
(mypacf <- c(rpacf$acf))
lengthx <- length(x)
sqrtn <- sqrt(lengthx)
load(file='createtable')
a<-table.start()
a<-table.row.start(a)
a<-table.element(a,'Autocorrelation Function',4,TRUE)
a<-table.row.end(a)
a<-table.row.start(a)
a<-table.element(a,'Time lag k',header=TRUE)
a<-table.element(a,hyperlink('basics.htm','ACF(k)','click here for more information about the Autocorrelation Function'),header=TRUE)
a<-table.element(a,'T-STAT',header=TRUE)
a<-table.element(a,'P-value',header=TRUE)
a<-table.row.end(a)
for (i in 2:(par1+1)) {
a<-table.row.start(a)
a<-table.element(a,i-1,header=TRUE)
a<-table.element(a,round(myacf[i],6))
mytstat <- myacf[i]*sqrtn
a<-table.element(a,round(mytstat,4))
a<-table.element(a,round(1-pt(abs(mytstat),lengthx),6))
a<-table.row.end(a)
}
a<-table.end(a)
table.save(a,file='mytable.tab')
a<-table.start()
a<-table.row.start(a)
a<-table.element(a,'Partial Autocorrelation Function',4,TRUE)
a<-table.row.end(a)
a<-table.row.start(a)
a<-table.element(a,'Time lag k',header=TRUE)
a<-table.element(a,hyperlink('basics.htm','PACF(k)','click here for more information about the Partial Autocorrelation Function'),header=TRUE)
a<-table.element(a,'T-STAT',header=TRUE)
a<-table.element(a,'P-value',header=TRUE)
a<-table.row.end(a)
for (i in 1:par1) {
a<-table.row.start(a)
a<-table.element(a,i,header=TRUE)
a<-table.element(a,round(mypacf[i],6))
mytstat <- mypacf[i]*sqrtn
a<-table.element(a,round(mytstat,4))
a<-table.element(a,round(1-pt(abs(mytstat),lengthx),6))
a<-table.row.end(a)
}
a<-table.end(a)
table.save(a,file='mytable1.tab')