Free Statistics

of Irreproducible Research!

Author's title

Author*The author of this computation has been verified*
R Software Modulerwasp_autocorrelation.wasp
Title produced by software(Partial) Autocorrelation Function
Date of computationSun, 20 Dec 2009 05:21:02 -0700
Cite this page as followsStatistical Computations at FreeStatistics.org, Office for Research Development and Education, URL https://freestatistics.org/blog/index.php?v=date/2009/Dec/20/t1261311758kg8zp4tho438a44.htm/, Retrieved Sat, 27 Apr 2024 05:37:37 +0000
Statistical Computations at FreeStatistics.org, Office for Research Development and Education, URL https://freestatistics.org/blog/index.php?pk=69855, Retrieved Sat, 27 Apr 2024 05:37:37 +0000
QR Codes:

Original text written by user:
IsPrivate?No (this computation is public)
User-defined keywords
Estimated Impact104
Family? (F = Feedback message, R = changed R code, M = changed R Module, P = changed Parameters, D = changed Data)
-     [Univariate Explorative Data Analysis] [Run Sequence gebo...] [2008-12-12 13:32:37] [76963dc1903f0f612b6153510a3818cf]
- R  D  [Univariate Explorative Data Analysis] [Run Sequence gebo...] [2008-12-17 12:14:40] [76963dc1903f0f612b6153510a3818cf]
-         [Univariate Explorative Data Analysis] [Run Sequence Plot...] [2008-12-22 18:19:51] [1ce0d16c8f4225c977b42c8fa93bc163]
- RMP       [(Partial) Autocorrelation Function] [Identifying Integ...] [2009-11-22 12:16:10] [b98453cac15ba1066b407e146608df68]
-   PD          [(Partial) Autocorrelation Function] [ACF (d=D=1)] [2009-12-20 12:21:02] [fe2edc5b0acc9545190e03904e9be55e] [Current]
Feedback Forum

Post a new message
Dataseries X:
921365
987921
1132614
1332224
1418133
1411549
1695920
1636173
1539653
1395314
1127575
1036076
989236
1008380
1207763
1368839
1469798
1498721
1761769
1653214
1599104
1421179
1163995
1037735
1015407
1039210
1258049
1469445
1552346
1549144
1785895
1662335
1629440
1467430
1202209
1076982
1039367
1063449
1335135
1491602
1591972
1641248
1898849
1798580
1762444
1622044
1368955
1262973
1195650
1269530
1479279
1607819
1712466
1721766
1949843
1821326
1757802
1590367
1260647
1149235


Summary of computational transaction
Raw Inputview raw input (R code)
Raw Outputview raw output of R engine
Computing time1 seconds
R Server'Gwilym Jenkins' @ 72.249.127.135

\begin{tabular}{lllllllll}
\hline
Summary of computational transaction \tabularnewline
Raw Input & view raw input (R code)  \tabularnewline
Raw Output & view raw output of R engine  \tabularnewline
Computing time & 1 seconds \tabularnewline
R Server & 'Gwilym Jenkins' @ 72.249.127.135 \tabularnewline
\hline
\end{tabular}
%Source: https://freestatistics.org/blog/index.php?pk=69855&T=0

[TABLE]
[ROW][C]Summary of computational transaction[/C][/ROW]
[ROW][C]Raw Input[/C][C]view raw input (R code) [/C][/ROW]
[ROW][C]Raw Output[/C][C]view raw output of R engine [/C][/ROW]
[ROW][C]Computing time[/C][C]1 seconds[/C][/ROW]
[ROW][C]R Server[/C][C]'Gwilym Jenkins' @ 72.249.127.135[/C][/ROW]
[/TABLE]
Source: https://freestatistics.org/blog/index.php?pk=69855&T=0

Globally Unique Identifier (entire table): ba.freestatistics.org/blog/index.php?pk=69855&T=0

As an alternative you can also use a QR Code:  

The GUIDs for individual cells are displayed in the table below:

Summary of computational transaction
Raw Inputview raw input (R code)
Raw Outputview raw output of R engine
Computing time1 seconds
R Server'Gwilym Jenkins' @ 72.249.127.135


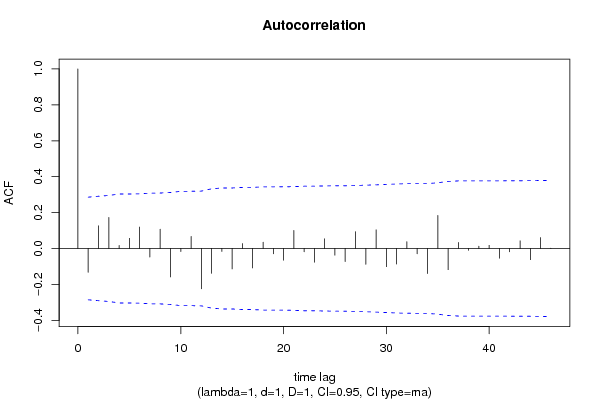
Autocorrelation Function
Time lag kACF(k)T-STATP-value
1-0.132946-0.91140.183359
20.1265560.86760.195004
30.1728381.18490.121004
40.0170720.1170.453664
50.0564880.38730.350156
60.1195230.81940.208345
7-0.047874-0.32820.372107
80.1073070.73570.232796
9-0.158913-1.08950.140755
10-0.01728-0.11850.453101
110.0668540.45830.324415
12-0.224802-1.54120.064992
13-0.138311-0.94820.173935
14-0.016554-0.11350.455064
15-0.113916-0.7810.219368
160.0270780.18560.426763
17-0.10876-0.74560.229805
180.0351850.24120.405218
19-0.029505-0.20230.420287
20-0.065018-0.44570.328916
210.1007520.69070.246569
22-0.018597-0.12750.449547
23-0.076755-0.52620.300609
240.0537360.36840.357115
25-0.037078-0.25420.400227
26-0.072968-0.50020.309619
270.0933230.63980.262707
28-0.088298-0.60530.273932
290.1042670.71480.239128
30-0.101771-0.69770.2444
31-0.087127-0.59730.276583
320.0379640.26030.397898
33-0.029711-0.20370.419739
34-0.13969-0.95770.171566
350.1841291.26230.10653
36-0.118439-0.8120.210449
370.0333140.22840.410167
38-0.010559-0.07240.471301
390.0124920.08560.466057
400.0176670.12110.452056
41-0.054441-0.37320.355329
42-0.018671-0.1280.449348
430.042460.29110.386131
44-0.062828-0.43070.334317
450.0604650.41450.340188
460.001340.00920.496355
47NANANA
48NANANA
49NANANA
50NANANA
51NANANA
52NANANA
53NANANA
54NANANA
55NANANA
56NANANA
57NANANA
58NANANA
59NANANA
60NANANA

\begin{tabular}{lllllllll}
\hline
Autocorrelation Function \tabularnewline
Time lag k & ACF(k) & T-STAT & P-value \tabularnewline
1 & -0.132946 & -0.9114 & 0.183359 \tabularnewline
2 & 0.126556 & 0.8676 & 0.195004 \tabularnewline
3 & 0.172838 & 1.1849 & 0.121004 \tabularnewline
4 & 0.017072 & 0.117 & 0.453664 \tabularnewline
5 & 0.056488 & 0.3873 & 0.350156 \tabularnewline
6 & 0.119523 & 0.8194 & 0.208345 \tabularnewline
7 & -0.047874 & -0.3282 & 0.372107 \tabularnewline
8 & 0.107307 & 0.7357 & 0.232796 \tabularnewline
9 & -0.158913 & -1.0895 & 0.140755 \tabularnewline
10 & -0.01728 & -0.1185 & 0.453101 \tabularnewline
11 & 0.066854 & 0.4583 & 0.324415 \tabularnewline
12 & -0.224802 & -1.5412 & 0.064992 \tabularnewline
13 & -0.138311 & -0.9482 & 0.173935 \tabularnewline
14 & -0.016554 & -0.1135 & 0.455064 \tabularnewline
15 & -0.113916 & -0.781 & 0.219368 \tabularnewline
16 & 0.027078 & 0.1856 & 0.426763 \tabularnewline
17 & -0.10876 & -0.7456 & 0.229805 \tabularnewline
18 & 0.035185 & 0.2412 & 0.405218 \tabularnewline
19 & -0.029505 & -0.2023 & 0.420287 \tabularnewline
20 & -0.065018 & -0.4457 & 0.328916 \tabularnewline
21 & 0.100752 & 0.6907 & 0.246569 \tabularnewline
22 & -0.018597 & -0.1275 & 0.449547 \tabularnewline
23 & -0.076755 & -0.5262 & 0.300609 \tabularnewline
24 & 0.053736 & 0.3684 & 0.357115 \tabularnewline
25 & -0.037078 & -0.2542 & 0.400227 \tabularnewline
26 & -0.072968 & -0.5002 & 0.309619 \tabularnewline
27 & 0.093323 & 0.6398 & 0.262707 \tabularnewline
28 & -0.088298 & -0.6053 & 0.273932 \tabularnewline
29 & 0.104267 & 0.7148 & 0.239128 \tabularnewline
30 & -0.101771 & -0.6977 & 0.2444 \tabularnewline
31 & -0.087127 & -0.5973 & 0.276583 \tabularnewline
32 & 0.037964 & 0.2603 & 0.397898 \tabularnewline
33 & -0.029711 & -0.2037 & 0.419739 \tabularnewline
34 & -0.13969 & -0.9577 & 0.171566 \tabularnewline
35 & 0.184129 & 1.2623 & 0.10653 \tabularnewline
36 & -0.118439 & -0.812 & 0.210449 \tabularnewline
37 & 0.033314 & 0.2284 & 0.410167 \tabularnewline
38 & -0.010559 & -0.0724 & 0.471301 \tabularnewline
39 & 0.012492 & 0.0856 & 0.466057 \tabularnewline
40 & 0.017667 & 0.1211 & 0.452056 \tabularnewline
41 & -0.054441 & -0.3732 & 0.355329 \tabularnewline
42 & -0.018671 & -0.128 & 0.449348 \tabularnewline
43 & 0.04246 & 0.2911 & 0.386131 \tabularnewline
44 & -0.062828 & -0.4307 & 0.334317 \tabularnewline
45 & 0.060465 & 0.4145 & 0.340188 \tabularnewline
46 & 0.00134 & 0.0092 & 0.496355 \tabularnewline
47 & NA & NA & NA \tabularnewline
48 & NA & NA & NA \tabularnewline
49 & NA & NA & NA \tabularnewline
50 & NA & NA & NA \tabularnewline
51 & NA & NA & NA \tabularnewline
52 & NA & NA & NA \tabularnewline
53 & NA & NA & NA \tabularnewline
54 & NA & NA & NA \tabularnewline
55 & NA & NA & NA \tabularnewline
56 & NA & NA & NA \tabularnewline
57 & NA & NA & NA \tabularnewline
58 & NA & NA & NA \tabularnewline
59 & NA & NA & NA \tabularnewline
60 & NA & NA & NA \tabularnewline
\hline
\end{tabular}
%Source: https://freestatistics.org/blog/index.php?pk=69855&T=1

[TABLE]
[ROW][C]Autocorrelation Function[/C][/ROW]
[ROW][C]Time lag k[/C][C]ACF(k)[/C][C]T-STAT[/C][C]P-value[/C][/ROW]
[ROW][C]1[/C][C]-0.132946[/C][C]-0.9114[/C][C]0.183359[/C][/ROW]
[ROW][C]2[/C][C]0.126556[/C][C]0.8676[/C][C]0.195004[/C][/ROW]
[ROW][C]3[/C][C]0.172838[/C][C]1.1849[/C][C]0.121004[/C][/ROW]
[ROW][C]4[/C][C]0.017072[/C][C]0.117[/C][C]0.453664[/C][/ROW]
[ROW][C]5[/C][C]0.056488[/C][C]0.3873[/C][C]0.350156[/C][/ROW]
[ROW][C]6[/C][C]0.119523[/C][C]0.8194[/C][C]0.208345[/C][/ROW]
[ROW][C]7[/C][C]-0.047874[/C][C]-0.3282[/C][C]0.372107[/C][/ROW]
[ROW][C]8[/C][C]0.107307[/C][C]0.7357[/C][C]0.232796[/C][/ROW]
[ROW][C]9[/C][C]-0.158913[/C][C]-1.0895[/C][C]0.140755[/C][/ROW]
[ROW][C]10[/C][C]-0.01728[/C][C]-0.1185[/C][C]0.453101[/C][/ROW]
[ROW][C]11[/C][C]0.066854[/C][C]0.4583[/C][C]0.324415[/C][/ROW]
[ROW][C]12[/C][C]-0.224802[/C][C]-1.5412[/C][C]0.064992[/C][/ROW]
[ROW][C]13[/C][C]-0.138311[/C][C]-0.9482[/C][C]0.173935[/C][/ROW]
[ROW][C]14[/C][C]-0.016554[/C][C]-0.1135[/C][C]0.455064[/C][/ROW]
[ROW][C]15[/C][C]-0.113916[/C][C]-0.781[/C][C]0.219368[/C][/ROW]
[ROW][C]16[/C][C]0.027078[/C][C]0.1856[/C][C]0.426763[/C][/ROW]
[ROW][C]17[/C][C]-0.10876[/C][C]-0.7456[/C][C]0.229805[/C][/ROW]
[ROW][C]18[/C][C]0.035185[/C][C]0.2412[/C][C]0.405218[/C][/ROW]
[ROW][C]19[/C][C]-0.029505[/C][C]-0.2023[/C][C]0.420287[/C][/ROW]
[ROW][C]20[/C][C]-0.065018[/C][C]-0.4457[/C][C]0.328916[/C][/ROW]
[ROW][C]21[/C][C]0.100752[/C][C]0.6907[/C][C]0.246569[/C][/ROW]
[ROW][C]22[/C][C]-0.018597[/C][C]-0.1275[/C][C]0.449547[/C][/ROW]
[ROW][C]23[/C][C]-0.076755[/C][C]-0.5262[/C][C]0.300609[/C][/ROW]
[ROW][C]24[/C][C]0.053736[/C][C]0.3684[/C][C]0.357115[/C][/ROW]
[ROW][C]25[/C][C]-0.037078[/C][C]-0.2542[/C][C]0.400227[/C][/ROW]
[ROW][C]26[/C][C]-0.072968[/C][C]-0.5002[/C][C]0.309619[/C][/ROW]
[ROW][C]27[/C][C]0.093323[/C][C]0.6398[/C][C]0.262707[/C][/ROW]
[ROW][C]28[/C][C]-0.088298[/C][C]-0.6053[/C][C]0.273932[/C][/ROW]
[ROW][C]29[/C][C]0.104267[/C][C]0.7148[/C][C]0.239128[/C][/ROW]
[ROW][C]30[/C][C]-0.101771[/C][C]-0.6977[/C][C]0.2444[/C][/ROW]
[ROW][C]31[/C][C]-0.087127[/C][C]-0.5973[/C][C]0.276583[/C][/ROW]
[ROW][C]32[/C][C]0.037964[/C][C]0.2603[/C][C]0.397898[/C][/ROW]
[ROW][C]33[/C][C]-0.029711[/C][C]-0.2037[/C][C]0.419739[/C][/ROW]
[ROW][C]34[/C][C]-0.13969[/C][C]-0.9577[/C][C]0.171566[/C][/ROW]
[ROW][C]35[/C][C]0.184129[/C][C]1.2623[/C][C]0.10653[/C][/ROW]
[ROW][C]36[/C][C]-0.118439[/C][C]-0.812[/C][C]0.210449[/C][/ROW]
[ROW][C]37[/C][C]0.033314[/C][C]0.2284[/C][C]0.410167[/C][/ROW]
[ROW][C]38[/C][C]-0.010559[/C][C]-0.0724[/C][C]0.471301[/C][/ROW]
[ROW][C]39[/C][C]0.012492[/C][C]0.0856[/C][C]0.466057[/C][/ROW]
[ROW][C]40[/C][C]0.017667[/C][C]0.1211[/C][C]0.452056[/C][/ROW]
[ROW][C]41[/C][C]-0.054441[/C][C]-0.3732[/C][C]0.355329[/C][/ROW]
[ROW][C]42[/C][C]-0.018671[/C][C]-0.128[/C][C]0.449348[/C][/ROW]
[ROW][C]43[/C][C]0.04246[/C][C]0.2911[/C][C]0.386131[/C][/ROW]
[ROW][C]44[/C][C]-0.062828[/C][C]-0.4307[/C][C]0.334317[/C][/ROW]
[ROW][C]45[/C][C]0.060465[/C][C]0.4145[/C][C]0.340188[/C][/ROW]
[ROW][C]46[/C][C]0.00134[/C][C]0.0092[/C][C]0.496355[/C][/ROW]
[ROW][C]47[/C][C]NA[/C][C]NA[/C][C]NA[/C][/ROW]
[ROW][C]48[/C][C]NA[/C][C]NA[/C][C]NA[/C][/ROW]
[ROW][C]49[/C][C]NA[/C][C]NA[/C][C]NA[/C][/ROW]
[ROW][C]50[/C][C]NA[/C][C]NA[/C][C]NA[/C][/ROW]
[ROW][C]51[/C][C]NA[/C][C]NA[/C][C]NA[/C][/ROW]
[ROW][C]52[/C][C]NA[/C][C]NA[/C][C]NA[/C][/ROW]
[ROW][C]53[/C][C]NA[/C][C]NA[/C][C]NA[/C][/ROW]
[ROW][C]54[/C][C]NA[/C][C]NA[/C][C]NA[/C][/ROW]
[ROW][C]55[/C][C]NA[/C][C]NA[/C][C]NA[/C][/ROW]
[ROW][C]56[/C][C]NA[/C][C]NA[/C][C]NA[/C][/ROW]
[ROW][C]57[/C][C]NA[/C][C]NA[/C][C]NA[/C][/ROW]
[ROW][C]58[/C][C]NA[/C][C]NA[/C][C]NA[/C][/ROW]
[ROW][C]59[/C][C]NA[/C][C]NA[/C][C]NA[/C][/ROW]
[ROW][C]60[/C][C]NA[/C][C]NA[/C][C]NA[/C][/ROW]
[/TABLE]
Source: https://freestatistics.org/blog/index.php?pk=69855&T=1

Globally Unique Identifier (entire table): ba.freestatistics.org/blog/index.php?pk=69855&T=1

As an alternative you can also use a QR Code:  

The GUIDs for individual cells are displayed in the table below:

Autocorrelation Function
Time lag kACF(k)T-STATP-value
1-0.132946-0.91140.183359
20.1265560.86760.195004
30.1728381.18490.121004
40.0170720.1170.453664
50.0564880.38730.350156
60.1195230.81940.208345
7-0.047874-0.32820.372107
80.1073070.73570.232796
9-0.158913-1.08950.140755
10-0.01728-0.11850.453101
110.0668540.45830.324415
12-0.224802-1.54120.064992
13-0.138311-0.94820.173935
14-0.016554-0.11350.455064
15-0.113916-0.7810.219368
160.0270780.18560.426763
17-0.10876-0.74560.229805
180.0351850.24120.405218
19-0.029505-0.20230.420287
20-0.065018-0.44570.328916
210.1007520.69070.246569
22-0.018597-0.12750.449547
23-0.076755-0.52620.300609
240.0537360.36840.357115
25-0.037078-0.25420.400227
26-0.072968-0.50020.309619
270.0933230.63980.262707
28-0.088298-0.60530.273932
290.1042670.71480.239128
30-0.101771-0.69770.2444
31-0.087127-0.59730.276583
320.0379640.26030.397898
33-0.029711-0.20370.419739
34-0.13969-0.95770.171566
350.1841291.26230.10653
36-0.118439-0.8120.210449
370.0333140.22840.410167
38-0.010559-0.07240.471301
390.0124920.08560.466057
400.0176670.12110.452056
41-0.054441-0.37320.355329
42-0.018671-0.1280.449348
430.042460.29110.386131
44-0.062828-0.43070.334317
450.0604650.41450.340188
460.001340.00920.496355
47NANANA
48NANANA
49NANANA
50NANANA
51NANANA
52NANANA
53NANANA
54NANANA
55NANANA
56NANANA
57NANANA
58NANANA
59NANANA
60NANANA


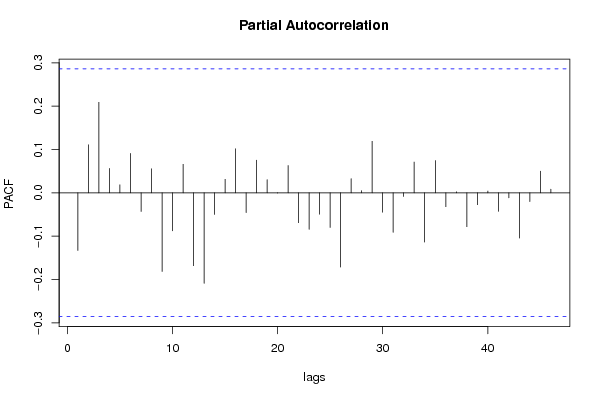
Partial Autocorrelation Function
Time lag kPACF(k)T-STATP-value
1-0.132946-0.91140.183359
20.1108410.75990.225559
30.2087431.43110.079513
40.0561470.38490.351015
50.0184160.12630.450034
60.0908960.62310.268099
7-0.043117-0.29560.384421
80.0554370.38010.352808
9-0.181602-1.2450.109652
10-0.08766-0.6010.275374
110.0659120.45190.326722
12-0.168192-1.15310.127357
13-0.208975-1.43270.079287
14-0.049929-0.34230.366826
150.0311280.21340.415967
160.1014280.69540.245128
17-0.045538-0.31220.378137
180.0751650.51530.304377
190.030350.20810.418038
20-0.00075-0.00510.497961
210.0629730.43170.333958
22-0.069044-0.47330.319081
23-0.084265-0.57770.283114
24-0.049499-0.33930.36793
25-0.079875-0.54760.29328
26-0.171482-1.17560.122834
270.0326820.22410.411844
280.004950.03390.486536
290.1189850.81570.209388
30-0.044885-0.30770.379829
31-0.091243-0.62550.267323
32-0.008354-0.05730.477287
330.0710260.48690.314287
34-0.113709-0.77950.219782
350.0745360.5110.305874
36-0.03208-0.21990.413438
370.0024060.01650.493455
38-0.078082-0.53530.297483
39-0.027431-0.18810.425821
400.0038910.02670.489415
41-0.042701-0.29270.385504
42-0.011443-0.07850.468901
43-0.104557-0.71680.238519
44-0.020133-0.1380.445406
450.0499330.34230.366816
460.008260.05660.477542
47NANANA
48NANANA
49NANANA
50NANANA
51NANANA
52NANANA
53NANANA
54NANANA
55NANANA
56NANANA
57NANANA
58NANANA
59NANANA
60NANANA

\begin{tabular}{lllllllll}
\hline
Partial Autocorrelation Function \tabularnewline
Time lag k & PACF(k) & T-STAT & P-value \tabularnewline
1 & -0.132946 & -0.9114 & 0.183359 \tabularnewline
2 & 0.110841 & 0.7599 & 0.225559 \tabularnewline
3 & 0.208743 & 1.4311 & 0.079513 \tabularnewline
4 & 0.056147 & 0.3849 & 0.351015 \tabularnewline
5 & 0.018416 & 0.1263 & 0.450034 \tabularnewline
6 & 0.090896 & 0.6231 & 0.268099 \tabularnewline
7 & -0.043117 & -0.2956 & 0.384421 \tabularnewline
8 & 0.055437 & 0.3801 & 0.352808 \tabularnewline
9 & -0.181602 & -1.245 & 0.109652 \tabularnewline
10 & -0.08766 & -0.601 & 0.275374 \tabularnewline
11 & 0.065912 & 0.4519 & 0.326722 \tabularnewline
12 & -0.168192 & -1.1531 & 0.127357 \tabularnewline
13 & -0.208975 & -1.4327 & 0.079287 \tabularnewline
14 & -0.049929 & -0.3423 & 0.366826 \tabularnewline
15 & 0.031128 & 0.2134 & 0.415967 \tabularnewline
16 & 0.101428 & 0.6954 & 0.245128 \tabularnewline
17 & -0.045538 & -0.3122 & 0.378137 \tabularnewline
18 & 0.075165 & 0.5153 & 0.304377 \tabularnewline
19 & 0.03035 & 0.2081 & 0.418038 \tabularnewline
20 & -0.00075 & -0.0051 & 0.497961 \tabularnewline
21 & 0.062973 & 0.4317 & 0.333958 \tabularnewline
22 & -0.069044 & -0.4733 & 0.319081 \tabularnewline
23 & -0.084265 & -0.5777 & 0.283114 \tabularnewline
24 & -0.049499 & -0.3393 & 0.36793 \tabularnewline
25 & -0.079875 & -0.5476 & 0.29328 \tabularnewline
26 & -0.171482 & -1.1756 & 0.122834 \tabularnewline
27 & 0.032682 & 0.2241 & 0.411844 \tabularnewline
28 & 0.00495 & 0.0339 & 0.486536 \tabularnewline
29 & 0.118985 & 0.8157 & 0.209388 \tabularnewline
30 & -0.044885 & -0.3077 & 0.379829 \tabularnewline
31 & -0.091243 & -0.6255 & 0.267323 \tabularnewline
32 & -0.008354 & -0.0573 & 0.477287 \tabularnewline
33 & 0.071026 & 0.4869 & 0.314287 \tabularnewline
34 & -0.113709 & -0.7795 & 0.219782 \tabularnewline
35 & 0.074536 & 0.511 & 0.305874 \tabularnewline
36 & -0.03208 & -0.2199 & 0.413438 \tabularnewline
37 & 0.002406 & 0.0165 & 0.493455 \tabularnewline
38 & -0.078082 & -0.5353 & 0.297483 \tabularnewline
39 & -0.027431 & -0.1881 & 0.425821 \tabularnewline
40 & 0.003891 & 0.0267 & 0.489415 \tabularnewline
41 & -0.042701 & -0.2927 & 0.385504 \tabularnewline
42 & -0.011443 & -0.0785 & 0.468901 \tabularnewline
43 & -0.104557 & -0.7168 & 0.238519 \tabularnewline
44 & -0.020133 & -0.138 & 0.445406 \tabularnewline
45 & 0.049933 & 0.3423 & 0.366816 \tabularnewline
46 & 0.00826 & 0.0566 & 0.477542 \tabularnewline
47 & NA & NA & NA \tabularnewline
48 & NA & NA & NA \tabularnewline
49 & NA & NA & NA \tabularnewline
50 & NA & NA & NA \tabularnewline
51 & NA & NA & NA \tabularnewline
52 & NA & NA & NA \tabularnewline
53 & NA & NA & NA \tabularnewline
54 & NA & NA & NA \tabularnewline
55 & NA & NA & NA \tabularnewline
56 & NA & NA & NA \tabularnewline
57 & NA & NA & NA \tabularnewline
58 & NA & NA & NA \tabularnewline
59 & NA & NA & NA \tabularnewline
60 & NA & NA & NA \tabularnewline
\hline
\end{tabular}
%Source: https://freestatistics.org/blog/index.php?pk=69855&T=2

[TABLE]
[ROW][C]Partial Autocorrelation Function[/C][/ROW]
[ROW][C]Time lag k[/C][C]PACF(k)[/C][C]T-STAT[/C][C]P-value[/C][/ROW]
[ROW][C]1[/C][C]-0.132946[/C][C]-0.9114[/C][C]0.183359[/C][/ROW]
[ROW][C]2[/C][C]0.110841[/C][C]0.7599[/C][C]0.225559[/C][/ROW]
[ROW][C]3[/C][C]0.208743[/C][C]1.4311[/C][C]0.079513[/C][/ROW]
[ROW][C]4[/C][C]0.056147[/C][C]0.3849[/C][C]0.351015[/C][/ROW]
[ROW][C]5[/C][C]0.018416[/C][C]0.1263[/C][C]0.450034[/C][/ROW]
[ROW][C]6[/C][C]0.090896[/C][C]0.6231[/C][C]0.268099[/C][/ROW]
[ROW][C]7[/C][C]-0.043117[/C][C]-0.2956[/C][C]0.384421[/C][/ROW]
[ROW][C]8[/C][C]0.055437[/C][C]0.3801[/C][C]0.352808[/C][/ROW]
[ROW][C]9[/C][C]-0.181602[/C][C]-1.245[/C][C]0.109652[/C][/ROW]
[ROW][C]10[/C][C]-0.08766[/C][C]-0.601[/C][C]0.275374[/C][/ROW]
[ROW][C]11[/C][C]0.065912[/C][C]0.4519[/C][C]0.326722[/C][/ROW]
[ROW][C]12[/C][C]-0.168192[/C][C]-1.1531[/C][C]0.127357[/C][/ROW]
[ROW][C]13[/C][C]-0.208975[/C][C]-1.4327[/C][C]0.079287[/C][/ROW]
[ROW][C]14[/C][C]-0.049929[/C][C]-0.3423[/C][C]0.366826[/C][/ROW]
[ROW][C]15[/C][C]0.031128[/C][C]0.2134[/C][C]0.415967[/C][/ROW]
[ROW][C]16[/C][C]0.101428[/C][C]0.6954[/C][C]0.245128[/C][/ROW]
[ROW][C]17[/C][C]-0.045538[/C][C]-0.3122[/C][C]0.378137[/C][/ROW]
[ROW][C]18[/C][C]0.075165[/C][C]0.5153[/C][C]0.304377[/C][/ROW]
[ROW][C]19[/C][C]0.03035[/C][C]0.2081[/C][C]0.418038[/C][/ROW]
[ROW][C]20[/C][C]-0.00075[/C][C]-0.0051[/C][C]0.497961[/C][/ROW]
[ROW][C]21[/C][C]0.062973[/C][C]0.4317[/C][C]0.333958[/C][/ROW]
[ROW][C]22[/C][C]-0.069044[/C][C]-0.4733[/C][C]0.319081[/C][/ROW]
[ROW][C]23[/C][C]-0.084265[/C][C]-0.5777[/C][C]0.283114[/C][/ROW]
[ROW][C]24[/C][C]-0.049499[/C][C]-0.3393[/C][C]0.36793[/C][/ROW]
[ROW][C]25[/C][C]-0.079875[/C][C]-0.5476[/C][C]0.29328[/C][/ROW]
[ROW][C]26[/C][C]-0.171482[/C][C]-1.1756[/C][C]0.122834[/C][/ROW]
[ROW][C]27[/C][C]0.032682[/C][C]0.2241[/C][C]0.411844[/C][/ROW]
[ROW][C]28[/C][C]0.00495[/C][C]0.0339[/C][C]0.486536[/C][/ROW]
[ROW][C]29[/C][C]0.118985[/C][C]0.8157[/C][C]0.209388[/C][/ROW]
[ROW][C]30[/C][C]-0.044885[/C][C]-0.3077[/C][C]0.379829[/C][/ROW]
[ROW][C]31[/C][C]-0.091243[/C][C]-0.6255[/C][C]0.267323[/C][/ROW]
[ROW][C]32[/C][C]-0.008354[/C][C]-0.0573[/C][C]0.477287[/C][/ROW]
[ROW][C]33[/C][C]0.071026[/C][C]0.4869[/C][C]0.314287[/C][/ROW]
[ROW][C]34[/C][C]-0.113709[/C][C]-0.7795[/C][C]0.219782[/C][/ROW]
[ROW][C]35[/C][C]0.074536[/C][C]0.511[/C][C]0.305874[/C][/ROW]
[ROW][C]36[/C][C]-0.03208[/C][C]-0.2199[/C][C]0.413438[/C][/ROW]
[ROW][C]37[/C][C]0.002406[/C][C]0.0165[/C][C]0.493455[/C][/ROW]
[ROW][C]38[/C][C]-0.078082[/C][C]-0.5353[/C][C]0.297483[/C][/ROW]
[ROW][C]39[/C][C]-0.027431[/C][C]-0.1881[/C][C]0.425821[/C][/ROW]
[ROW][C]40[/C][C]0.003891[/C][C]0.0267[/C][C]0.489415[/C][/ROW]
[ROW][C]41[/C][C]-0.042701[/C][C]-0.2927[/C][C]0.385504[/C][/ROW]
[ROW][C]42[/C][C]-0.011443[/C][C]-0.0785[/C][C]0.468901[/C][/ROW]
[ROW][C]43[/C][C]-0.104557[/C][C]-0.7168[/C][C]0.238519[/C][/ROW]
[ROW][C]44[/C][C]-0.020133[/C][C]-0.138[/C][C]0.445406[/C][/ROW]
[ROW][C]45[/C][C]0.049933[/C][C]0.3423[/C][C]0.366816[/C][/ROW]
[ROW][C]46[/C][C]0.00826[/C][C]0.0566[/C][C]0.477542[/C][/ROW]
[ROW][C]47[/C][C]NA[/C][C]NA[/C][C]NA[/C][/ROW]
[ROW][C]48[/C][C]NA[/C][C]NA[/C][C]NA[/C][/ROW]
[ROW][C]49[/C][C]NA[/C][C]NA[/C][C]NA[/C][/ROW]
[ROW][C]50[/C][C]NA[/C][C]NA[/C][C]NA[/C][/ROW]
[ROW][C]51[/C][C]NA[/C][C]NA[/C][C]NA[/C][/ROW]
[ROW][C]52[/C][C]NA[/C][C]NA[/C][C]NA[/C][/ROW]
[ROW][C]53[/C][C]NA[/C][C]NA[/C][C]NA[/C][/ROW]
[ROW][C]54[/C][C]NA[/C][C]NA[/C][C]NA[/C][/ROW]
[ROW][C]55[/C][C]NA[/C][C]NA[/C][C]NA[/C][/ROW]
[ROW][C]56[/C][C]NA[/C][C]NA[/C][C]NA[/C][/ROW]
[ROW][C]57[/C][C]NA[/C][C]NA[/C][C]NA[/C][/ROW]
[ROW][C]58[/C][C]NA[/C][C]NA[/C][C]NA[/C][/ROW]
[ROW][C]59[/C][C]NA[/C][C]NA[/C][C]NA[/C][/ROW]
[ROW][C]60[/C][C]NA[/C][C]NA[/C][C]NA[/C][/ROW]
[/TABLE]
Source: https://freestatistics.org/blog/index.php?pk=69855&T=2

Globally Unique Identifier (entire table): ba.freestatistics.org/blog/index.php?pk=69855&T=2

As an alternative you can also use a QR Code:  

The GUIDs for individual cells are displayed in the table below:

Partial Autocorrelation Function
Time lag kPACF(k)T-STATP-value
1-0.132946-0.91140.183359
20.1108410.75990.225559
30.2087431.43110.079513
40.0561470.38490.351015
50.0184160.12630.450034
60.0908960.62310.268099
7-0.043117-0.29560.384421
80.0554370.38010.352808
9-0.181602-1.2450.109652
10-0.08766-0.6010.275374
110.0659120.45190.326722
12-0.168192-1.15310.127357
13-0.208975-1.43270.079287
14-0.049929-0.34230.366826
150.0311280.21340.415967
160.1014280.69540.245128
17-0.045538-0.31220.378137
180.0751650.51530.304377
190.030350.20810.418038
20-0.00075-0.00510.497961
210.0629730.43170.333958
22-0.069044-0.47330.319081
23-0.084265-0.57770.283114
24-0.049499-0.33930.36793
25-0.079875-0.54760.29328
26-0.171482-1.17560.122834
270.0326820.22410.411844
280.004950.03390.486536
290.1189850.81570.209388
30-0.044885-0.30770.379829
31-0.091243-0.62550.267323
32-0.008354-0.05730.477287
330.0710260.48690.314287
34-0.113709-0.77950.219782
350.0745360.5110.305874
36-0.03208-0.21990.413438
370.0024060.01650.493455
38-0.078082-0.53530.297483
39-0.027431-0.18810.425821
400.0038910.02670.489415
41-0.042701-0.29270.385504
42-0.011443-0.07850.468901
43-0.104557-0.71680.238519
44-0.020133-0.1380.445406
450.0499330.34230.366816
460.008260.05660.477542
47NANANA
48NANANA
49NANANA
50NANANA
51NANANA
52NANANA
53NANANA
54NANANA
55NANANA
56NANANA
57NANANA
58NANANA
59NANANA
60NANANA


Parameters (Session):
par1 = 60 ; par2 = 1 ; par3 = 1 ; par4 = 1 ; par5 = 12 ; par6 = MA ; par7 = 0.95 ;
Parameters (R input):
par1 = 60 ; par2 = 1 ; par3 = 1 ; par4 = 1 ; par5 = 12 ; par6 = MA ; par7 = 0.95 ;
R code (references can be found in the software module):
if (par1 == 'Default') {
par1 = 10*log10(length(x))
} else {
par1 <- as.numeric(par1)
}
par2 <- as.numeric(par2)
par3 <- as.numeric(par3)
par4 <- as.numeric(par4)
par5 <- as.numeric(par5)
if (par6 == 'White Noise') par6 <- 'white' else par6 <- 'ma'
par7 <- as.numeric(par7)
if (par2 == 0) {
x <- log(x)
} else {
x <- (x ^ par2 - 1) / par2
}
if (par3 > 0) x <- diff(x,lag=1,difference=par3)
if (par4 > 0) x <- diff(x,lag=par5,difference=par4)
bitmap(file='pic1.png')
racf <- acf(x, par1, main='Autocorrelation', xlab='time lag', ylab='ACF', ci.type=par6, ci=par7, sub=paste('(lambda=',par2,', d=',par3,', D=',par4,', CI=', par7, ', CI type=',par6,')',sep=''))
dev.off()
bitmap(file='pic2.png')
rpacf <- pacf(x,par1,main='Partial Autocorrelation',xlab='lags',ylab='PACF')
dev.off()
(myacf <- c(racf$acf))
(mypacf <- c(rpacf$acf))
lengthx <- length(x)
sqrtn <- sqrt(lengthx)
load(file='createtable')
a<-table.start()
a<-table.row.start(a)
a<-table.element(a,'Autocorrelation Function',4,TRUE)
a<-table.row.end(a)
a<-table.row.start(a)
a<-table.element(a,'Time lag k',header=TRUE)
a<-table.element(a,hyperlink('basics.htm','ACF(k)','click here for more information about the Autocorrelation Function'),header=TRUE)
a<-table.element(a,'T-STAT',header=TRUE)
a<-table.element(a,'P-value',header=TRUE)
a<-table.row.end(a)
for (i in 2:(par1+1)) {
a<-table.row.start(a)
a<-table.element(a,i-1,header=TRUE)
a<-table.element(a,round(myacf[i],6))
mytstat <- myacf[i]*sqrtn
a<-table.element(a,round(mytstat,4))
a<-table.element(a,round(1-pt(abs(mytstat),lengthx),6))
a<-table.row.end(a)
}
a<-table.end(a)
table.save(a,file='mytable.tab')
a<-table.start()
a<-table.row.start(a)
a<-table.element(a,'Partial Autocorrelation Function',4,TRUE)
a<-table.row.end(a)
a<-table.row.start(a)
a<-table.element(a,'Time lag k',header=TRUE)
a<-table.element(a,hyperlink('basics.htm','PACF(k)','click here for more information about the Partial Autocorrelation Function'),header=TRUE)
a<-table.element(a,'T-STAT',header=TRUE)
a<-table.element(a,'P-value',header=TRUE)
a<-table.row.end(a)
for (i in 1:par1) {
a<-table.row.start(a)
a<-table.element(a,i,header=TRUE)
a<-table.element(a,round(mypacf[i],6))
mytstat <- mypacf[i]*sqrtn
a<-table.element(a,round(mytstat,4))
a<-table.element(a,round(1-pt(abs(mytstat),lengthx),6))
a<-table.row.end(a)
}
a<-table.end(a)
table.save(a,file='mytable1.tab')