Free Statistics

of Irreproducible Research!

Author's title

Author*Unverified author*
R Software Modulerwasp_fitdistrlnorm.wasp
Title produced by softwareMaximum-likelihood Fitting - Lognormal Distribution
Date of computationWed, 04 Nov 2009 03:07:35 -0700
Cite this page as followsStatistical Computations at FreeStatistics.org, Office for Research Development and Education, URL https://freestatistics.org/blog/index.php?v=date/2009/Nov/04/t1257329360hk51k965ejeaf3h.htm/, Retrieved Mon, 29 Apr 2024 11:55:41 +0000
Statistical Computations at FreeStatistics.org, Office for Research Development and Education, URL https://freestatistics.org/blog/index.php?pk=53501, Retrieved Mon, 29 Apr 2024 11:55:41 +0000
QR Codes:

Original text written by user:Log-normal distribution of participant 2 on the number-letter task, 0 values removed
IsPrivate?No (this computation is public)
User-defined keywords
Estimated Impact150
Family? (F = Feedback message, R = changed R code, M = changed R Module, P = changed Parameters, D = changed Data)
-       [Maximum-likelihood Fitting - Lognormal Distribution] [sarka-number-lett...] [2009-11-04 10:07:35] [d41d8cd98f00b204e9800998ecf8427e] [Current]
Feedback Forum

Post a new message
Dataseries X:
1066
1315
4447
2513
1154
2167
2497
4182
3053
1690
1102
3386
1112
2687
773
1701
2592
3255
852
3308
2229
1410
4241
1613
1098
922
4766
1088
1626
854
1327
871
1930
2562
2405
873
3878
2195
1628
1577
3997
893
1597
1049
2499
703
2448
1122
2049
668
1354
665
1430
825
2359
925
1769
505
943
2965
2141
1183
1880
935
1286
2398
1313
2661
1714
722
1116
1868
2193
645
3674
3541
2613
1153
2890
3889
1758
541
888
3223
2890
690
1478
1527
4306
646
1318
1886
1712
988
3587
2692
2464
500
4270
3313
1997
675
2709
719
2137
693
2218
2398
1393
580
1156
976
1268
908
1897
3189
580
1196
763
4117
828
1087
1400
1443


Summary of computational transaction
Raw Inputview raw input (R code)
Raw Outputview raw output of R engine
Computing time1 seconds
R Server'Gwilym Jenkins' @ 72.249.127.135

\begin{tabular}{lllllllll}
\hline
Summary of computational transaction \tabularnewline
Raw Input & view raw input (R code)  \tabularnewline
Raw Output & view raw output of R engine  \tabularnewline
Computing time & 1 seconds \tabularnewline
R Server & 'Gwilym Jenkins' @ 72.249.127.135 \tabularnewline
\hline
\end{tabular}
%Source: https://freestatistics.org/blog/index.php?pk=53501&T=0

[TABLE]
[ROW][C]Summary of computational transaction[/C][/ROW]
[ROW][C]Raw Input[/C][C]view raw input (R code) [/C][/ROW]
[ROW][C]Raw Output[/C][C]view raw output of R engine [/C][/ROW]
[ROW][C]Computing time[/C][C]1 seconds[/C][/ROW]
[ROW][C]R Server[/C][C]'Gwilym Jenkins' @ 72.249.127.135[/C][/ROW]
[/TABLE]
Source: https://freestatistics.org/blog/index.php?pk=53501&T=0

Globally Unique Identifier (entire table): ba.freestatistics.org/blog/index.php?pk=53501&T=0

As an alternative you can also use a QR Code:  

The GUIDs for individual cells are displayed in the table below:

Summary of computational transaction
Raw Inputview raw input (R code)
Raw Outputview raw output of R engine
Computing time1 seconds
R Server'Gwilym Jenkins' @ 72.249.127.135


ParameterEstimated ValueStandard Deviation
meanlog7.368741798439630.0521155616730109
sdlog0.5803343340637200.0368512670643317

\begin{tabular}{lllllllll}
\hline
Parameter & Estimated Value & Standard Deviation \tabularnewline
meanlog & 7.36874179843963 & 0.0521155616730109 \tabularnewline
sdlog & 0.580334334063720 & 0.0368512670643317 \tabularnewline
\hline
\end{tabular}
%Source: https://freestatistics.org/blog/index.php?pk=53501&T=1

[TABLE]
[ROW][C]Parameter[/C][C]Estimated Value[/C][C]Standard Deviation[/C][/ROW]
[ROW][C]meanlog[/C][C]7.36874179843963[/C][C]0.0521155616730109[/C][/ROW]
[ROW][C]sdlog[/C][C]0.580334334063720[/C][C]0.0368512670643317[/C][/ROW]
[/TABLE]
Source: https://freestatistics.org/blog/index.php?pk=53501&T=1

Globally Unique Identifier (entire table): ba.freestatistics.org/blog/index.php?pk=53501&T=1

As an alternative you can also use a QR Code:  

The GUIDs for individual cells are displayed in the table below:

ParameterEstimated ValueStandard Deviation
meanlog7.368741798439630.0521155616730109
sdlog0.5803343340637200.0368512670643317


Parameters (Session):
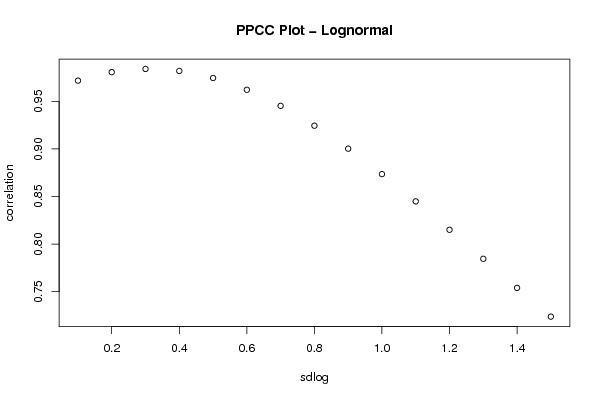
par1 = 0.1 ; par2 = 1.5 ;
Parameters (R input):
par1 = 0.1 ; par2 = 1.5 ;
R code (references can be found in the software module):
library(MASS)
PPCC <- function(meanlog, sdlog, x)
{
x <- sort(x)
pp <- ppoints(x)
cor(qlnorm(pp, meanlog=meanlog, sdlog=sdlog), x)
}
par1 <- as.numeric(par1)
par2 <- as.numeric(par2)
if (par1 < 0.1) par1 <- 0.1
if (par1 > 50) par1 <- 50
if (par2 < 0.1) par2 <- 0.1
if (par2 > 50) par2 <- 50
par1h <- par1*10
par2h <- par2*10
sortx <- sort(x)
c <- array(NA,dim=c(par2h))
for (i in par1h:par2h)
{
c[i] <- cor(qlnorm(ppoints(x), meanlog=0,sdlog=i/10),sortx)
}
bitmap(file='test1.png')
plot((par1h:par2h)/10,c[par1h:par2h],xlab='sdlog',ylab='correlation',main='PPCC Plot - Lognormal')
dev.off()
(f<-fitdistr(x, 'lognormal'))
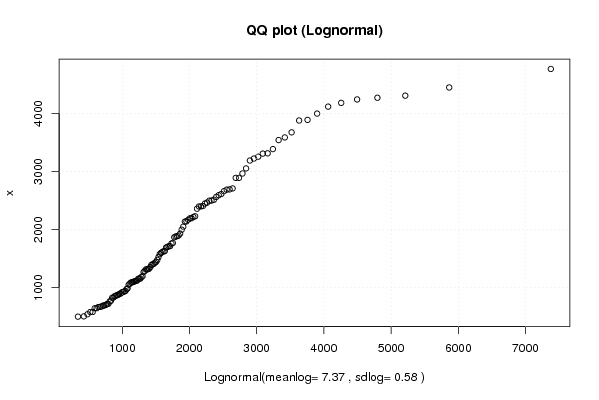
xlab <- paste('Lognormal(meanlog=',round(f$estimate[[1]],2))
xlab <- paste(xlab,', sdlog=')
xlab <- paste(xlab,round(f$estimate[[2]],2))
xlab <- paste(xlab,')')
bitmap(file='test2.png')
qqplot(qlnorm(ppoints(x), meanlog=f$estimate[[1]], sdlog=f$estimate[[2]]), x, main='QQ plot (Lognormal)', xlab=xlab )
grid()
dev.off()
load(file='createtable')
a<-table.start()
a<-table.row.start(a)
a<-table.element(a,'Parameter',1,TRUE)
a<-table.element(a,'Estimated Value',1,TRUE)
a<-table.element(a,'Standard Deviation',1,TRUE)
a<-table.row.end(a)
a<-table.row.start(a)
a<-table.element(a,'meanlog',header=TRUE)
a<-table.element(a,f$estimate[1])
a<-table.element(a,f$sd[1])
a<-table.row.end(a)
a<-table.row.start(a)
a<-table.element(a,'sdlog',header=TRUE)
a<-table.element(a,f$estimate[2])
a<-table.element(a,f$sd[2])
a<-table.row.end(a)
a<-table.end(a)
table.save(a,file='mytable.tab')