Free Statistics

of Irreproducible Research!

Author's title

Author*The author of this computation has been verified*
R Software Modulerwasp_multipleregression.wasp
Title produced by softwareMultiple Regression
Date of computationThu, 19 Nov 2009 10:13:05 -0700
Cite this page as followsStatistical Computations at FreeStatistics.org, Office for Research Development and Education, URL https://freestatistics.org/blog/index.php?v=date/2009/Nov/19/t1258650905n94of1j3k21ghql.htm/, Retrieved Fri, 26 Apr 2024 03:25:30 +0000
Statistical Computations at FreeStatistics.org, Office for Research Development and Education, URL https://freestatistics.org/blog/index.php?pk=57839, Retrieved Fri, 26 Apr 2024 03:25:30 +0000
QR Codes:

Original text written by user:Uitleg in Word document
IsPrivate?No (this computation is public)
User-defined keywords
Estimated Impact173
Family? (F = Feedback message, R = changed R code, M = changed R Module, P = changed Parameters, D = changed Data)
-     [Multiple Regression] [Q1 The Seatbeltlaw] [2007-11-14 19:27:43] [8cd6641b921d30ebe00b648d1481bba0]
- RM D  [Multiple Regression] [Seatbelt] [2009-11-12 14:06:21] [b98453cac15ba1066b407e146608df68]
- R  D      [Multiple Regression] [Regressiemodel - ...] [2009-11-19 17:13:05] [8eb8270f5a1cfdf0409dcfcbf10be18b] [Current]
-    D        [Multiple Regression] [] [2010-12-27 13:33:24] [1ec36cc0fd92fd0f07d0b885ce2c369b]
- R  D        [Multiple Regression] [] [2010-12-29 18:38:10] [adca540665f1dd1a5a4406fd7f55bdf4]
- RMPD        [Spectral Analysis] [] [2010-12-29 18:52:22] [adca540665f1dd1a5a4406fd7f55bdf4]
Feedback Forum

Post a new message
Dataseries X:
96.96	89.1
93.11	83.3
95.62	97.7
98.30	100.9
96.38	108.3
100.82	113.2
99.06	105
94.03	104
102.07	109.8
99.31	98.6
98.64	93.5
101.82	98.2
99.14	88
97.63	85.3
100.06	96.8
101.32	98.8
101.49	110.3
105.43	111.6
105.09	111.2
99.48	106.9
108.53	117.6
104.34	97
106.10	97.3
107.35	98.4
103.00	87.6
104.50	87.4
105.17	94.7
104.84	101.5
106.18	110.4
108.86	108.4
107.77	109.7
102.74	105.2
112.63	111.1
106.26	96.2
108.86	97.3
111.38	98.9
106.85	91.7
107.86	90.9
107.94	98.8
111.38	111.5
111.29	119
113.72	115.3
111.88	116.3
109.87	113.6
113.72	115.1
111.71	109.7
114.81	97.6
112.05	100.8
111.54	94
110.87	87.2
110.87	102.9
115.48	111.3
111.63	106.6
116.24	108.9
113.56	108.3
106.01	100.5
110.45	104
107.77	89.9
108.61	86.8
108.19	91.2


Summary of computational transaction
Raw Inputview raw input (R code)
Raw Outputview raw output of R engine
Computing time3 seconds
R Server'Gwilym Jenkins' @ 72.249.127.135

\begin{tabular}{lllllllll}
\hline
Summary of computational transaction \tabularnewline
Raw Input & view raw input (R code)  \tabularnewline
Raw Output & view raw output of R engine  \tabularnewline
Computing time & 3 seconds \tabularnewline
R Server & 'Gwilym Jenkins' @ 72.249.127.135 \tabularnewline
\hline
\end{tabular}
%Source: https://freestatistics.org/blog/index.php?pk=57839&T=0

[TABLE]
[ROW][C]Summary of computational transaction[/C][/ROW]
[ROW][C]Raw Input[/C][C]view raw input (R code) [/C][/ROW]
[ROW][C]Raw Output[/C][C]view raw output of R engine [/C][/ROW]
[ROW][C]Computing time[/C][C]3 seconds[/C][/ROW]
[ROW][C]R Server[/C][C]'Gwilym Jenkins' @ 72.249.127.135[/C][/ROW]
[/TABLE]
Source: https://freestatistics.org/blog/index.php?pk=57839&T=0

Globally Unique Identifier (entire table): ba.freestatistics.org/blog/index.php?pk=57839&T=0

As an alternative you can also use a QR Code:  

The GUIDs for individual cells are displayed in the table below:

Summary of computational transaction
Raw Inputview raw input (R code)
Raw Outputview raw output of R engine
Computing time3 seconds
R Server'Gwilym Jenkins' @ 72.249.127.135


Multiple Linear Regression - Estimated Regression Equation
BESTC[t] = + 56.7055652840370 + 0.427784443400585INDUSTR[t] + 1.49132630137853M1[t] + 1.91125215674213M2[t] -2.08103055041091M3[t] -2.85161499584517M4[t] -6.61030721957914M5[t] -3.50051793800585M6[t] -4.72282683623544M7[t] -8.30267342615144M8[t] -3.86358360610904M9[t] -2.07236900560768M10[t] + 0.800004760324151M11[t] + 0.270651430122387t + e[t]

\begin{tabular}{lllllllll}
\hline
Multiple Linear Regression - Estimated Regression Equation \tabularnewline
BESTC[t] =  +  56.7055652840370 +  0.427784443400585INDUSTR[t] +  1.49132630137853M1[t] +  1.91125215674213M2[t] -2.08103055041091M3[t] -2.85161499584517M4[t] -6.61030721957914M5[t] -3.50051793800585M6[t] -4.72282683623544M7[t] -8.30267342615144M8[t] -3.86358360610904M9[t] -2.07236900560768M10[t] +  0.800004760324151M11[t] +  0.270651430122387t  + e[t] \tabularnewline
\hline
\end{tabular}
%Source: https://freestatistics.org/blog/index.php?pk=57839&T=1

[TABLE]
[ROW][C]Multiple Linear Regression - Estimated Regression Equation[/C][/ROW]
[ROW][C]BESTC[t] =  +  56.7055652840370 +  0.427784443400585INDUSTR[t] +  1.49132630137853M1[t] +  1.91125215674213M2[t] -2.08103055041091M3[t] -2.85161499584517M4[t] -6.61030721957914M5[t] -3.50051793800585M6[t] -4.72282683623544M7[t] -8.30267342615144M8[t] -3.86358360610904M9[t] -2.07236900560768M10[t] +  0.800004760324151M11[t] +  0.270651430122387t  + e[t][/C][/ROW]
[/TABLE]
Source: https://freestatistics.org/blog/index.php?pk=57839&T=1

Globally Unique Identifier (entire table): ba.freestatistics.org/blog/index.php?pk=57839&T=1

As an alternative you can also use a QR Code:  

The GUIDs for individual cells are displayed in the table below:

Multiple Linear Regression - Estimated Regression Equation
BESTC[t] = + 56.7055652840370 + 0.427784443400585INDUSTR[t] + 1.49132630137853M1[t] + 1.91125215674213M2[t] -2.08103055041091M3[t] -2.85161499584517M4[t] -6.61030721957914M5[t] -3.50051793800585M6[t] -4.72282683623544M7[t] -8.30267342615144M8[t] -3.86358360610904M9[t] -2.07236900560768M10[t] + 0.800004760324151M11[t] + 0.270651430122387t + e[t]


Multiple Linear Regression - Ordinary Least Squares
VariableParameterS.D.T-STATH0: parameter = 02-tail p-value1-tail p-value
(Intercept)56.70556528403705.02609811.282200
INDUSTR0.4277844434005850.0513638.328700
M11.491326301378531.0871231.37180.1767770.088388
M21.911252156742131.1534881.65690.1043390.05217
M3-2.081030550410911.022239-2.03580.0475580.023779
M4-2.851614995845171.090707-2.61450.0120410.006021
M5-6.610307219579141.235823-5.34893e-061e-06
M6-3.500517938005851.250703-2.79880.0074690.003735
M7-4.722826836235441.209414-3.90510.0003060.000153
M8-8.302673426151441.109301-7.484600
M9-3.863583606109041.24773-3.09650.0033310.001666
M10-2.072369005607681.016378-2.0390.0472230.023611
M110.8000047603241511.0266560.77920.4398330.219916
t0.2706514301223870.01229822.007200

\begin{tabular}{lllllllll}
\hline
Multiple Linear Regression - Ordinary Least Squares \tabularnewline
Variable & Parameter & S.D. & T-STATH0: parameter = 0 & 2-tail p-value & 1-tail p-value \tabularnewline
(Intercept) & 56.7055652840370 & 5.026098 & 11.2822 & 0 & 0 \tabularnewline
INDUSTR & 0.427784443400585 & 0.051363 & 8.3287 & 0 & 0 \tabularnewline
M1 & 1.49132630137853 & 1.087123 & 1.3718 & 0.176777 & 0.088388 \tabularnewline
M2 & 1.91125215674213 & 1.153488 & 1.6569 & 0.104339 & 0.05217 \tabularnewline
M3 & -2.08103055041091 & 1.022239 & -2.0358 & 0.047558 & 0.023779 \tabularnewline
M4 & -2.85161499584517 & 1.090707 & -2.6145 & 0.012041 & 0.006021 \tabularnewline
M5 & -6.61030721957914 & 1.235823 & -5.3489 & 3e-06 & 1e-06 \tabularnewline
M6 & -3.50051793800585 & 1.250703 & -2.7988 & 0.007469 & 0.003735 \tabularnewline
M7 & -4.72282683623544 & 1.209414 & -3.9051 & 0.000306 & 0.000153 \tabularnewline
M8 & -8.30267342615144 & 1.109301 & -7.4846 & 0 & 0 \tabularnewline
M9 & -3.86358360610904 & 1.24773 & -3.0965 & 0.003331 & 0.001666 \tabularnewline
M10 & -2.07236900560768 & 1.016378 & -2.039 & 0.047223 & 0.023611 \tabularnewline
M11 & 0.800004760324151 & 1.026656 & 0.7792 & 0.439833 & 0.219916 \tabularnewline
t & 0.270651430122387 & 0.012298 & 22.0072 & 0 & 0 \tabularnewline
\hline
\end{tabular}
%Source: https://freestatistics.org/blog/index.php?pk=57839&T=2

[TABLE]
[ROW][C]Multiple Linear Regression - Ordinary Least Squares[/C][/ROW]
[ROW][C]Variable[/C][C]Parameter[/C][C]S.D.[/C][C]T-STATH0: parameter = 0[/C][C]2-tail p-value[/C][C]1-tail p-value[/C][/ROW]
[ROW][C](Intercept)[/C][C]56.7055652840370[/C][C]5.026098[/C][C]11.2822[/C][C]0[/C][C]0[/C][/ROW]
[ROW][C]INDUSTR[/C][C]0.427784443400585[/C][C]0.051363[/C][C]8.3287[/C][C]0[/C][C]0[/C][/ROW]
[ROW][C]M1[/C][C]1.49132630137853[/C][C]1.087123[/C][C]1.3718[/C][C]0.176777[/C][C]0.088388[/C][/ROW]
[ROW][C]M2[/C][C]1.91125215674213[/C][C]1.153488[/C][C]1.6569[/C][C]0.104339[/C][C]0.05217[/C][/ROW]
[ROW][C]M3[/C][C]-2.08103055041091[/C][C]1.022239[/C][C]-2.0358[/C][C]0.047558[/C][C]0.023779[/C][/ROW]
[ROW][C]M4[/C][C]-2.85161499584517[/C][C]1.090707[/C][C]-2.6145[/C][C]0.012041[/C][C]0.006021[/C][/ROW]
[ROW][C]M5[/C][C]-6.61030721957914[/C][C]1.235823[/C][C]-5.3489[/C][C]3e-06[/C][C]1e-06[/C][/ROW]
[ROW][C]M6[/C][C]-3.50051793800585[/C][C]1.250703[/C][C]-2.7988[/C][C]0.007469[/C][C]0.003735[/C][/ROW]
[ROW][C]M7[/C][C]-4.72282683623544[/C][C]1.209414[/C][C]-3.9051[/C][C]0.000306[/C][C]0.000153[/C][/ROW]
[ROW][C]M8[/C][C]-8.30267342615144[/C][C]1.109301[/C][C]-7.4846[/C][C]0[/C][C]0[/C][/ROW]
[ROW][C]M9[/C][C]-3.86358360610904[/C][C]1.24773[/C][C]-3.0965[/C][C]0.003331[/C][C]0.001666[/C][/ROW]
[ROW][C]M10[/C][C]-2.07236900560768[/C][C]1.016378[/C][C]-2.039[/C][C]0.047223[/C][C]0.023611[/C][/ROW]
[ROW][C]M11[/C][C]0.800004760324151[/C][C]1.026656[/C][C]0.7792[/C][C]0.439833[/C][C]0.219916[/C][/ROW]
[ROW][C]t[/C][C]0.270651430122387[/C][C]0.012298[/C][C]22.0072[/C][C]0[/C][C]0[/C][/ROW]
[/TABLE]
Source: https://freestatistics.org/blog/index.php?pk=57839&T=2

Globally Unique Identifier (entire table): ba.freestatistics.org/blog/index.php?pk=57839&T=2

As an alternative you can also use a QR Code:  

The GUIDs for individual cells are displayed in the table below:

Multiple Linear Regression - Ordinary Least Squares
VariableParameterS.D.T-STATH0: parameter = 02-tail p-value1-tail p-value
(Intercept)56.70556528403705.02609811.282200
INDUSTR0.4277844434005850.0513638.328700
M11.491326301378531.0871231.37180.1767770.088388
M21.911252156742131.1534881.65690.1043390.05217
M3-2.081030550410911.022239-2.03580.0475580.023779
M4-2.851614995845171.090707-2.61450.0120410.006021
M5-6.610307219579141.235823-5.34893e-061e-06
M6-3.500517938005851.250703-2.79880.0074690.003735
M7-4.722826836235441.209414-3.90510.0003060.000153
M8-8.302673426151441.109301-7.484600
M9-3.863583606109041.24773-3.09650.0033310.001666
M10-2.072369005607681.016378-2.0390.0472230.023611
M110.8000047603241511.0266560.77920.4398330.219916
t0.2706514301223870.01229822.007200


Multiple Linear Regression - Regression Statistics
Multiple R0.969917333827114
R-squared0.940739634458297
Adjusted R-squared0.923992139848686
F-TEST (value)56.1719622180619
F-TEST (DF numerator)13
F-TEST (DF denominator)46
p-value0
Multiple Linear Regression - Residual Statistics
Residual Standard Deviation1.60513216920770
Sum Squared Residuals118.516666908769

\begin{tabular}{lllllllll}
\hline
Multiple Linear Regression - Regression Statistics \tabularnewline
Multiple R & 0.969917333827114 \tabularnewline
R-squared & 0.940739634458297 \tabularnewline
Adjusted R-squared & 0.923992139848686 \tabularnewline
F-TEST (value) & 56.1719622180619 \tabularnewline
F-TEST (DF numerator) & 13 \tabularnewline
F-TEST (DF denominator) & 46 \tabularnewline
p-value & 0 \tabularnewline
Multiple Linear Regression - Residual Statistics \tabularnewline
Residual Standard Deviation & 1.60513216920770 \tabularnewline
Sum Squared Residuals & 118.516666908769 \tabularnewline
\hline
\end{tabular}
%Source: https://freestatistics.org/blog/index.php?pk=57839&T=3

[TABLE]
[ROW][C]Multiple Linear Regression - Regression Statistics[/C][/ROW]
[ROW][C]Multiple R[/C][C]0.969917333827114[/C][/ROW]
[ROW][C]R-squared[/C][C]0.940739634458297[/C][/ROW]
[ROW][C]Adjusted R-squared[/C][C]0.923992139848686[/C][/ROW]
[ROW][C]F-TEST (value)[/C][C]56.1719622180619[/C][/ROW]
[ROW][C]F-TEST (DF numerator)[/C][C]13[/C][/ROW]
[ROW][C]F-TEST (DF denominator)[/C][C]46[/C][/ROW]
[ROW][C]p-value[/C][C]0[/C][/ROW]
[ROW][C]Multiple Linear Regression - Residual Statistics[/C][/ROW]
[ROW][C]Residual Standard Deviation[/C][C]1.60513216920770[/C][/ROW]
[ROW][C]Sum Squared Residuals[/C][C]118.516666908769[/C][/ROW]
[/TABLE]
Source: https://freestatistics.org/blog/index.php?pk=57839&T=3

Globally Unique Identifier (entire table): ba.freestatistics.org/blog/index.php?pk=57839&T=3

As an alternative you can also use a QR Code:  

The GUIDs for individual cells are displayed in the table below:

Multiple Linear Regression - Regression Statistics
Multiple R0.969917333827114
R-squared0.940739634458297
Adjusted R-squared0.923992139848686
F-TEST (value)56.1719622180619
F-TEST (DF numerator)13
F-TEST (DF denominator)46
p-value0
Multiple Linear Regression - Residual Statistics
Residual Standard Deviation1.60513216920770
Sum Squared Residuals118.516666908769


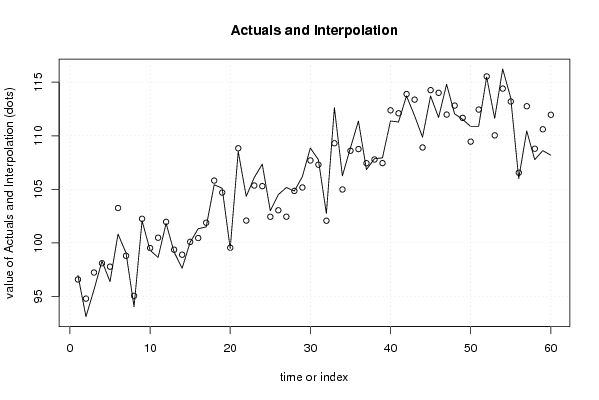
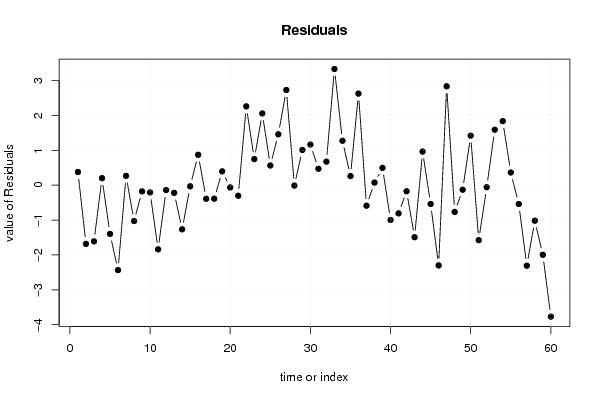
Multiple Linear Regression - Actuals, Interpolation, and Residuals
Time or IndexActualsInterpolationForecastResidualsPrediction Error
196.9696.58313692253040.376863077469554
293.1194.7925644362927-1.68256443629265
395.6297.2310291442304-1.61102914423043
498.398.10000634780040.199993652199554
596.3897.7775704353532-1.39757043535318
6100.82103.254154919712-2.43415491971174
799.0698.79466501571970.265334984280270
894.0395.0576854125255-1.02768541252553
9102.07102.248576434414-0.178576434413718
1099.3199.519256698951-0.20925669895091
1198.64100.480581233662-1.84058123366214
12101.82101.961814787443-0.141814787443135
1399.1499.360391196258-0.220391196258066
1497.6398.8959504845625-1.26595048456249
15100.06100.093840306639-0.0338403066385519
16101.32100.4494761781280.870523821872151
17101.49101.880956483623-0.390956483623005
18105.43105.817516971739-0.387516971739418
19105.09104.6947457262720.395254273727996
2099.4899.5460774598559-0.0660774598558651
21108.53108.833112254407-0.303112254406920
22104.34102.0826187509792.25738124902139
23106.1105.3539792800530.746020719946994
24107.35105.2951888375922.05481116240811
25103102.4370945803660.562905419633528
26104.5103.0421149771721.45788502282766
27105.17102.4433101369662.72668986303404
28104.84104.852311336778-0.0123113367780628
29106.18105.1715520894321.00844791056831
30108.86107.6964239143261.16357608567380
31107.77107.3008862226400.469113777360228
32102.74102.0666610675440.673338932456485
33112.63109.3003305337723.32966946622824
34106.26104.9882083577271.27179164227322
35108.86108.6017964415220.258203558478359
36111.38108.7568982207612.62310177923918
37106.85107.438827959778-0.588827959777521
38107.86107.7871776905430.07282230945697
39107.94107.4450435163770.494956483622992
40111.38112.377972932253-0.997972932252565
41111.29112.098315464145-0.808315464145366
42113.72113.895953735259-0.175953735258875
43111.88113.372080710552-1.49208071055227
44109.87108.9078675535770.962132446422937
45113.72114.259285468843-0.539285468842736
46111.71114.011115505103-2.30111550510333
47114.81111.9779489360102.83205106398955
48112.05112.817505824691-0.767505824690569
49111.54111.670549341067-0.130549341067496
50110.87109.4521924114291.41780758857051
51110.87112.446776895788-1.57677689578804
52115.48115.540233205041-0.0602332050410774
53111.63110.0416055274471.58839447255325
54116.24114.4059504589641.83404954103623
55113.56113.1976223248160.362377675183779
56106.01106.551708506498-0.541708506498028
57110.45112.758695308565-2.30869530856487
58107.77108.788800687240-1.01880068724038
59108.61110.605694108753-1.99569410875277
60108.19111.958592329514-3.76859232951359

\begin{tabular}{lllllllll}
\hline
Multiple Linear Regression - Actuals, Interpolation, and Residuals \tabularnewline
Time or Index & Actuals & InterpolationForecast & ResidualsPrediction Error \tabularnewline
1 & 96.96 & 96.5831369225304 & 0.376863077469554 \tabularnewline
2 & 93.11 & 94.7925644362927 & -1.68256443629265 \tabularnewline
3 & 95.62 & 97.2310291442304 & -1.61102914423043 \tabularnewline
4 & 98.3 & 98.1000063478004 & 0.199993652199554 \tabularnewline
5 & 96.38 & 97.7775704353532 & -1.39757043535318 \tabularnewline
6 & 100.82 & 103.254154919712 & -2.43415491971174 \tabularnewline
7 & 99.06 & 98.7946650157197 & 0.265334984280270 \tabularnewline
8 & 94.03 & 95.0576854125255 & -1.02768541252553 \tabularnewline
9 & 102.07 & 102.248576434414 & -0.178576434413718 \tabularnewline
10 & 99.31 & 99.519256698951 & -0.20925669895091 \tabularnewline
11 & 98.64 & 100.480581233662 & -1.84058123366214 \tabularnewline
12 & 101.82 & 101.961814787443 & -0.141814787443135 \tabularnewline
13 & 99.14 & 99.360391196258 & -0.220391196258066 \tabularnewline
14 & 97.63 & 98.8959504845625 & -1.26595048456249 \tabularnewline
15 & 100.06 & 100.093840306639 & -0.0338403066385519 \tabularnewline
16 & 101.32 & 100.449476178128 & 0.870523821872151 \tabularnewline
17 & 101.49 & 101.880956483623 & -0.390956483623005 \tabularnewline
18 & 105.43 & 105.817516971739 & -0.387516971739418 \tabularnewline
19 & 105.09 & 104.694745726272 & 0.395254273727996 \tabularnewline
20 & 99.48 & 99.5460774598559 & -0.0660774598558651 \tabularnewline
21 & 108.53 & 108.833112254407 & -0.303112254406920 \tabularnewline
22 & 104.34 & 102.082618750979 & 2.25738124902139 \tabularnewline
23 & 106.1 & 105.353979280053 & 0.746020719946994 \tabularnewline
24 & 107.35 & 105.295188837592 & 2.05481116240811 \tabularnewline
25 & 103 & 102.437094580366 & 0.562905419633528 \tabularnewline
26 & 104.5 & 103.042114977172 & 1.45788502282766 \tabularnewline
27 & 105.17 & 102.443310136966 & 2.72668986303404 \tabularnewline
28 & 104.84 & 104.852311336778 & -0.0123113367780628 \tabularnewline
29 & 106.18 & 105.171552089432 & 1.00844791056831 \tabularnewline
30 & 108.86 & 107.696423914326 & 1.16357608567380 \tabularnewline
31 & 107.77 & 107.300886222640 & 0.469113777360228 \tabularnewline
32 & 102.74 & 102.066661067544 & 0.673338932456485 \tabularnewline
33 & 112.63 & 109.300330533772 & 3.32966946622824 \tabularnewline
34 & 106.26 & 104.988208357727 & 1.27179164227322 \tabularnewline
35 & 108.86 & 108.601796441522 & 0.258203558478359 \tabularnewline
36 & 111.38 & 108.756898220761 & 2.62310177923918 \tabularnewline
37 & 106.85 & 107.438827959778 & -0.588827959777521 \tabularnewline
38 & 107.86 & 107.787177690543 & 0.07282230945697 \tabularnewline
39 & 107.94 & 107.445043516377 & 0.494956483622992 \tabularnewline
40 & 111.38 & 112.377972932253 & -0.997972932252565 \tabularnewline
41 & 111.29 & 112.098315464145 & -0.808315464145366 \tabularnewline
42 & 113.72 & 113.895953735259 & -0.175953735258875 \tabularnewline
43 & 111.88 & 113.372080710552 & -1.49208071055227 \tabularnewline
44 & 109.87 & 108.907867553577 & 0.962132446422937 \tabularnewline
45 & 113.72 & 114.259285468843 & -0.539285468842736 \tabularnewline
46 & 111.71 & 114.011115505103 & -2.30111550510333 \tabularnewline
47 & 114.81 & 111.977948936010 & 2.83205106398955 \tabularnewline
48 & 112.05 & 112.817505824691 & -0.767505824690569 \tabularnewline
49 & 111.54 & 111.670549341067 & -0.130549341067496 \tabularnewline
50 & 110.87 & 109.452192411429 & 1.41780758857051 \tabularnewline
51 & 110.87 & 112.446776895788 & -1.57677689578804 \tabularnewline
52 & 115.48 & 115.540233205041 & -0.0602332050410774 \tabularnewline
53 & 111.63 & 110.041605527447 & 1.58839447255325 \tabularnewline
54 & 116.24 & 114.405950458964 & 1.83404954103623 \tabularnewline
55 & 113.56 & 113.197622324816 & 0.362377675183779 \tabularnewline
56 & 106.01 & 106.551708506498 & -0.541708506498028 \tabularnewline
57 & 110.45 & 112.758695308565 & -2.30869530856487 \tabularnewline
58 & 107.77 & 108.788800687240 & -1.01880068724038 \tabularnewline
59 & 108.61 & 110.605694108753 & -1.99569410875277 \tabularnewline
60 & 108.19 & 111.958592329514 & -3.76859232951359 \tabularnewline
\hline
\end{tabular}
%Source: https://freestatistics.org/blog/index.php?pk=57839&T=4

[TABLE]
[ROW][C]Multiple Linear Regression - Actuals, Interpolation, and Residuals[/C][/ROW]
[ROW][C]Time or Index[/C][C]Actuals[/C][C]InterpolationForecast[/C][C]ResidualsPrediction Error[/C][/ROW]
[ROW][C]1[/C][C]96.96[/C][C]96.5831369225304[/C][C]0.376863077469554[/C][/ROW]
[ROW][C]2[/C][C]93.11[/C][C]94.7925644362927[/C][C]-1.68256443629265[/C][/ROW]
[ROW][C]3[/C][C]95.62[/C][C]97.2310291442304[/C][C]-1.61102914423043[/C][/ROW]
[ROW][C]4[/C][C]98.3[/C][C]98.1000063478004[/C][C]0.199993652199554[/C][/ROW]
[ROW][C]5[/C][C]96.38[/C][C]97.7775704353532[/C][C]-1.39757043535318[/C][/ROW]
[ROW][C]6[/C][C]100.82[/C][C]103.254154919712[/C][C]-2.43415491971174[/C][/ROW]
[ROW][C]7[/C][C]99.06[/C][C]98.7946650157197[/C][C]0.265334984280270[/C][/ROW]
[ROW][C]8[/C][C]94.03[/C][C]95.0576854125255[/C][C]-1.02768541252553[/C][/ROW]
[ROW][C]9[/C][C]102.07[/C][C]102.248576434414[/C][C]-0.178576434413718[/C][/ROW]
[ROW][C]10[/C][C]99.31[/C][C]99.519256698951[/C][C]-0.20925669895091[/C][/ROW]
[ROW][C]11[/C][C]98.64[/C][C]100.480581233662[/C][C]-1.84058123366214[/C][/ROW]
[ROW][C]12[/C][C]101.82[/C][C]101.961814787443[/C][C]-0.141814787443135[/C][/ROW]
[ROW][C]13[/C][C]99.14[/C][C]99.360391196258[/C][C]-0.220391196258066[/C][/ROW]
[ROW][C]14[/C][C]97.63[/C][C]98.8959504845625[/C][C]-1.26595048456249[/C][/ROW]
[ROW][C]15[/C][C]100.06[/C][C]100.093840306639[/C][C]-0.0338403066385519[/C][/ROW]
[ROW][C]16[/C][C]101.32[/C][C]100.449476178128[/C][C]0.870523821872151[/C][/ROW]
[ROW][C]17[/C][C]101.49[/C][C]101.880956483623[/C][C]-0.390956483623005[/C][/ROW]
[ROW][C]18[/C][C]105.43[/C][C]105.817516971739[/C][C]-0.387516971739418[/C][/ROW]
[ROW][C]19[/C][C]105.09[/C][C]104.694745726272[/C][C]0.395254273727996[/C][/ROW]
[ROW][C]20[/C][C]99.48[/C][C]99.5460774598559[/C][C]-0.0660774598558651[/C][/ROW]
[ROW][C]21[/C][C]108.53[/C][C]108.833112254407[/C][C]-0.303112254406920[/C][/ROW]
[ROW][C]22[/C][C]104.34[/C][C]102.082618750979[/C][C]2.25738124902139[/C][/ROW]
[ROW][C]23[/C][C]106.1[/C][C]105.353979280053[/C][C]0.746020719946994[/C][/ROW]
[ROW][C]24[/C][C]107.35[/C][C]105.295188837592[/C][C]2.05481116240811[/C][/ROW]
[ROW][C]25[/C][C]103[/C][C]102.437094580366[/C][C]0.562905419633528[/C][/ROW]
[ROW][C]26[/C][C]104.5[/C][C]103.042114977172[/C][C]1.45788502282766[/C][/ROW]
[ROW][C]27[/C][C]105.17[/C][C]102.443310136966[/C][C]2.72668986303404[/C][/ROW]
[ROW][C]28[/C][C]104.84[/C][C]104.852311336778[/C][C]-0.0123113367780628[/C][/ROW]
[ROW][C]29[/C][C]106.18[/C][C]105.171552089432[/C][C]1.00844791056831[/C][/ROW]
[ROW][C]30[/C][C]108.86[/C][C]107.696423914326[/C][C]1.16357608567380[/C][/ROW]
[ROW][C]31[/C][C]107.77[/C][C]107.300886222640[/C][C]0.469113777360228[/C][/ROW]
[ROW][C]32[/C][C]102.74[/C][C]102.066661067544[/C][C]0.673338932456485[/C][/ROW]
[ROW][C]33[/C][C]112.63[/C][C]109.300330533772[/C][C]3.32966946622824[/C][/ROW]
[ROW][C]34[/C][C]106.26[/C][C]104.988208357727[/C][C]1.27179164227322[/C][/ROW]
[ROW][C]35[/C][C]108.86[/C][C]108.601796441522[/C][C]0.258203558478359[/C][/ROW]
[ROW][C]36[/C][C]111.38[/C][C]108.756898220761[/C][C]2.62310177923918[/C][/ROW]
[ROW][C]37[/C][C]106.85[/C][C]107.438827959778[/C][C]-0.588827959777521[/C][/ROW]
[ROW][C]38[/C][C]107.86[/C][C]107.787177690543[/C][C]0.07282230945697[/C][/ROW]
[ROW][C]39[/C][C]107.94[/C][C]107.445043516377[/C][C]0.494956483622992[/C][/ROW]
[ROW][C]40[/C][C]111.38[/C][C]112.377972932253[/C][C]-0.997972932252565[/C][/ROW]
[ROW][C]41[/C][C]111.29[/C][C]112.098315464145[/C][C]-0.808315464145366[/C][/ROW]
[ROW][C]42[/C][C]113.72[/C][C]113.895953735259[/C][C]-0.175953735258875[/C][/ROW]
[ROW][C]43[/C][C]111.88[/C][C]113.372080710552[/C][C]-1.49208071055227[/C][/ROW]
[ROW][C]44[/C][C]109.87[/C][C]108.907867553577[/C][C]0.962132446422937[/C][/ROW]
[ROW][C]45[/C][C]113.72[/C][C]114.259285468843[/C][C]-0.539285468842736[/C][/ROW]
[ROW][C]46[/C][C]111.71[/C][C]114.011115505103[/C][C]-2.30111550510333[/C][/ROW]
[ROW][C]47[/C][C]114.81[/C][C]111.977948936010[/C][C]2.83205106398955[/C][/ROW]
[ROW][C]48[/C][C]112.05[/C][C]112.817505824691[/C][C]-0.767505824690569[/C][/ROW]
[ROW][C]49[/C][C]111.54[/C][C]111.670549341067[/C][C]-0.130549341067496[/C][/ROW]
[ROW][C]50[/C][C]110.87[/C][C]109.452192411429[/C][C]1.41780758857051[/C][/ROW]
[ROW][C]51[/C][C]110.87[/C][C]112.446776895788[/C][C]-1.57677689578804[/C][/ROW]
[ROW][C]52[/C][C]115.48[/C][C]115.540233205041[/C][C]-0.0602332050410774[/C][/ROW]
[ROW][C]53[/C][C]111.63[/C][C]110.041605527447[/C][C]1.58839447255325[/C][/ROW]
[ROW][C]54[/C][C]116.24[/C][C]114.405950458964[/C][C]1.83404954103623[/C][/ROW]
[ROW][C]55[/C][C]113.56[/C][C]113.197622324816[/C][C]0.362377675183779[/C][/ROW]
[ROW][C]56[/C][C]106.01[/C][C]106.551708506498[/C][C]-0.541708506498028[/C][/ROW]
[ROW][C]57[/C][C]110.45[/C][C]112.758695308565[/C][C]-2.30869530856487[/C][/ROW]
[ROW][C]58[/C][C]107.77[/C][C]108.788800687240[/C][C]-1.01880068724038[/C][/ROW]
[ROW][C]59[/C][C]108.61[/C][C]110.605694108753[/C][C]-1.99569410875277[/C][/ROW]
[ROW][C]60[/C][C]108.19[/C][C]111.958592329514[/C][C]-3.76859232951359[/C][/ROW]
[/TABLE]
Source: https://freestatistics.org/blog/index.php?pk=57839&T=4

Globally Unique Identifier (entire table): ba.freestatistics.org/blog/index.php?pk=57839&T=4

As an alternative you can also use a QR Code:  

The GUIDs for individual cells are displayed in the table below:

Multiple Linear Regression - Actuals, Interpolation, and Residuals
Time or IndexActualsInterpolationForecastResidualsPrediction Error
196.9696.58313692253040.376863077469554
293.1194.7925644362927-1.68256443629265
395.6297.2310291442304-1.61102914423043
498.398.10000634780040.199993652199554
596.3897.7775704353532-1.39757043535318
6100.82103.254154919712-2.43415491971174
799.0698.79466501571970.265334984280270
894.0395.0576854125255-1.02768541252553
9102.07102.248576434414-0.178576434413718
1099.3199.519256698951-0.20925669895091
1198.64100.480581233662-1.84058123366214
12101.82101.961814787443-0.141814787443135
1399.1499.360391196258-0.220391196258066
1497.6398.8959504845625-1.26595048456249
15100.06100.093840306639-0.0338403066385519
16101.32100.4494761781280.870523821872151
17101.49101.880956483623-0.390956483623005
18105.43105.817516971739-0.387516971739418
19105.09104.6947457262720.395254273727996
2099.4899.5460774598559-0.0660774598558651
21108.53108.833112254407-0.303112254406920
22104.34102.0826187509792.25738124902139
23106.1105.3539792800530.746020719946994
24107.35105.2951888375922.05481116240811
25103102.4370945803660.562905419633528
26104.5103.0421149771721.45788502282766
27105.17102.4433101369662.72668986303404
28104.84104.852311336778-0.0123113367780628
29106.18105.1715520894321.00844791056831
30108.86107.6964239143261.16357608567380
31107.77107.3008862226400.469113777360228
32102.74102.0666610675440.673338932456485
33112.63109.3003305337723.32966946622824
34106.26104.9882083577271.27179164227322
35108.86108.6017964415220.258203558478359
36111.38108.7568982207612.62310177923918
37106.85107.438827959778-0.588827959777521
38107.86107.7871776905430.07282230945697
39107.94107.4450435163770.494956483622992
40111.38112.377972932253-0.997972932252565
41111.29112.098315464145-0.808315464145366
42113.72113.895953735259-0.175953735258875
43111.88113.372080710552-1.49208071055227
44109.87108.9078675535770.962132446422937
45113.72114.259285468843-0.539285468842736
46111.71114.011115505103-2.30111550510333
47114.81111.9779489360102.83205106398955
48112.05112.817505824691-0.767505824690569
49111.54111.670549341067-0.130549341067496
50110.87109.4521924114291.41780758857051
51110.87112.446776895788-1.57677689578804
52115.48115.540233205041-0.0602332050410774
53111.63110.0416055274471.58839447255325
54116.24114.4059504589641.83404954103623
55113.56113.1976223248160.362377675183779
56106.01106.551708506498-0.541708506498028
57110.45112.758695308565-2.30869530856487
58107.77108.788800687240-1.01880068724038
59108.61110.605694108753-1.99569410875277
60108.19111.958592329514-3.76859232951359


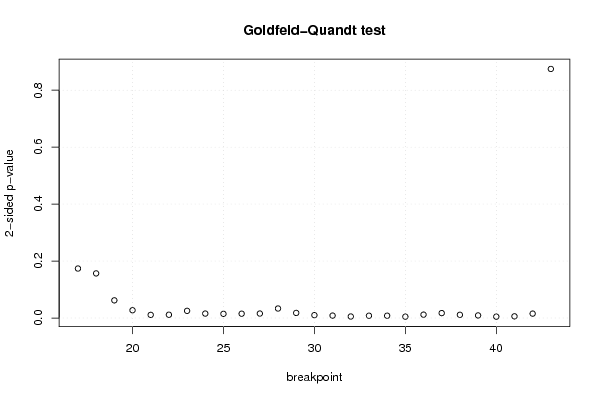
Goldfeld-Quandt test for Heteroskedasticity
p-valuesAlternative Hypothesis
breakpoint indexgreater2-sidedless
170.0869030406188020.1738060812376040.913096959381198
180.07834266571052380.1566853314210480.921657334289476
190.03103037082438890.06206074164877780.968969629175611
200.01364837021713860.02729674043427710.986351629782861
210.005539476710038390.01107895342007680.994460523289962
220.005746331525354740.01149266305070950.994253668474645
230.01260754135824260.02521508271648520.987392458641757
240.007827691978542960.01565538395708590.992172308021457
250.007361787037635360.01472357407527070.992638212962365
260.007601226789880740.01520245357976150.99239877321012
270.007858276336502940.01571655267300590.992141723663497
280.01671054560138640.03342109120277280.983289454398614
290.00893079384983180.01786158769966360.991069206150168
300.005049866869679540.01009973373935910.99495013313032
310.004273205586365130.008546411172730260.995726794413635
320.002672300167238020.005344600334476040.997327699832762
330.004009076053118830.008018152106237660.995990923946881
340.004022634395092210.008045268790184430.995977365604908
350.002439665536715520.004879331073431050.997560334463284
360.005903043488199930.01180608697639990.9940969565118
370.008667942362427950.01733588472485590.991332057637572
380.005646583997926170.01129316799585230.994353416002074
390.004575504889403450.00915100977880690.995424495110597
400.00241013807944340.00482027615888680.997589861920557
410.002992130525349130.005984261050698270.99700786947465
420.007738855836755920.01547771167351180.992261144163244
430.4372903483645740.8745806967291490.562709651635426

\begin{tabular}{lllllllll}
\hline
Goldfeld-Quandt test for Heteroskedasticity \tabularnewline
p-values & Alternative Hypothesis \tabularnewline
breakpoint index & greater & 2-sided & less \tabularnewline
17 & 0.086903040618802 & 0.173806081237604 & 0.913096959381198 \tabularnewline
18 & 0.0783426657105238 & 0.156685331421048 & 0.921657334289476 \tabularnewline
19 & 0.0310303708243889 & 0.0620607416487778 & 0.968969629175611 \tabularnewline
20 & 0.0136483702171386 & 0.0272967404342771 & 0.986351629782861 \tabularnewline
21 & 0.00553947671003839 & 0.0110789534200768 & 0.994460523289962 \tabularnewline
22 & 0.00574633152535474 & 0.0114926630507095 & 0.994253668474645 \tabularnewline
23 & 0.0126075413582426 & 0.0252150827164852 & 0.987392458641757 \tabularnewline
24 & 0.00782769197854296 & 0.0156553839570859 & 0.992172308021457 \tabularnewline
25 & 0.00736178703763536 & 0.0147235740752707 & 0.992638212962365 \tabularnewline
26 & 0.00760122678988074 & 0.0152024535797615 & 0.99239877321012 \tabularnewline
27 & 0.00785827633650294 & 0.0157165526730059 & 0.992141723663497 \tabularnewline
28 & 0.0167105456013864 & 0.0334210912027728 & 0.983289454398614 \tabularnewline
29 & 0.0089307938498318 & 0.0178615876996636 & 0.991069206150168 \tabularnewline
30 & 0.00504986686967954 & 0.0100997337393591 & 0.99495013313032 \tabularnewline
31 & 0.00427320558636513 & 0.00854641117273026 & 0.995726794413635 \tabularnewline
32 & 0.00267230016723802 & 0.00534460033447604 & 0.997327699832762 \tabularnewline
33 & 0.00400907605311883 & 0.00801815210623766 & 0.995990923946881 \tabularnewline
34 & 0.00402263439509221 & 0.00804526879018443 & 0.995977365604908 \tabularnewline
35 & 0.00243966553671552 & 0.00487933107343105 & 0.997560334463284 \tabularnewline
36 & 0.00590304348819993 & 0.0118060869763999 & 0.9940969565118 \tabularnewline
37 & 0.00866794236242795 & 0.0173358847248559 & 0.991332057637572 \tabularnewline
38 & 0.00564658399792617 & 0.0112931679958523 & 0.994353416002074 \tabularnewline
39 & 0.00457550488940345 & 0.0091510097788069 & 0.995424495110597 \tabularnewline
40 & 0.0024101380794434 & 0.0048202761588868 & 0.997589861920557 \tabularnewline
41 & 0.00299213052534913 & 0.00598426105069827 & 0.99700786947465 \tabularnewline
42 & 0.00773885583675592 & 0.0154777116735118 & 0.992261144163244 \tabularnewline
43 & 0.437290348364574 & 0.874580696729149 & 0.562709651635426 \tabularnewline
\hline
\end{tabular}
%Source: https://freestatistics.org/blog/index.php?pk=57839&T=5

[TABLE]
[ROW][C]Goldfeld-Quandt test for Heteroskedasticity[/C][/ROW]
[ROW][C]p-values[/C][C]Alternative Hypothesis[/C][/ROW]
[ROW][C]breakpoint index[/C][C]greater[/C][C]2-sided[/C][C]less[/C][/ROW]
[ROW][C]17[/C][C]0.086903040618802[/C][C]0.173806081237604[/C][C]0.913096959381198[/C][/ROW]
[ROW][C]18[/C][C]0.0783426657105238[/C][C]0.156685331421048[/C][C]0.921657334289476[/C][/ROW]
[ROW][C]19[/C][C]0.0310303708243889[/C][C]0.0620607416487778[/C][C]0.968969629175611[/C][/ROW]
[ROW][C]20[/C][C]0.0136483702171386[/C][C]0.0272967404342771[/C][C]0.986351629782861[/C][/ROW]
[ROW][C]21[/C][C]0.00553947671003839[/C][C]0.0110789534200768[/C][C]0.994460523289962[/C][/ROW]
[ROW][C]22[/C][C]0.00574633152535474[/C][C]0.0114926630507095[/C][C]0.994253668474645[/C][/ROW]
[ROW][C]23[/C][C]0.0126075413582426[/C][C]0.0252150827164852[/C][C]0.987392458641757[/C][/ROW]
[ROW][C]24[/C][C]0.00782769197854296[/C][C]0.0156553839570859[/C][C]0.992172308021457[/C][/ROW]
[ROW][C]25[/C][C]0.00736178703763536[/C][C]0.0147235740752707[/C][C]0.992638212962365[/C][/ROW]
[ROW][C]26[/C][C]0.00760122678988074[/C][C]0.0152024535797615[/C][C]0.99239877321012[/C][/ROW]
[ROW][C]27[/C][C]0.00785827633650294[/C][C]0.0157165526730059[/C][C]0.992141723663497[/C][/ROW]
[ROW][C]28[/C][C]0.0167105456013864[/C][C]0.0334210912027728[/C][C]0.983289454398614[/C][/ROW]
[ROW][C]29[/C][C]0.0089307938498318[/C][C]0.0178615876996636[/C][C]0.991069206150168[/C][/ROW]
[ROW][C]30[/C][C]0.00504986686967954[/C][C]0.0100997337393591[/C][C]0.99495013313032[/C][/ROW]
[ROW][C]31[/C][C]0.00427320558636513[/C][C]0.00854641117273026[/C][C]0.995726794413635[/C][/ROW]
[ROW][C]32[/C][C]0.00267230016723802[/C][C]0.00534460033447604[/C][C]0.997327699832762[/C][/ROW]
[ROW][C]33[/C][C]0.00400907605311883[/C][C]0.00801815210623766[/C][C]0.995990923946881[/C][/ROW]
[ROW][C]34[/C][C]0.00402263439509221[/C][C]0.00804526879018443[/C][C]0.995977365604908[/C][/ROW]
[ROW][C]35[/C][C]0.00243966553671552[/C][C]0.00487933107343105[/C][C]0.997560334463284[/C][/ROW]
[ROW][C]36[/C][C]0.00590304348819993[/C][C]0.0118060869763999[/C][C]0.9940969565118[/C][/ROW]
[ROW][C]37[/C][C]0.00866794236242795[/C][C]0.0173358847248559[/C][C]0.991332057637572[/C][/ROW]
[ROW][C]38[/C][C]0.00564658399792617[/C][C]0.0112931679958523[/C][C]0.994353416002074[/C][/ROW]
[ROW][C]39[/C][C]0.00457550488940345[/C][C]0.0091510097788069[/C][C]0.995424495110597[/C][/ROW]
[ROW][C]40[/C][C]0.0024101380794434[/C][C]0.0048202761588868[/C][C]0.997589861920557[/C][/ROW]
[ROW][C]41[/C][C]0.00299213052534913[/C][C]0.00598426105069827[/C][C]0.99700786947465[/C][/ROW]
[ROW][C]42[/C][C]0.00773885583675592[/C][C]0.0154777116735118[/C][C]0.992261144163244[/C][/ROW]
[ROW][C]43[/C][C]0.437290348364574[/C][C]0.874580696729149[/C][C]0.562709651635426[/C][/ROW]
[/TABLE]
Source: https://freestatistics.org/blog/index.php?pk=57839&T=5

Globally Unique Identifier (entire table): ba.freestatistics.org/blog/index.php?pk=57839&T=5

As an alternative you can also use a QR Code:  

The GUIDs for individual cells are displayed in the table below:

Goldfeld-Quandt test for Heteroskedasticity
p-valuesAlternative Hypothesis
breakpoint indexgreater2-sidedless
170.0869030406188020.1738060812376040.913096959381198
180.07834266571052380.1566853314210480.921657334289476
190.03103037082438890.06206074164877780.968969629175611
200.01364837021713860.02729674043427710.986351629782861
210.005539476710038390.01107895342007680.994460523289962
220.005746331525354740.01149266305070950.994253668474645
230.01260754135824260.02521508271648520.987392458641757
240.007827691978542960.01565538395708590.992172308021457
250.007361787037635360.01472357407527070.992638212962365
260.007601226789880740.01520245357976150.99239877321012
270.007858276336502940.01571655267300590.992141723663497
280.01671054560138640.03342109120277280.983289454398614
290.00893079384983180.01786158769966360.991069206150168
300.005049866869679540.01009973373935910.99495013313032
310.004273205586365130.008546411172730260.995726794413635
320.002672300167238020.005344600334476040.997327699832762
330.004009076053118830.008018152106237660.995990923946881
340.004022634395092210.008045268790184430.995977365604908
350.002439665536715520.004879331073431050.997560334463284
360.005903043488199930.01180608697639990.9940969565118
370.008667942362427950.01733588472485590.991332057637572
380.005646583997926170.01129316799585230.994353416002074
390.004575504889403450.00915100977880690.995424495110597
400.00241013807944340.00482027615888680.997589861920557
410.002992130525349130.005984261050698270.99700786947465
420.007738855836755920.01547771167351180.992261144163244
430.4372903483645740.8745806967291490.562709651635426


Meta Analysis of Goldfeld-Quandt test for Heteroskedasticity
Description# significant tests% significant testsOK/NOK
1% type I error level80.296296296296296NOK
5% type I error level230.851851851851852NOK
10% type I error level240.888888888888889NOK

\begin{tabular}{lllllllll}
\hline
Meta Analysis of Goldfeld-Quandt test for Heteroskedasticity \tabularnewline
Description & # significant tests & % significant tests & OK/NOK \tabularnewline
1% type I error level & 8 & 0.296296296296296 & NOK \tabularnewline
5% type I error level & 23 & 0.851851851851852 & NOK \tabularnewline
10% type I error level & 24 & 0.888888888888889 & NOK \tabularnewline
\hline
\end{tabular}
%Source: https://freestatistics.org/blog/index.php?pk=57839&T=6

[TABLE]
[ROW][C]Meta Analysis of Goldfeld-Quandt test for Heteroskedasticity[/C][/ROW]
[ROW][C]Description[/C][C]# significant tests[/C][C]% significant tests[/C][C]OK/NOK[/C][/ROW]
[ROW][C]1% type I error level[/C][C]8[/C][C]0.296296296296296[/C][C]NOK[/C][/ROW]
[ROW][C]5% type I error level[/C][C]23[/C][C]0.851851851851852[/C][C]NOK[/C][/ROW]
[ROW][C]10% type I error level[/C][C]24[/C][C]0.888888888888889[/C][C]NOK[/C][/ROW]
[/TABLE]
Source: https://freestatistics.org/blog/index.php?pk=57839&T=6

Globally Unique Identifier (entire table): ba.freestatistics.org/blog/index.php?pk=57839&T=6

As an alternative you can also use a QR Code:  

The GUIDs for individual cells are displayed in the table below:

Meta Analysis of Goldfeld-Quandt test for Heteroskedasticity
Description# significant tests% significant testsOK/NOK
1% type I error level80.296296296296296NOK
5% type I error level230.851851851851852NOK
10% type I error level240.888888888888889NOK


Parameters (Session):
par1 = 1 ; par2 = Include Monthly Dummies ; par3 = Linear Trend ;
Parameters (R input):
par1 = 1 ; par2 = Include Monthly Dummies ; par3 = Linear Trend ;
R code (references can be found in the software module):
library(lattice)
library(lmtest)
n25 <- 25 #minimum number of obs. for Goldfeld-Quandt test
par1 <- as.numeric(par1)
x <- t(y)
k <- length(x[1,])
n <- length(x[,1])
x1 <- cbind(x[,par1], x[,1:k!=par1])
mycolnames <- c(colnames(x)[par1], colnames(x)[1:k!=par1])
colnames(x1) <- mycolnames #colnames(x)[par1]
x <- x1
if (par3 == 'First Differences'){
x2 <- array(0, dim=c(n-1,k), dimnames=list(1:(n-1), paste('(1-B)',colnames(x),sep='')))
for (i in 1:n-1) {
for (j in 1:k) {
x2[i,j] <- x[i+1,j] - x[i,j]
}
}
x <- x2
}
if (par2 == 'Include Monthly Dummies'){
x2 <- array(0, dim=c(n,11), dimnames=list(1:n, paste('M', seq(1:11), sep ='')))
for (i in 1:11){
x2[seq(i,n,12),i] <- 1
}
x <- cbind(x, x2)
}
if (par2 == 'Include Quarterly Dummies'){
x2 <- array(0, dim=c(n,3), dimnames=list(1:n, paste('Q', seq(1:3), sep ='')))
for (i in 1:3){
x2[seq(i,n,4),i] <- 1
}
x <- cbind(x, x2)
}
k <- length(x[1,])
if (par3 == 'Linear Trend'){
x <- cbind(x, c(1:n))
colnames(x)[k+1] <- 't'
}
x
k <- length(x[1,])
df <- as.data.frame(x)
(mylm <- lm(df))
(mysum <- summary(mylm))
if (n > n25) {
kp3 <- k + 3
nmkm3 <- n - k - 3
gqarr <- array(NA, dim=c(nmkm3-kp3+1,3))
numgqtests <- 0
numsignificant1 <- 0
numsignificant5 <- 0
numsignificant10 <- 0
for (mypoint in kp3:nmkm3) {
j <- 0
numgqtests <- numgqtests + 1
for (myalt in c('greater', 'two.sided', 'less')) {
j <- j + 1
gqarr[mypoint-kp3+1,j] <- gqtest(mylm, point=mypoint, alternative=myalt)$p.value
}
if (gqarr[mypoint-kp3+1,2] < 0.01) numsignificant1 <- numsignificant1 + 1
if (gqarr[mypoint-kp3+1,2] < 0.05) numsignificant5 <- numsignificant5 + 1
if (gqarr[mypoint-kp3+1,2] < 0.10) numsignificant10 <- numsignificant10 + 1
}
gqarr
}
bitmap(file='test0.png')
plot(x[,1], type='l', main='Actuals and Interpolation', ylab='value of Actuals and Interpolation (dots)', xlab='time or index')
points(x[,1]-mysum$resid)
grid()
dev.off()
bitmap(file='test1.png')
plot(mysum$resid, type='b', pch=19, main='Residuals', ylab='value of Residuals', xlab='time or index')
grid()
dev.off()
bitmap(file='test2.png')
hist(mysum$resid, main='Residual Histogram', xlab='values of Residuals')
grid()
dev.off()
bitmap(file='test3.png')
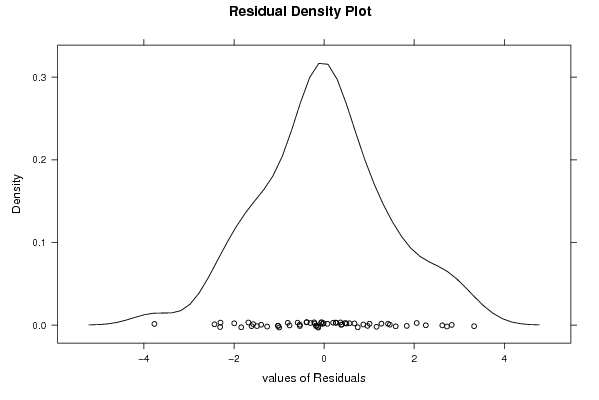
densityplot(~mysum$resid,col='black',main='Residual Density Plot', xlab='values of Residuals')
dev.off()
bitmap(file='test4.png')
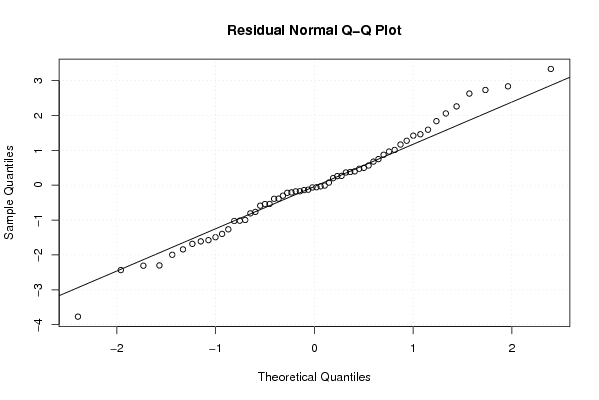
qqnorm(mysum$resid, main='Residual Normal Q-Q Plot')
qqline(mysum$resid)
grid()
dev.off()
(myerror <- as.ts(mysum$resid))
bitmap(file='test5.png')
dum <- cbind(lag(myerror,k=1),myerror)
dum
dum1 <- dum[2:length(myerror),]
dum1
z <- as.data.frame(dum1)
z
plot(z,main=paste('Residual Lag plot, lowess, and regression line'), ylab='values of Residuals', xlab='lagged values of Residuals')
lines(lowess(z))
abline(lm(z))
grid()
dev.off()
bitmap(file='test6.png')
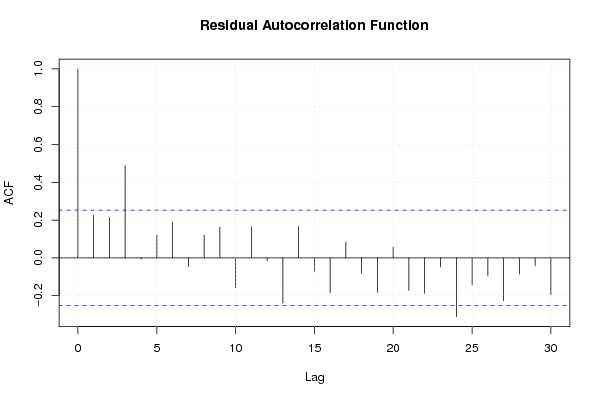
acf(mysum$resid, lag.max=length(mysum$resid)/2, main='Residual Autocorrelation Function')
grid()
dev.off()
bitmap(file='test7.png')
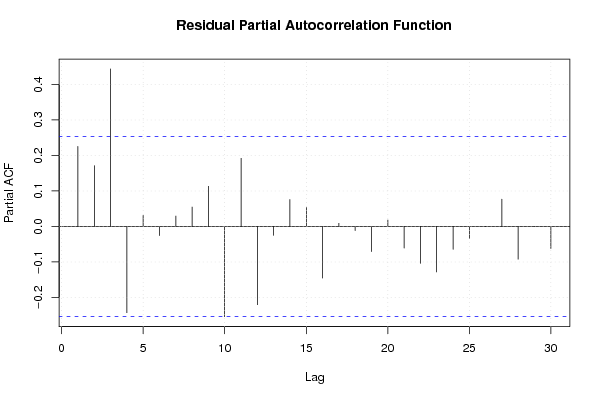
pacf(mysum$resid, lag.max=length(mysum$resid)/2, main='Residual Partial Autocorrelation Function')
grid()
dev.off()
bitmap(file='test8.png')
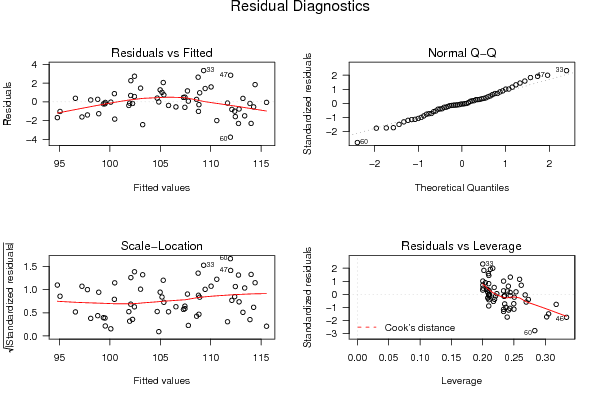
opar <- par(mfrow = c(2,2), oma = c(0, 0, 1.1, 0))
plot(mylm, las = 1, sub='Residual Diagnostics')
par(opar)
dev.off()
if (n > n25) {
bitmap(file='test9.png')
plot(kp3:nmkm3,gqarr[,2], main='Goldfeld-Quandt test',ylab='2-sided p-value',xlab='breakpoint')
grid()
dev.off()
}
load(file='createtable')
a<-table.start()
a<-table.row.start(a)
a<-table.element(a, 'Multiple Linear Regression - Estimated Regression Equation', 1, TRUE)
a<-table.row.end(a)
myeq <- colnames(x)[1]
myeq <- paste(myeq, '[t] = ', sep='')
for (i in 1:k){
if (mysum$coefficients[i,1] > 0) myeq <- paste(myeq, '+', '')
myeq <- paste(myeq, mysum$coefficients[i,1], sep=' ')
if (rownames(mysum$coefficients)[i] != '(Intercept)') {
myeq <- paste(myeq, rownames(mysum$coefficients)[i], sep='')
if (rownames(mysum$coefficients)[i] != 't') myeq <- paste(myeq, '[t]', sep='')
}
}
myeq <- paste(myeq, ' + e[t]')
a<-table.row.start(a)
a<-table.element(a, myeq)
a<-table.row.end(a)
a<-table.end(a)
table.save(a,file='mytable1.tab')
a<-table.start()
a<-table.row.start(a)
a<-table.element(a,hyperlink('ols1.htm','Multiple Linear Regression - Ordinary Least Squares',''), 6, TRUE)
a<-table.row.end(a)
a<-table.row.start(a)
a<-table.element(a,'Variable',header=TRUE)
a<-table.element(a,'Parameter',header=TRUE)
a<-table.element(a,'S.D.',header=TRUE)
a<-table.element(a,'T-STAT
H0: parameter = 0',header=TRUE)
a<-table.element(a,'2-tail p-value',header=TRUE)
a<-table.element(a,'1-tail p-value',header=TRUE)
a<-table.row.end(a)
for (i in 1:k){
a<-table.row.start(a)
a<-table.element(a,rownames(mysum$coefficients)[i],header=TRUE)
a<-table.element(a,mysum$coefficients[i,1])
a<-table.element(a, round(mysum$coefficients[i,2],6))
a<-table.element(a, round(mysum$coefficients[i,3],4))
a<-table.element(a, round(mysum$coefficients[i,4],6))
a<-table.element(a, round(mysum$coefficients[i,4]/2,6))
a<-table.row.end(a)
}
a<-table.end(a)
table.save(a,file='mytable2.tab')
a<-table.start()
a<-table.row.start(a)
a<-table.element(a, 'Multiple Linear Regression - Regression Statistics', 2, TRUE)
a<-table.row.end(a)
a<-table.row.start(a)
a<-table.element(a, 'Multiple R',1,TRUE)
a<-table.element(a, sqrt(mysum$r.squared))
a<-table.row.end(a)
a<-table.row.start(a)
a<-table.element(a, 'R-squared',1,TRUE)
a<-table.element(a, mysum$r.squared)
a<-table.row.end(a)
a<-table.row.start(a)
a<-table.element(a, 'Adjusted R-squared',1,TRUE)
a<-table.element(a, mysum$adj.r.squared)
a<-table.row.end(a)
a<-table.row.start(a)
a<-table.element(a, 'F-TEST (value)',1,TRUE)
a<-table.element(a, mysum$fstatistic[1])
a<-table.row.end(a)
a<-table.row.start(a)
a<-table.element(a, 'F-TEST (DF numerator)',1,TRUE)
a<-table.element(a, mysum$fstatistic[2])
a<-table.row.end(a)
a<-table.row.start(a)
a<-table.element(a, 'F-TEST (DF denominator)',1,TRUE)
a<-table.element(a, mysum$fstatistic[3])
a<-table.row.end(a)
a<-table.row.start(a)
a<-table.element(a, 'p-value',1,TRUE)
a<-table.element(a, 1-pf(mysum$fstatistic[1],mysum$fstatistic[2],mysum$fstatistic[3]))
a<-table.row.end(a)
a<-table.row.start(a)
a<-table.element(a, 'Multiple Linear Regression - Residual Statistics', 2, TRUE)
a<-table.row.end(a)
a<-table.row.start(a)
a<-table.element(a, 'Residual Standard Deviation',1,TRUE)
a<-table.element(a, mysum$sigma)
a<-table.row.end(a)
a<-table.row.start(a)
a<-table.element(a, 'Sum Squared Residuals',1,TRUE)
a<-table.element(a, sum(myerror*myerror))
a<-table.row.end(a)
a<-table.end(a)
table.save(a,file='mytable3.tab')
a<-table.start()
a<-table.row.start(a)
a<-table.element(a, 'Multiple Linear Regression - Actuals, Interpolation, and Residuals', 4, TRUE)
a<-table.row.end(a)
a<-table.row.start(a)
a<-table.element(a, 'Time or Index', 1, TRUE)
a<-table.element(a, 'Actuals', 1, TRUE)
a<-table.element(a, 'Interpolation
Forecast', 1, TRUE)
a<-table.element(a, 'Residuals
Prediction Error', 1, TRUE)
a<-table.row.end(a)
for (i in 1:n) {
a<-table.row.start(a)
a<-table.element(a,i, 1, TRUE)
a<-table.element(a,x[i])
a<-table.element(a,x[i]-mysum$resid[i])
a<-table.element(a,mysum$resid[i])
a<-table.row.end(a)
}
a<-table.end(a)
table.save(a,file='mytable4.tab')
if (n > n25) {
a<-table.start()
a<-table.row.start(a)
a<-table.element(a,'Goldfeld-Quandt test for Heteroskedasticity',4,TRUE)
a<-table.row.end(a)
a<-table.row.start(a)
a<-table.element(a,'p-values',header=TRUE)
a<-table.element(a,'Alternative Hypothesis',3,header=TRUE)
a<-table.row.end(a)
a<-table.row.start(a)
a<-table.element(a,'breakpoint index',header=TRUE)
a<-table.element(a,'greater',header=TRUE)
a<-table.element(a,'2-sided',header=TRUE)
a<-table.element(a,'less',header=TRUE)
a<-table.row.end(a)
for (mypoint in kp3:nmkm3) {
a<-table.row.start(a)
a<-table.element(a,mypoint,header=TRUE)
a<-table.element(a,gqarr[mypoint-kp3+1,1])
a<-table.element(a,gqarr[mypoint-kp3+1,2])
a<-table.element(a,gqarr[mypoint-kp3+1,3])
a<-table.row.end(a)
}
a<-table.end(a)
table.save(a,file='mytable5.tab')
a<-table.start()
a<-table.row.start(a)
a<-table.element(a,'Meta Analysis of Goldfeld-Quandt test for Heteroskedasticity',4,TRUE)
a<-table.row.end(a)
a<-table.row.start(a)
a<-table.element(a,'Description',header=TRUE)
a<-table.element(a,'# significant tests',header=TRUE)
a<-table.element(a,'% significant tests',header=TRUE)
a<-table.element(a,'OK/NOK',header=TRUE)
a<-table.row.end(a)
a<-table.row.start(a)
a<-table.element(a,'1% type I error level',header=TRUE)
a<-table.element(a,numsignificant1)
a<-table.element(a,numsignificant1/numgqtests)
if (numsignificant1/numgqtests < 0.01) dum <- 'OK' else dum <- 'NOK'
a<-table.element(a,dum)
a<-table.row.end(a)
a<-table.row.start(a)
a<-table.element(a,'5% type I error level',header=TRUE)
a<-table.element(a,numsignificant5)
a<-table.element(a,numsignificant5/numgqtests)
if (numsignificant5/numgqtests < 0.05) dum <- 'OK' else dum <- 'NOK'
a<-table.element(a,dum)
a<-table.row.end(a)
a<-table.row.start(a)
a<-table.element(a,'10% type I error level',header=TRUE)
a<-table.element(a,numsignificant10)
a<-table.element(a,numsignificant10/numgqtests)
if (numsignificant10/numgqtests < 0.1) dum <- 'OK' else dum <- 'NOK'
a<-table.element(a,dum)
a<-table.row.end(a)
a<-table.end(a)
table.save(a,file='mytable6.tab')
}