Free Statistics

of Irreproducible Research!

Author's title

Author*The author of this computation has been verified*
R Software Modulerwasp_autocorrelation.wasp
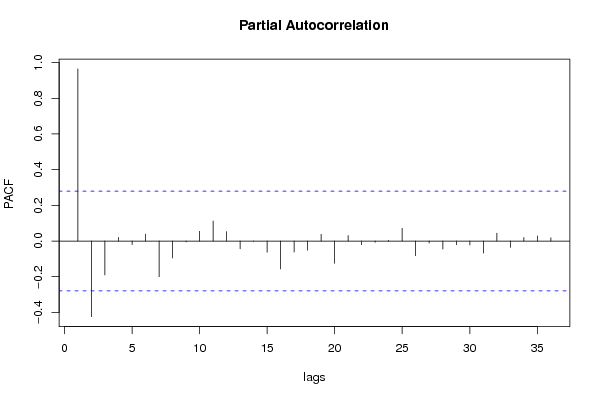
Title produced by software(Partial) Autocorrelation Function
Date of computationWed, 25 Nov 2009 08:43:27 -0700
Cite this page as followsStatistical Computations at FreeStatistics.org, Office for Research Development and Education, URL https://freestatistics.org/blog/index.php?v=date/2009/Nov/25/t1259163897i3vdpvnn8ynakem.htm/, Retrieved Tue, 07 May 2024 21:18:17 +0000
Statistical Computations at FreeStatistics.org, Office for Research Development and Education, URL https://freestatistics.org/blog/index.php?pk=59402, Retrieved Tue, 07 May 2024 21:18:17 +0000
QR Codes:

Original text written by user:
IsPrivate?No (this computation is public)
User-defined keywords
Estimated Impact153
Family? (F = Feedback message, R = changed R code, M = changed R Module, P = changed Parameters, D = changed Data)
-     [Univariate Explorative Data Analysis] [Run Sequence gebo...] [2008-12-12 13:32:37] [76963dc1903f0f612b6153510a3818cf]
- R  D  [Univariate Explorative Data Analysis] [Run Sequence gebo...] [2008-12-17 12:14:40] [76963dc1903f0f612b6153510a3818cf]
-         [Univariate Explorative Data Analysis] [Run Sequence Plot...] [2008-12-22 18:19:51] [1ce0d16c8f4225c977b42c8fa93bc163]
- RMP       [(Partial) Autocorrelation Function] [Identifying Integ...] [2009-11-22 12:19:56] [b98453cac15ba1066b407e146608df68]
-   PD          [(Partial) Autocorrelation Function] [ACF(2)] [2009-11-25 15:43:27] [a93df6747c5c78315f2ee9914aea3ec6] [Current]
Feedback Forum

Post a new message
Dataseries X:
2.085
2.053
2.077
2.058
2.057
2.076
2.07
2.062
2.073
2.061
2.094
2.067
2.086
2.276
2.326
2.349
2.52
2.628
2.577
2.698
2.814
2.968
3.041
3.278
3.328
3.5
3.563
3.569
3.69
3.819
3.79
3.956
4.063
4.047
4.029
3.941
4.022
3.879
4.022
4.028
4.091
3.987
4.01
4.007
4.191
4.299
4.273
3.82
3.15
2.486
1.812
1.257
1.062
0.842
0.782
0.698
0.358
0.347
0.363
0.359
0.355


Summary of computational transaction
Raw Inputview raw input (R code)
Raw Outputview raw output of R engine
Computing time1 seconds
R Server'Gwilym Jenkins' @ 72.249.127.135

\begin{tabular}{lllllllll}
\hline
Summary of computational transaction \tabularnewline
Raw Input & view raw input (R code)  \tabularnewline
Raw Output & view raw output of R engine  \tabularnewline
Computing time & 1 seconds \tabularnewline
R Server & 'Gwilym Jenkins' @ 72.249.127.135 \tabularnewline
\hline
\end{tabular}
%Source: https://freestatistics.org/blog/index.php?pk=59402&T=0

[TABLE]
[ROW][C]Summary of computational transaction[/C][/ROW]
[ROW][C]Raw Input[/C][C]view raw input (R code) [/C][/ROW]
[ROW][C]Raw Output[/C][C]view raw output of R engine [/C][/ROW]
[ROW][C]Computing time[/C][C]1 seconds[/C][/ROW]
[ROW][C]R Server[/C][C]'Gwilym Jenkins' @ 72.249.127.135[/C][/ROW]
[/TABLE]
Source: https://freestatistics.org/blog/index.php?pk=59402&T=0

Globally Unique Identifier (entire table): ba.freestatistics.org/blog/index.php?pk=59402&T=0

As an alternative you can also use a QR Code:  

The GUIDs for individual cells are displayed in the table below:

Summary of computational transaction
Raw Inputview raw input (R code)
Raw Outputview raw output of R engine
Computing time1 seconds
R Server'Gwilym Jenkins' @ 72.249.127.135


Autocorrelation Function
Time lag kACF(k)T-STATP-value
10.9644276.7510
20.9004886.30340
30.8168615.7180
40.7270595.08943e-06
50.6359624.45172.5e-05
60.5507513.85530.000169
70.461913.23340.001096
80.3702592.59180.006273
90.2781431.9470.028639
100.1923451.34640.092182
110.1203820.84270.201754
120.0664960.46550.321828
130.0263470.18440.427219
14-0.002434-0.0170.493238
15-0.027153-0.19010.42502
16-0.056788-0.39750.346356
17-0.090728-0.63510.26416
18-0.126771-0.88740.189601
19-0.159032-1.11320.135522
20-0.192058-1.34440.092504
21-0.21991-1.53940.065074
22-0.24726-1.73080.044888
23-0.274083-1.91860.030437
24-0.301159-2.10810.02008
25-0.320459-2.24320.014719
26-0.336135-2.35290.011342
27-0.343259-2.40280.010051
28-0.344574-2.4120.009827
29-0.339903-2.37930.010642
30-0.332598-2.32820.012037
31-0.32405-2.26830.013875
32-0.313229-2.19260.016557
33-0.300618-2.10430.020252
34-0.284569-1.9920.02598
35-0.265412-1.85790.034599
36-0.242677-1.69870.047855

\begin{tabular}{lllllllll}
\hline
Autocorrelation Function \tabularnewline
Time lag k & ACF(k) & T-STAT & P-value \tabularnewline
1 & 0.964427 & 6.751 & 0 \tabularnewline
2 & 0.900488 & 6.3034 & 0 \tabularnewline
3 & 0.816861 & 5.718 & 0 \tabularnewline
4 & 0.727059 & 5.0894 & 3e-06 \tabularnewline
5 & 0.635962 & 4.4517 & 2.5e-05 \tabularnewline
6 & 0.550751 & 3.8553 & 0.000169 \tabularnewline
7 & 0.46191 & 3.2334 & 0.001096 \tabularnewline
8 & 0.370259 & 2.5918 & 0.006273 \tabularnewline
9 & 0.278143 & 1.947 & 0.028639 \tabularnewline
10 & 0.192345 & 1.3464 & 0.092182 \tabularnewline
11 & 0.120382 & 0.8427 & 0.201754 \tabularnewline
12 & 0.066496 & 0.4655 & 0.321828 \tabularnewline
13 & 0.026347 & 0.1844 & 0.427219 \tabularnewline
14 & -0.002434 & -0.017 & 0.493238 \tabularnewline
15 & -0.027153 & -0.1901 & 0.42502 \tabularnewline
16 & -0.056788 & -0.3975 & 0.346356 \tabularnewline
17 & -0.090728 & -0.6351 & 0.26416 \tabularnewline
18 & -0.126771 & -0.8874 & 0.189601 \tabularnewline
19 & -0.159032 & -1.1132 & 0.135522 \tabularnewline
20 & -0.192058 & -1.3444 & 0.092504 \tabularnewline
21 & -0.21991 & -1.5394 & 0.065074 \tabularnewline
22 & -0.24726 & -1.7308 & 0.044888 \tabularnewline
23 & -0.274083 & -1.9186 & 0.030437 \tabularnewline
24 & -0.301159 & -2.1081 & 0.02008 \tabularnewline
25 & -0.320459 & -2.2432 & 0.014719 \tabularnewline
26 & -0.336135 & -2.3529 & 0.011342 \tabularnewline
27 & -0.343259 & -2.4028 & 0.010051 \tabularnewline
28 & -0.344574 & -2.412 & 0.009827 \tabularnewline
29 & -0.339903 & -2.3793 & 0.010642 \tabularnewline
30 & -0.332598 & -2.3282 & 0.012037 \tabularnewline
31 & -0.32405 & -2.2683 & 0.013875 \tabularnewline
32 & -0.313229 & -2.1926 & 0.016557 \tabularnewline
33 & -0.300618 & -2.1043 & 0.020252 \tabularnewline
34 & -0.284569 & -1.992 & 0.02598 \tabularnewline
35 & -0.265412 & -1.8579 & 0.034599 \tabularnewline
36 & -0.242677 & -1.6987 & 0.047855 \tabularnewline
\hline
\end{tabular}
%Source: https://freestatistics.org/blog/index.php?pk=59402&T=1

[TABLE]
[ROW][C]Autocorrelation Function[/C][/ROW]
[ROW][C]Time lag k[/C][C]ACF(k)[/C][C]T-STAT[/C][C]P-value[/C][/ROW]
[ROW][C]1[/C][C]0.964427[/C][C]6.751[/C][C]0[/C][/ROW]
[ROW][C]2[/C][C]0.900488[/C][C]6.3034[/C][C]0[/C][/ROW]
[ROW][C]3[/C][C]0.816861[/C][C]5.718[/C][C]0[/C][/ROW]
[ROW][C]4[/C][C]0.727059[/C][C]5.0894[/C][C]3e-06[/C][/ROW]
[ROW][C]5[/C][C]0.635962[/C][C]4.4517[/C][C]2.5e-05[/C][/ROW]
[ROW][C]6[/C][C]0.550751[/C][C]3.8553[/C][C]0.000169[/C][/ROW]
[ROW][C]7[/C][C]0.46191[/C][C]3.2334[/C][C]0.001096[/C][/ROW]
[ROW][C]8[/C][C]0.370259[/C][C]2.5918[/C][C]0.006273[/C][/ROW]
[ROW][C]9[/C][C]0.278143[/C][C]1.947[/C][C]0.028639[/C][/ROW]
[ROW][C]10[/C][C]0.192345[/C][C]1.3464[/C][C]0.092182[/C][/ROW]
[ROW][C]11[/C][C]0.120382[/C][C]0.8427[/C][C]0.201754[/C][/ROW]
[ROW][C]12[/C][C]0.066496[/C][C]0.4655[/C][C]0.321828[/C][/ROW]
[ROW][C]13[/C][C]0.026347[/C][C]0.1844[/C][C]0.427219[/C][/ROW]
[ROW][C]14[/C][C]-0.002434[/C][C]-0.017[/C][C]0.493238[/C][/ROW]
[ROW][C]15[/C][C]-0.027153[/C][C]-0.1901[/C][C]0.42502[/C][/ROW]
[ROW][C]16[/C][C]-0.056788[/C][C]-0.3975[/C][C]0.346356[/C][/ROW]
[ROW][C]17[/C][C]-0.090728[/C][C]-0.6351[/C][C]0.26416[/C][/ROW]
[ROW][C]18[/C][C]-0.126771[/C][C]-0.8874[/C][C]0.189601[/C][/ROW]
[ROW][C]19[/C][C]-0.159032[/C][C]-1.1132[/C][C]0.135522[/C][/ROW]
[ROW][C]20[/C][C]-0.192058[/C][C]-1.3444[/C][C]0.092504[/C][/ROW]
[ROW][C]21[/C][C]-0.21991[/C][C]-1.5394[/C][C]0.065074[/C][/ROW]
[ROW][C]22[/C][C]-0.24726[/C][C]-1.7308[/C][C]0.044888[/C][/ROW]
[ROW][C]23[/C][C]-0.274083[/C][C]-1.9186[/C][C]0.030437[/C][/ROW]
[ROW][C]24[/C][C]-0.301159[/C][C]-2.1081[/C][C]0.02008[/C][/ROW]
[ROW][C]25[/C][C]-0.320459[/C][C]-2.2432[/C][C]0.014719[/C][/ROW]
[ROW][C]26[/C][C]-0.336135[/C][C]-2.3529[/C][C]0.011342[/C][/ROW]
[ROW][C]27[/C][C]-0.343259[/C][C]-2.4028[/C][C]0.010051[/C][/ROW]
[ROW][C]28[/C][C]-0.344574[/C][C]-2.412[/C][C]0.009827[/C][/ROW]
[ROW][C]29[/C][C]-0.339903[/C][C]-2.3793[/C][C]0.010642[/C][/ROW]
[ROW][C]30[/C][C]-0.332598[/C][C]-2.3282[/C][C]0.012037[/C][/ROW]
[ROW][C]31[/C][C]-0.32405[/C][C]-2.2683[/C][C]0.013875[/C][/ROW]
[ROW][C]32[/C][C]-0.313229[/C][C]-2.1926[/C][C]0.016557[/C][/ROW]
[ROW][C]33[/C][C]-0.300618[/C][C]-2.1043[/C][C]0.020252[/C][/ROW]
[ROW][C]34[/C][C]-0.284569[/C][C]-1.992[/C][C]0.02598[/C][/ROW]
[ROW][C]35[/C][C]-0.265412[/C][C]-1.8579[/C][C]0.034599[/C][/ROW]
[ROW][C]36[/C][C]-0.242677[/C][C]-1.6987[/C][C]0.047855[/C][/ROW]
[/TABLE]
Source: https://freestatistics.org/blog/index.php?pk=59402&T=1

Globally Unique Identifier (entire table): ba.freestatistics.org/blog/index.php?pk=59402&T=1

As an alternative you can also use a QR Code:  

The GUIDs for individual cells are displayed in the table below:

Autocorrelation Function
Time lag kACF(k)T-STATP-value
10.9644276.7510
20.9004886.30340
30.8168615.7180
40.7270595.08943e-06
50.6359624.45172.5e-05
60.5507513.85530.000169
70.461913.23340.001096
80.3702592.59180.006273
90.2781431.9470.028639
100.1923451.34640.092182
110.1203820.84270.201754
120.0664960.46550.321828
130.0263470.18440.427219
14-0.002434-0.0170.493238
15-0.027153-0.19010.42502
16-0.056788-0.39750.346356
17-0.090728-0.63510.26416
18-0.126771-0.88740.189601
19-0.159032-1.11320.135522
20-0.192058-1.34440.092504
21-0.21991-1.53940.065074
22-0.24726-1.73080.044888
23-0.274083-1.91860.030437
24-0.301159-2.10810.02008
25-0.320459-2.24320.014719
26-0.336135-2.35290.011342
27-0.343259-2.40280.010051
28-0.344574-2.4120.009827
29-0.339903-2.37930.010642
30-0.332598-2.32820.012037
31-0.32405-2.26830.013875
32-0.313229-2.19260.016557
33-0.300618-2.10430.020252
34-0.284569-1.9920.02598
35-0.265412-1.85790.034599
36-0.242677-1.69870.047855


Partial Autocorrelation Function
Time lag kPACF(k)T-STATP-value
10.9644276.7510
2-0.424018-2.96810.002313
3-0.190149-1.3310.094667
40.020380.14270.443572
5-0.020261-0.14180.443898
60.03820.26740.395141
7-0.19974-1.39820.084178
8-0.094633-0.66240.255398
9-0.005191-0.03630.485582
100.0544070.38080.352481
110.1118980.78330.218615
120.0531520.37210.355725
13-0.043695-0.30590.380501
14-0.001512-0.01060.495798
15-0.062378-0.43660.332143
16-0.156244-1.09370.139715
17-0.061982-0.43390.333142
18-0.05152-0.36060.359959
190.0378630.2650.396046
20-0.125359-0.87750.192244
210.0307020.21490.415364
22-0.020875-0.14610.442212
23-0.007084-0.04960.480327
240.0037150.0260.48968
250.0714510.50020.309603
26-0.082544-0.57780.283021
27-0.011012-0.07710.469435
28-0.044957-0.31470.377163
29-0.020755-0.14530.442542
30-0.022056-0.15440.438969
31-0.067695-0.47390.318851
320.0437410.30620.38038
33-0.035097-0.24570.40348
340.0196060.13720.445701
350.028380.19870.421676
360.0182310.12760.449487

\begin{tabular}{lllllllll}
\hline
Partial Autocorrelation Function \tabularnewline
Time lag k & PACF(k) & T-STAT & P-value \tabularnewline
1 & 0.964427 & 6.751 & 0 \tabularnewline
2 & -0.424018 & -2.9681 & 0.002313 \tabularnewline
3 & -0.190149 & -1.331 & 0.094667 \tabularnewline
4 & 0.02038 & 0.1427 & 0.443572 \tabularnewline
5 & -0.020261 & -0.1418 & 0.443898 \tabularnewline
6 & 0.0382 & 0.2674 & 0.395141 \tabularnewline
7 & -0.19974 & -1.3982 & 0.084178 \tabularnewline
8 & -0.094633 & -0.6624 & 0.255398 \tabularnewline
9 & -0.005191 & -0.0363 & 0.485582 \tabularnewline
10 & 0.054407 & 0.3808 & 0.352481 \tabularnewline
11 & 0.111898 & 0.7833 & 0.218615 \tabularnewline
12 & 0.053152 & 0.3721 & 0.355725 \tabularnewline
13 & -0.043695 & -0.3059 & 0.380501 \tabularnewline
14 & -0.001512 & -0.0106 & 0.495798 \tabularnewline
15 & -0.062378 & -0.4366 & 0.332143 \tabularnewline
16 & -0.156244 & -1.0937 & 0.139715 \tabularnewline
17 & -0.061982 & -0.4339 & 0.333142 \tabularnewline
18 & -0.05152 & -0.3606 & 0.359959 \tabularnewline
19 & 0.037863 & 0.265 & 0.396046 \tabularnewline
20 & -0.125359 & -0.8775 & 0.192244 \tabularnewline
21 & 0.030702 & 0.2149 & 0.415364 \tabularnewline
22 & -0.020875 & -0.1461 & 0.442212 \tabularnewline
23 & -0.007084 & -0.0496 & 0.480327 \tabularnewline
24 & 0.003715 & 0.026 & 0.48968 \tabularnewline
25 & 0.071451 & 0.5002 & 0.309603 \tabularnewline
26 & -0.082544 & -0.5778 & 0.283021 \tabularnewline
27 & -0.011012 & -0.0771 & 0.469435 \tabularnewline
28 & -0.044957 & -0.3147 & 0.377163 \tabularnewline
29 & -0.020755 & -0.1453 & 0.442542 \tabularnewline
30 & -0.022056 & -0.1544 & 0.438969 \tabularnewline
31 & -0.067695 & -0.4739 & 0.318851 \tabularnewline
32 & 0.043741 & 0.3062 & 0.38038 \tabularnewline
33 & -0.035097 & -0.2457 & 0.40348 \tabularnewline
34 & 0.019606 & 0.1372 & 0.445701 \tabularnewline
35 & 0.02838 & 0.1987 & 0.421676 \tabularnewline
36 & 0.018231 & 0.1276 & 0.449487 \tabularnewline
\hline
\end{tabular}
%Source: https://freestatistics.org/blog/index.php?pk=59402&T=2

[TABLE]
[ROW][C]Partial Autocorrelation Function[/C][/ROW]
[ROW][C]Time lag k[/C][C]PACF(k)[/C][C]T-STAT[/C][C]P-value[/C][/ROW]
[ROW][C]1[/C][C]0.964427[/C][C]6.751[/C][C]0[/C][/ROW]
[ROW][C]2[/C][C]-0.424018[/C][C]-2.9681[/C][C]0.002313[/C][/ROW]
[ROW][C]3[/C][C]-0.190149[/C][C]-1.331[/C][C]0.094667[/C][/ROW]
[ROW][C]4[/C][C]0.02038[/C][C]0.1427[/C][C]0.443572[/C][/ROW]
[ROW][C]5[/C][C]-0.020261[/C][C]-0.1418[/C][C]0.443898[/C][/ROW]
[ROW][C]6[/C][C]0.0382[/C][C]0.2674[/C][C]0.395141[/C][/ROW]
[ROW][C]7[/C][C]-0.19974[/C][C]-1.3982[/C][C]0.084178[/C][/ROW]
[ROW][C]8[/C][C]-0.094633[/C][C]-0.6624[/C][C]0.255398[/C][/ROW]
[ROW][C]9[/C][C]-0.005191[/C][C]-0.0363[/C][C]0.485582[/C][/ROW]
[ROW][C]10[/C][C]0.054407[/C][C]0.3808[/C][C]0.352481[/C][/ROW]
[ROW][C]11[/C][C]0.111898[/C][C]0.7833[/C][C]0.218615[/C][/ROW]
[ROW][C]12[/C][C]0.053152[/C][C]0.3721[/C][C]0.355725[/C][/ROW]
[ROW][C]13[/C][C]-0.043695[/C][C]-0.3059[/C][C]0.380501[/C][/ROW]
[ROW][C]14[/C][C]-0.001512[/C][C]-0.0106[/C][C]0.495798[/C][/ROW]
[ROW][C]15[/C][C]-0.062378[/C][C]-0.4366[/C][C]0.332143[/C][/ROW]
[ROW][C]16[/C][C]-0.156244[/C][C]-1.0937[/C][C]0.139715[/C][/ROW]
[ROW][C]17[/C][C]-0.061982[/C][C]-0.4339[/C][C]0.333142[/C][/ROW]
[ROW][C]18[/C][C]-0.05152[/C][C]-0.3606[/C][C]0.359959[/C][/ROW]
[ROW][C]19[/C][C]0.037863[/C][C]0.265[/C][C]0.396046[/C][/ROW]
[ROW][C]20[/C][C]-0.125359[/C][C]-0.8775[/C][C]0.192244[/C][/ROW]
[ROW][C]21[/C][C]0.030702[/C][C]0.2149[/C][C]0.415364[/C][/ROW]
[ROW][C]22[/C][C]-0.020875[/C][C]-0.1461[/C][C]0.442212[/C][/ROW]
[ROW][C]23[/C][C]-0.007084[/C][C]-0.0496[/C][C]0.480327[/C][/ROW]
[ROW][C]24[/C][C]0.003715[/C][C]0.026[/C][C]0.48968[/C][/ROW]
[ROW][C]25[/C][C]0.071451[/C][C]0.5002[/C][C]0.309603[/C][/ROW]
[ROW][C]26[/C][C]-0.082544[/C][C]-0.5778[/C][C]0.283021[/C][/ROW]
[ROW][C]27[/C][C]-0.011012[/C][C]-0.0771[/C][C]0.469435[/C][/ROW]
[ROW][C]28[/C][C]-0.044957[/C][C]-0.3147[/C][C]0.377163[/C][/ROW]
[ROW][C]29[/C][C]-0.020755[/C][C]-0.1453[/C][C]0.442542[/C][/ROW]
[ROW][C]30[/C][C]-0.022056[/C][C]-0.1544[/C][C]0.438969[/C][/ROW]
[ROW][C]31[/C][C]-0.067695[/C][C]-0.4739[/C][C]0.318851[/C][/ROW]
[ROW][C]32[/C][C]0.043741[/C][C]0.3062[/C][C]0.38038[/C][/ROW]
[ROW][C]33[/C][C]-0.035097[/C][C]-0.2457[/C][C]0.40348[/C][/ROW]
[ROW][C]34[/C][C]0.019606[/C][C]0.1372[/C][C]0.445701[/C][/ROW]
[ROW][C]35[/C][C]0.02838[/C][C]0.1987[/C][C]0.421676[/C][/ROW]
[ROW][C]36[/C][C]0.018231[/C][C]0.1276[/C][C]0.449487[/C][/ROW]
[/TABLE]
Source: https://freestatistics.org/blog/index.php?pk=59402&T=2

Globally Unique Identifier (entire table): ba.freestatistics.org/blog/index.php?pk=59402&T=2

As an alternative you can also use a QR Code:  

The GUIDs for individual cells are displayed in the table below:

Partial Autocorrelation Function
Time lag kPACF(k)T-STATP-value
10.9644276.7510
2-0.424018-2.96810.002313
3-0.190149-1.3310.094667
40.020380.14270.443572
5-0.020261-0.14180.443898
60.03820.26740.395141
7-0.19974-1.39820.084178
8-0.094633-0.66240.255398
9-0.005191-0.03630.485582
100.0544070.38080.352481
110.1118980.78330.218615
120.0531520.37210.355725
13-0.043695-0.30590.380501
14-0.001512-0.01060.495798
15-0.062378-0.43660.332143
16-0.156244-1.09370.139715
17-0.061982-0.43390.333142
18-0.05152-0.36060.359959
190.0378630.2650.396046
20-0.125359-0.87750.192244
210.0307020.21490.415364
22-0.020875-0.14610.442212
23-0.007084-0.04960.480327
240.0037150.0260.48968
250.0714510.50020.309603
26-0.082544-0.57780.283021
27-0.011012-0.07710.469435
28-0.044957-0.31470.377163
29-0.020755-0.14530.442542
30-0.022056-0.15440.438969
31-0.067695-0.47390.318851
320.0437410.30620.38038
33-0.035097-0.24570.40348
340.0196060.13720.445701
350.028380.19870.421676
360.0182310.12760.449487


Parameters (Session):
par1 = 36 ; par2 = 1 ; par3 = 0 ; par4 = 1 ; par5 = 12 ; par6 = White Noise ; par7 = 0.95 ;
Parameters (R input):
par1 = 36 ; par2 = 1 ; par3 = 0 ; par4 = 1 ; par5 = 12 ; par6 = White Noise ; par7 = 0.95 ;
R code (references can be found in the software module):
if (par1 == 'Default') {
par1 = 10*log10(length(x))
} else {
par1 <- as.numeric(par1)
}
par2 <- as.numeric(par2)
par3 <- as.numeric(par3)
par4 <- as.numeric(par4)
par5 <- as.numeric(par5)
if (par6 == 'White Noise') par6 <- 'white' else par6 <- 'ma'
par7 <- as.numeric(par7)
if (par2 == 0) {
x <- log(x)
} else {
x <- (x ^ par2 - 1) / par2
}
if (par3 > 0) x <- diff(x,lag=1,difference=par3)
if (par4 > 0) x <- diff(x,lag=par5,difference=par4)
bitmap(file='pic1.png')
racf <- acf(x, par1, main='Autocorrelation', xlab='time lag', ylab='ACF', ci.type=par6, ci=par7, sub=paste('(lambda=',par2,', d=',par3,', D=',par4,', CI=', par7, ', CI type=',par6,')',sep=''))
dev.off()
bitmap(file='pic2.png')
rpacf <- pacf(x,par1,main='Partial Autocorrelation',xlab='lags',ylab='PACF')
dev.off()
(myacf <- c(racf$acf))
(mypacf <- c(rpacf$acf))
lengthx <- length(x)
sqrtn <- sqrt(lengthx)
load(file='createtable')
a<-table.start()
a<-table.row.start(a)
a<-table.element(a,'Autocorrelation Function',4,TRUE)
a<-table.row.end(a)
a<-table.row.start(a)
a<-table.element(a,'Time lag k',header=TRUE)
a<-table.element(a,hyperlink('basics.htm','ACF(k)','click here for more information about the Autocorrelation Function'),header=TRUE)
a<-table.element(a,'T-STAT',header=TRUE)
a<-table.element(a,'P-value',header=TRUE)
a<-table.row.end(a)
for (i in 2:(par1+1)) {
a<-table.row.start(a)
a<-table.element(a,i-1,header=TRUE)
a<-table.element(a,round(myacf[i],6))
mytstat <- myacf[i]*sqrtn
a<-table.element(a,round(mytstat,4))
a<-table.element(a,round(1-pt(abs(mytstat),lengthx),6))
a<-table.row.end(a)
}
a<-table.end(a)
table.save(a,file='mytable.tab')
a<-table.start()
a<-table.row.start(a)
a<-table.element(a,'Partial Autocorrelation Function',4,TRUE)
a<-table.row.end(a)
a<-table.row.start(a)
a<-table.element(a,'Time lag k',header=TRUE)
a<-table.element(a,hyperlink('basics.htm','PACF(k)','click here for more information about the Partial Autocorrelation Function'),header=TRUE)
a<-table.element(a,'T-STAT',header=TRUE)
a<-table.element(a,'P-value',header=TRUE)
a<-table.row.end(a)
for (i in 1:par1) {
a<-table.row.start(a)
a<-table.element(a,i,header=TRUE)
a<-table.element(a,round(mypacf[i],6))
mytstat <- mypacf[i]*sqrtn
a<-table.element(a,round(mytstat,4))
a<-table.element(a,round(1-pt(abs(mytstat),lengthx),6))
a<-table.row.end(a)
}
a<-table.end(a)
table.save(a,file='mytable1.tab')