Free Statistics

of Irreproducible Research!

Author's title

Author*The author of this computation has been verified*
R Software Modulerwasp_autocorrelation.wasp
Title produced by software(Partial) Autocorrelation Function
Date of computationWed, 25 Nov 2009 09:01:40 -0700
Cite this page as followsStatistical Computations at FreeStatistics.org, Office for Research Development and Education, URL https://freestatistics.org/blog/index.php?v=date/2009/Nov/25/t1259164976dais961mphqeub8.htm/, Retrieved Tue, 07 May 2024 14:21:09 +0000
Statistical Computations at FreeStatistics.org, Office for Research Development and Education, URL https://freestatistics.org/blog/index.php?pk=59420, Retrieved Tue, 07 May 2024 14:21:09 +0000
QR Codes:

Original text written by user:
IsPrivate?No (this computation is public)
User-defined keywords
Estimated Impact158
Family? (F = Feedback message, R = changed R code, M = changed R Module, P = changed Parameters, D = changed Data)
-     [Univariate Explorative Data Analysis] [Run Sequence gebo...] [2008-12-12 13:32:37] [76963dc1903f0f612b6153510a3818cf]
- R  D  [Univariate Explorative Data Analysis] [Run Sequence gebo...] [2008-12-17 12:14:40] [76963dc1903f0f612b6153510a3818cf]
-         [Univariate Explorative Data Analysis] [Run Sequence Plot...] [2008-12-22 18:19:51] [1ce0d16c8f4225c977b42c8fa93bc163]
- RMP       [(Partial) Autocorrelation Function] [Identifying Integ...] [2009-11-22 12:26:39] [b98453cac15ba1066b407e146608df68]
-   PD          [(Partial) Autocorrelation Function] [ACF(3)] [2009-11-25 16:01:40] [a93df6747c5c78315f2ee9914aea3ec6] [Current]
Feedback Forum

Post a new message
Dataseries X:
2.085
2.053
2.077
2.058
2.057
2.076
2.07
2.062
2.073
2.061
2.094
2.067
2.086
2.276
2.326
2.349
2.52
2.628
2.577
2.698
2.814
2.968
3.041
3.278
3.328
3.5
3.563
3.569
3.69
3.819
3.79
3.956
4.063
4.047
4.029
3.941
4.022
3.879
4.022
4.028
4.091
3.987
4.01
4.007
4.191
4.299
4.273
3.82
3.15
2.486
1.812
1.257
1.062
0.842
0.782
0.698
0.358
0.347
0.363
0.359
0.355


Summary of computational transaction
Raw Inputview raw input (R code)
Raw Outputview raw output of R engine
Computing time2 seconds
R Server'Gwilym Jenkins' @ 72.249.127.135

\begin{tabular}{lllllllll}
\hline
Summary of computational transaction \tabularnewline
Raw Input & view raw input (R code)  \tabularnewline
Raw Output & view raw output of R engine  \tabularnewline
Computing time & 2 seconds \tabularnewline
R Server & 'Gwilym Jenkins' @ 72.249.127.135 \tabularnewline
\hline
\end{tabular}
%Source: https://freestatistics.org/blog/index.php?pk=59420&T=0

[TABLE]
[ROW][C]Summary of computational transaction[/C][/ROW]
[ROW][C]Raw Input[/C][C]view raw input (R code) [/C][/ROW]
[ROW][C]Raw Output[/C][C]view raw output of R engine [/C][/ROW]
[ROW][C]Computing time[/C][C]2 seconds[/C][/ROW]
[ROW][C]R Server[/C][C]'Gwilym Jenkins' @ 72.249.127.135[/C][/ROW]
[/TABLE]
Source: https://freestatistics.org/blog/index.php?pk=59420&T=0

Globally Unique Identifier (entire table): ba.freestatistics.org/blog/index.php?pk=59420&T=0

As an alternative you can also use a QR Code:  

The GUIDs for individual cells are displayed in the table below:

Summary of computational transaction
Raw Inputview raw input (R code)
Raw Outputview raw output of R engine
Computing time2 seconds
R Server'Gwilym Jenkins' @ 72.249.127.135


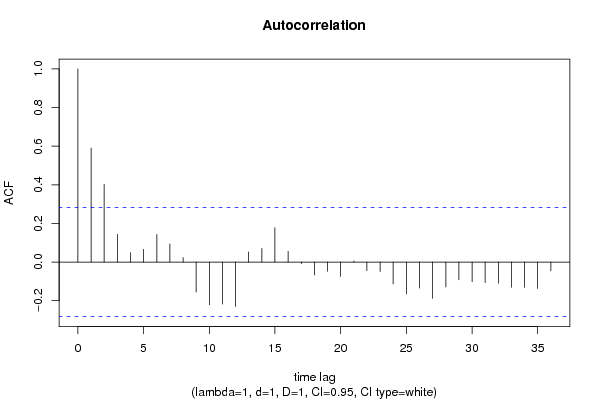
Autocorrelation Function
Time lag kACF(k)T-STATP-value
10.5904094.09058.2e-05
20.4016862.7830.00384
30.1433090.99290.162874
40.0486670.33720.368727
50.0659270.45680.324954
60.142560.98770.164129
70.0938160.650.259404
80.0231220.16020.4367
9-0.155252-1.07560.143738
10-0.22177-1.53650.065495
11-0.217829-1.50920.068906
12-0.23064-1.59790.058312
130.0524420.36330.358976
140.0701920.48630.314483
150.1776071.23050.112253
160.0557050.38590.350625
17-0.008711-0.06030.476064
18-0.06747-0.46740.321148
19-0.048339-0.33490.369579
20-0.074395-0.51540.304312
210.0050710.03510.48606
22-0.044943-0.31140.378433
23-0.048748-0.33770.368517
24-0.113555-0.78670.217654
25-0.164932-1.14270.129419
26-0.135114-0.93610.176955
27-0.187656-1.30010.099884
28-0.128879-0.89290.188183
29-0.091951-0.63710.263557
30-0.101506-0.70330.242647
31-0.106546-0.73820.232002
32-0.109521-0.75880.225846
33-0.131169-0.90880.184007
34-0.13123-0.90920.183897
35-0.137326-0.95140.173078
36-0.045505-0.31530.376962

\begin{tabular}{lllllllll}
\hline
Autocorrelation Function \tabularnewline
Time lag k & ACF(k) & T-STAT & P-value \tabularnewline
1 & 0.590409 & 4.0905 & 8.2e-05 \tabularnewline
2 & 0.401686 & 2.783 & 0.00384 \tabularnewline
3 & 0.143309 & 0.9929 & 0.162874 \tabularnewline
4 & 0.048667 & 0.3372 & 0.368727 \tabularnewline
5 & 0.065927 & 0.4568 & 0.324954 \tabularnewline
6 & 0.14256 & 0.9877 & 0.164129 \tabularnewline
7 & 0.093816 & 0.65 & 0.259404 \tabularnewline
8 & 0.023122 & 0.1602 & 0.4367 \tabularnewline
9 & -0.155252 & -1.0756 & 0.143738 \tabularnewline
10 & -0.22177 & -1.5365 & 0.065495 \tabularnewline
11 & -0.217829 & -1.5092 & 0.068906 \tabularnewline
12 & -0.23064 & -1.5979 & 0.058312 \tabularnewline
13 & 0.052442 & 0.3633 & 0.358976 \tabularnewline
14 & 0.070192 & 0.4863 & 0.314483 \tabularnewline
15 & 0.177607 & 1.2305 & 0.112253 \tabularnewline
16 & 0.055705 & 0.3859 & 0.350625 \tabularnewline
17 & -0.008711 & -0.0603 & 0.476064 \tabularnewline
18 & -0.06747 & -0.4674 & 0.321148 \tabularnewline
19 & -0.048339 & -0.3349 & 0.369579 \tabularnewline
20 & -0.074395 & -0.5154 & 0.304312 \tabularnewline
21 & 0.005071 & 0.0351 & 0.48606 \tabularnewline
22 & -0.044943 & -0.3114 & 0.378433 \tabularnewline
23 & -0.048748 & -0.3377 & 0.368517 \tabularnewline
24 & -0.113555 & -0.7867 & 0.217654 \tabularnewline
25 & -0.164932 & -1.1427 & 0.129419 \tabularnewline
26 & -0.135114 & -0.9361 & 0.176955 \tabularnewline
27 & -0.187656 & -1.3001 & 0.099884 \tabularnewline
28 & -0.128879 & -0.8929 & 0.188183 \tabularnewline
29 & -0.091951 & -0.6371 & 0.263557 \tabularnewline
30 & -0.101506 & -0.7033 & 0.242647 \tabularnewline
31 & -0.106546 & -0.7382 & 0.232002 \tabularnewline
32 & -0.109521 & -0.7588 & 0.225846 \tabularnewline
33 & -0.131169 & -0.9088 & 0.184007 \tabularnewline
34 & -0.13123 & -0.9092 & 0.183897 \tabularnewline
35 & -0.137326 & -0.9514 & 0.173078 \tabularnewline
36 & -0.045505 & -0.3153 & 0.376962 \tabularnewline
\hline
\end{tabular}
%Source: https://freestatistics.org/blog/index.php?pk=59420&T=1

[TABLE]
[ROW][C]Autocorrelation Function[/C][/ROW]
[ROW][C]Time lag k[/C][C]ACF(k)[/C][C]T-STAT[/C][C]P-value[/C][/ROW]
[ROW][C]1[/C][C]0.590409[/C][C]4.0905[/C][C]8.2e-05[/C][/ROW]
[ROW][C]2[/C][C]0.401686[/C][C]2.783[/C][C]0.00384[/C][/ROW]
[ROW][C]3[/C][C]0.143309[/C][C]0.9929[/C][C]0.162874[/C][/ROW]
[ROW][C]4[/C][C]0.048667[/C][C]0.3372[/C][C]0.368727[/C][/ROW]
[ROW][C]5[/C][C]0.065927[/C][C]0.4568[/C][C]0.324954[/C][/ROW]
[ROW][C]6[/C][C]0.14256[/C][C]0.9877[/C][C]0.164129[/C][/ROW]
[ROW][C]7[/C][C]0.093816[/C][C]0.65[/C][C]0.259404[/C][/ROW]
[ROW][C]8[/C][C]0.023122[/C][C]0.1602[/C][C]0.4367[/C][/ROW]
[ROW][C]9[/C][C]-0.155252[/C][C]-1.0756[/C][C]0.143738[/C][/ROW]
[ROW][C]10[/C][C]-0.22177[/C][C]-1.5365[/C][C]0.065495[/C][/ROW]
[ROW][C]11[/C][C]-0.217829[/C][C]-1.5092[/C][C]0.068906[/C][/ROW]
[ROW][C]12[/C][C]-0.23064[/C][C]-1.5979[/C][C]0.058312[/C][/ROW]
[ROW][C]13[/C][C]0.052442[/C][C]0.3633[/C][C]0.358976[/C][/ROW]
[ROW][C]14[/C][C]0.070192[/C][C]0.4863[/C][C]0.314483[/C][/ROW]
[ROW][C]15[/C][C]0.177607[/C][C]1.2305[/C][C]0.112253[/C][/ROW]
[ROW][C]16[/C][C]0.055705[/C][C]0.3859[/C][C]0.350625[/C][/ROW]
[ROW][C]17[/C][C]-0.008711[/C][C]-0.0603[/C][C]0.476064[/C][/ROW]
[ROW][C]18[/C][C]-0.06747[/C][C]-0.4674[/C][C]0.321148[/C][/ROW]
[ROW][C]19[/C][C]-0.048339[/C][C]-0.3349[/C][C]0.369579[/C][/ROW]
[ROW][C]20[/C][C]-0.074395[/C][C]-0.5154[/C][C]0.304312[/C][/ROW]
[ROW][C]21[/C][C]0.005071[/C][C]0.0351[/C][C]0.48606[/C][/ROW]
[ROW][C]22[/C][C]-0.044943[/C][C]-0.3114[/C][C]0.378433[/C][/ROW]
[ROW][C]23[/C][C]-0.048748[/C][C]-0.3377[/C][C]0.368517[/C][/ROW]
[ROW][C]24[/C][C]-0.113555[/C][C]-0.7867[/C][C]0.217654[/C][/ROW]
[ROW][C]25[/C][C]-0.164932[/C][C]-1.1427[/C][C]0.129419[/C][/ROW]
[ROW][C]26[/C][C]-0.135114[/C][C]-0.9361[/C][C]0.176955[/C][/ROW]
[ROW][C]27[/C][C]-0.187656[/C][C]-1.3001[/C][C]0.099884[/C][/ROW]
[ROW][C]28[/C][C]-0.128879[/C][C]-0.8929[/C][C]0.188183[/C][/ROW]
[ROW][C]29[/C][C]-0.091951[/C][C]-0.6371[/C][C]0.263557[/C][/ROW]
[ROW][C]30[/C][C]-0.101506[/C][C]-0.7033[/C][C]0.242647[/C][/ROW]
[ROW][C]31[/C][C]-0.106546[/C][C]-0.7382[/C][C]0.232002[/C][/ROW]
[ROW][C]32[/C][C]-0.109521[/C][C]-0.7588[/C][C]0.225846[/C][/ROW]
[ROW][C]33[/C][C]-0.131169[/C][C]-0.9088[/C][C]0.184007[/C][/ROW]
[ROW][C]34[/C][C]-0.13123[/C][C]-0.9092[/C][C]0.183897[/C][/ROW]
[ROW][C]35[/C][C]-0.137326[/C][C]-0.9514[/C][C]0.173078[/C][/ROW]
[ROW][C]36[/C][C]-0.045505[/C][C]-0.3153[/C][C]0.376962[/C][/ROW]
[/TABLE]
Source: https://freestatistics.org/blog/index.php?pk=59420&T=1

Globally Unique Identifier (entire table): ba.freestatistics.org/blog/index.php?pk=59420&T=1

As an alternative you can also use a QR Code:  

The GUIDs for individual cells are displayed in the table below:

Autocorrelation Function
Time lag kACF(k)T-STATP-value
10.5904094.09058.2e-05
20.4016862.7830.00384
30.1433090.99290.162874
40.0486670.33720.368727
50.0659270.45680.324954
60.142560.98770.164129
70.0938160.650.259404
80.0231220.16020.4367
9-0.155252-1.07560.143738
10-0.22177-1.53650.065495
11-0.217829-1.50920.068906
12-0.23064-1.59790.058312
130.0524420.36330.358976
140.0701920.48630.314483
150.1776071.23050.112253
160.0557050.38590.350625
17-0.008711-0.06030.476064
18-0.06747-0.46740.321148
19-0.048339-0.33490.369579
20-0.074395-0.51540.304312
210.0050710.03510.48606
22-0.044943-0.31140.378433
23-0.048748-0.33770.368517
24-0.113555-0.78670.217654
25-0.164932-1.14270.129419
26-0.135114-0.93610.176955
27-0.187656-1.30010.099884
28-0.128879-0.89290.188183
29-0.091951-0.63710.263557
30-0.101506-0.70330.242647
31-0.106546-0.73820.232002
32-0.109521-0.75880.225846
33-0.131169-0.90880.184007
34-0.13123-0.90920.183897
35-0.137326-0.95140.173078
36-0.045505-0.31530.376962


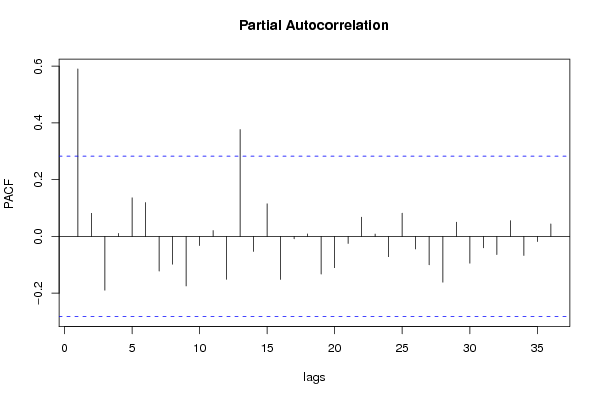
Partial Autocorrelation Function
Time lag kPACF(k)T-STATP-value
10.5904094.09058.2e-05
20.0815190.56480.287428
3-0.189535-1.31310.097689
40.0105990.07340.470885
50.1359550.94190.175475
60.1195440.82820.205821
7-0.122167-0.84640.200765
8-0.098137-0.67990.249913
9-0.174832-1.21130.11586
10-0.032098-0.22240.412481
110.0204180.14150.444048
12-0.151297-1.04820.149895
130.3765882.60910.006035
14-0.052799-0.36580.35806
150.1147930.79530.215175
16-0.151728-1.05120.149215
17-0.008518-0.0590.476593
180.0087310.06050.476008
19-0.132595-0.91860.181437
20-0.110157-0.76320.224542
21-0.024855-0.17220.432001
220.0678820.47030.320135
230.0082730.05730.477266
24-0.071448-0.4950.311426
250.082080.56870.286116
26-0.044268-0.30670.3802
27-0.100007-0.69290.245864
28-0.161215-1.11690.134793
290.050240.34810.364654
30-0.094606-0.65550.257653
31-0.040084-0.27770.391214
32-0.064082-0.4440.329529
330.0556260.38540.350826
34-0.066999-0.46420.322308
35-0.018238-0.12640.449988
360.0438480.30380.381301

\begin{tabular}{lllllllll}
\hline
Partial Autocorrelation Function \tabularnewline
Time lag k & PACF(k) & T-STAT & P-value \tabularnewline
1 & 0.590409 & 4.0905 & 8.2e-05 \tabularnewline
2 & 0.081519 & 0.5648 & 0.287428 \tabularnewline
3 & -0.189535 & -1.3131 & 0.097689 \tabularnewline
4 & 0.010599 & 0.0734 & 0.470885 \tabularnewline
5 & 0.135955 & 0.9419 & 0.175475 \tabularnewline
6 & 0.119544 & 0.8282 & 0.205821 \tabularnewline
7 & -0.122167 & -0.8464 & 0.200765 \tabularnewline
8 & -0.098137 & -0.6799 & 0.249913 \tabularnewline
9 & -0.174832 & -1.2113 & 0.11586 \tabularnewline
10 & -0.032098 & -0.2224 & 0.412481 \tabularnewline
11 & 0.020418 & 0.1415 & 0.444048 \tabularnewline
12 & -0.151297 & -1.0482 & 0.149895 \tabularnewline
13 & 0.376588 & 2.6091 & 0.006035 \tabularnewline
14 & -0.052799 & -0.3658 & 0.35806 \tabularnewline
15 & 0.114793 & 0.7953 & 0.215175 \tabularnewline
16 & -0.151728 & -1.0512 & 0.149215 \tabularnewline
17 & -0.008518 & -0.059 & 0.476593 \tabularnewline
18 & 0.008731 & 0.0605 & 0.476008 \tabularnewline
19 & -0.132595 & -0.9186 & 0.181437 \tabularnewline
20 & -0.110157 & -0.7632 & 0.224542 \tabularnewline
21 & -0.024855 & -0.1722 & 0.432001 \tabularnewline
22 & 0.067882 & 0.4703 & 0.320135 \tabularnewline
23 & 0.008273 & 0.0573 & 0.477266 \tabularnewline
24 & -0.071448 & -0.495 & 0.311426 \tabularnewline
25 & 0.08208 & 0.5687 & 0.286116 \tabularnewline
26 & -0.044268 & -0.3067 & 0.3802 \tabularnewline
27 & -0.100007 & -0.6929 & 0.245864 \tabularnewline
28 & -0.161215 & -1.1169 & 0.134793 \tabularnewline
29 & 0.05024 & 0.3481 & 0.364654 \tabularnewline
30 & -0.094606 & -0.6555 & 0.257653 \tabularnewline
31 & -0.040084 & -0.2777 & 0.391214 \tabularnewline
32 & -0.064082 & -0.444 & 0.329529 \tabularnewline
33 & 0.055626 & 0.3854 & 0.350826 \tabularnewline
34 & -0.066999 & -0.4642 & 0.322308 \tabularnewline
35 & -0.018238 & -0.1264 & 0.449988 \tabularnewline
36 & 0.043848 & 0.3038 & 0.381301 \tabularnewline
\hline
\end{tabular}
%Source: https://freestatistics.org/blog/index.php?pk=59420&T=2

[TABLE]
[ROW][C]Partial Autocorrelation Function[/C][/ROW]
[ROW][C]Time lag k[/C][C]PACF(k)[/C][C]T-STAT[/C][C]P-value[/C][/ROW]
[ROW][C]1[/C][C]0.590409[/C][C]4.0905[/C][C]8.2e-05[/C][/ROW]
[ROW][C]2[/C][C]0.081519[/C][C]0.5648[/C][C]0.287428[/C][/ROW]
[ROW][C]3[/C][C]-0.189535[/C][C]-1.3131[/C][C]0.097689[/C][/ROW]
[ROW][C]4[/C][C]0.010599[/C][C]0.0734[/C][C]0.470885[/C][/ROW]
[ROW][C]5[/C][C]0.135955[/C][C]0.9419[/C][C]0.175475[/C][/ROW]
[ROW][C]6[/C][C]0.119544[/C][C]0.8282[/C][C]0.205821[/C][/ROW]
[ROW][C]7[/C][C]-0.122167[/C][C]-0.8464[/C][C]0.200765[/C][/ROW]
[ROW][C]8[/C][C]-0.098137[/C][C]-0.6799[/C][C]0.249913[/C][/ROW]
[ROW][C]9[/C][C]-0.174832[/C][C]-1.2113[/C][C]0.11586[/C][/ROW]
[ROW][C]10[/C][C]-0.032098[/C][C]-0.2224[/C][C]0.412481[/C][/ROW]
[ROW][C]11[/C][C]0.020418[/C][C]0.1415[/C][C]0.444048[/C][/ROW]
[ROW][C]12[/C][C]-0.151297[/C][C]-1.0482[/C][C]0.149895[/C][/ROW]
[ROW][C]13[/C][C]0.376588[/C][C]2.6091[/C][C]0.006035[/C][/ROW]
[ROW][C]14[/C][C]-0.052799[/C][C]-0.3658[/C][C]0.35806[/C][/ROW]
[ROW][C]15[/C][C]0.114793[/C][C]0.7953[/C][C]0.215175[/C][/ROW]
[ROW][C]16[/C][C]-0.151728[/C][C]-1.0512[/C][C]0.149215[/C][/ROW]
[ROW][C]17[/C][C]-0.008518[/C][C]-0.059[/C][C]0.476593[/C][/ROW]
[ROW][C]18[/C][C]0.008731[/C][C]0.0605[/C][C]0.476008[/C][/ROW]
[ROW][C]19[/C][C]-0.132595[/C][C]-0.9186[/C][C]0.181437[/C][/ROW]
[ROW][C]20[/C][C]-0.110157[/C][C]-0.7632[/C][C]0.224542[/C][/ROW]
[ROW][C]21[/C][C]-0.024855[/C][C]-0.1722[/C][C]0.432001[/C][/ROW]
[ROW][C]22[/C][C]0.067882[/C][C]0.4703[/C][C]0.320135[/C][/ROW]
[ROW][C]23[/C][C]0.008273[/C][C]0.0573[/C][C]0.477266[/C][/ROW]
[ROW][C]24[/C][C]-0.071448[/C][C]-0.495[/C][C]0.311426[/C][/ROW]
[ROW][C]25[/C][C]0.08208[/C][C]0.5687[/C][C]0.286116[/C][/ROW]
[ROW][C]26[/C][C]-0.044268[/C][C]-0.3067[/C][C]0.3802[/C][/ROW]
[ROW][C]27[/C][C]-0.100007[/C][C]-0.6929[/C][C]0.245864[/C][/ROW]
[ROW][C]28[/C][C]-0.161215[/C][C]-1.1169[/C][C]0.134793[/C][/ROW]
[ROW][C]29[/C][C]0.05024[/C][C]0.3481[/C][C]0.364654[/C][/ROW]
[ROW][C]30[/C][C]-0.094606[/C][C]-0.6555[/C][C]0.257653[/C][/ROW]
[ROW][C]31[/C][C]-0.040084[/C][C]-0.2777[/C][C]0.391214[/C][/ROW]
[ROW][C]32[/C][C]-0.064082[/C][C]-0.444[/C][C]0.329529[/C][/ROW]
[ROW][C]33[/C][C]0.055626[/C][C]0.3854[/C][C]0.350826[/C][/ROW]
[ROW][C]34[/C][C]-0.066999[/C][C]-0.4642[/C][C]0.322308[/C][/ROW]
[ROW][C]35[/C][C]-0.018238[/C][C]-0.1264[/C][C]0.449988[/C][/ROW]
[ROW][C]36[/C][C]0.043848[/C][C]0.3038[/C][C]0.381301[/C][/ROW]
[/TABLE]
Source: https://freestatistics.org/blog/index.php?pk=59420&T=2

Globally Unique Identifier (entire table): ba.freestatistics.org/blog/index.php?pk=59420&T=2

As an alternative you can also use a QR Code:  

The GUIDs for individual cells are displayed in the table below:

Partial Autocorrelation Function
Time lag kPACF(k)T-STATP-value
10.5904094.09058.2e-05
20.0815190.56480.287428
3-0.189535-1.31310.097689
40.0105990.07340.470885
50.1359550.94190.175475
60.1195440.82820.205821
7-0.122167-0.84640.200765
8-0.098137-0.67990.249913
9-0.174832-1.21130.11586
10-0.032098-0.22240.412481
110.0204180.14150.444048
12-0.151297-1.04820.149895
130.3765882.60910.006035
14-0.052799-0.36580.35806
150.1147930.79530.215175
16-0.151728-1.05120.149215
17-0.008518-0.0590.476593
180.0087310.06050.476008
19-0.132595-0.91860.181437
20-0.110157-0.76320.224542
21-0.024855-0.17220.432001
220.0678820.47030.320135
230.0082730.05730.477266
24-0.071448-0.4950.311426
250.082080.56870.286116
26-0.044268-0.30670.3802
27-0.100007-0.69290.245864
28-0.161215-1.11690.134793
290.050240.34810.364654
30-0.094606-0.65550.257653
31-0.040084-0.27770.391214
32-0.064082-0.4440.329529
330.0556260.38540.350826
34-0.066999-0.46420.322308
35-0.018238-0.12640.449988
360.0438480.30380.381301


Parameters (Session):
par1 = 36 ; par2 = 1 ; par3 = 1 ; par4 = 1 ; par5 = 12 ; par6 = White Noise ; par7 = 0.95 ;
Parameters (R input):
par1 = 36 ; par2 = 1 ; par3 = 1 ; par4 = 1 ; par5 = 12 ; par6 = White Noise ; par7 = 0.95 ;
R code (references can be found in the software module):
if (par1 == 'Default') {
par1 = 10*log10(length(x))
} else {
par1 <- as.numeric(par1)
}
par2 <- as.numeric(par2)
par3 <- as.numeric(par3)
par4 <- as.numeric(par4)
par5 <- as.numeric(par5)
if (par6 == 'White Noise') par6 <- 'white' else par6 <- 'ma'
par7 <- as.numeric(par7)
if (par2 == 0) {
x <- log(x)
} else {
x <- (x ^ par2 - 1) / par2
}
if (par3 > 0) x <- diff(x,lag=1,difference=par3)
if (par4 > 0) x <- diff(x,lag=par5,difference=par4)
bitmap(file='pic1.png')
racf <- acf(x, par1, main='Autocorrelation', xlab='time lag', ylab='ACF', ci.type=par6, ci=par7, sub=paste('(lambda=',par2,', d=',par3,', D=',par4,', CI=', par7, ', CI type=',par6,')',sep=''))
dev.off()
bitmap(file='pic2.png')
rpacf <- pacf(x,par1,main='Partial Autocorrelation',xlab='lags',ylab='PACF')
dev.off()
(myacf <- c(racf$acf))
(mypacf <- c(rpacf$acf))
lengthx <- length(x)
sqrtn <- sqrt(lengthx)
load(file='createtable')
a<-table.start()
a<-table.row.start(a)
a<-table.element(a,'Autocorrelation Function',4,TRUE)
a<-table.row.end(a)
a<-table.row.start(a)
a<-table.element(a,'Time lag k',header=TRUE)
a<-table.element(a,hyperlink('basics.htm','ACF(k)','click here for more information about the Autocorrelation Function'),header=TRUE)
a<-table.element(a,'T-STAT',header=TRUE)
a<-table.element(a,'P-value',header=TRUE)
a<-table.row.end(a)
for (i in 2:(par1+1)) {
a<-table.row.start(a)
a<-table.element(a,i-1,header=TRUE)
a<-table.element(a,round(myacf[i],6))
mytstat <- myacf[i]*sqrtn
a<-table.element(a,round(mytstat,4))
a<-table.element(a,round(1-pt(abs(mytstat),lengthx),6))
a<-table.row.end(a)
}
a<-table.end(a)
table.save(a,file='mytable.tab')
a<-table.start()
a<-table.row.start(a)
a<-table.element(a,'Partial Autocorrelation Function',4,TRUE)
a<-table.row.end(a)
a<-table.row.start(a)
a<-table.element(a,'Time lag k',header=TRUE)
a<-table.element(a,hyperlink('basics.htm','PACF(k)','click here for more information about the Partial Autocorrelation Function'),header=TRUE)
a<-table.element(a,'T-STAT',header=TRUE)
a<-table.element(a,'P-value',header=TRUE)
a<-table.row.end(a)
for (i in 1:par1) {
a<-table.row.start(a)
a<-table.element(a,i,header=TRUE)
a<-table.element(a,round(mypacf[i],6))
mytstat <- mypacf[i]*sqrtn
a<-table.element(a,round(mytstat,4))
a<-table.element(a,round(1-pt(abs(mytstat),lengthx),6))
a<-table.row.end(a)
}
a<-table.end(a)
table.save(a,file='mytable1.tab')