Free Statistics

of Irreproducible Research!

Author's title

Author*The author of this computation has been verified*
R Software Modulerwasp_autocorrelation.wasp
Title produced by software(Partial) Autocorrelation Function
Date of computationWed, 25 Nov 2009 13:42:59 -0700
Cite this page as followsStatistical Computations at FreeStatistics.org, Office for Research Development and Education, URL https://freestatistics.org/blog/index.php?v=date/2009/Nov/25/t1259181853ho65fvcg0nahskf.htm/, Retrieved Tue, 07 May 2024 11:25:16 +0000
Statistical Computations at FreeStatistics.org, Office for Research Development and Education, URL https://freestatistics.org/blog/index.php?pk=59633, Retrieved Tue, 07 May 2024 11:25:16 +0000
QR Codes:

Original text written by user:
IsPrivate?No (this computation is public)
User-defined keywords
Estimated Impact105
Family? (F = Feedback message, R = changed R code, M = changed R Module, P = changed Parameters, D = changed Data)
-     [Univariate Explorative Data Analysis] [Run Sequence gebo...] [2008-12-12 13:32:37] [76963dc1903f0f612b6153510a3818cf]
- R  D  [Univariate Explorative Data Analysis] [Run Sequence gebo...] [2008-12-17 12:14:40] [76963dc1903f0f612b6153510a3818cf]
-         [Univariate Explorative Data Analysis] [Run Sequence Plot...] [2008-12-22 18:19:51] [1ce0d16c8f4225c977b42c8fa93bc163]
- RMP       [(Partial) Autocorrelation Function] [Identifying Integ...] [2009-11-22 12:16:10] [b98453cac15ba1066b407e146608df68]
- R PD          [(Partial) Autocorrelation Function] [WS08 - PACF d = 1...] [2009-11-25 20:42:59] [0cc924834281808eda7297686c82928f] [Current]
Feedback Forum

Post a new message
Dataseries X:
423.4
404.1
500
472.6
496.1
562
434.8
538.2
577.6
518.1
625.2
561.2
523.3
536.1
607.3
637.3
606.9
652.9
617.2
670.4
729.9
677.2
710
844.3
748.2
653.9
742.6
854.2
808.4
1819
1936.5
1966.1
2083.1
1620.1
1527.6
1795
1685.1
1851.8
2164.4
1981.8
1726.5
2144.6
1758.2
1672.9
1837.3
1596.1
1446
1898.4
1964.1
1755.9
2255.3
1881.2
2117.9
1656.5
1544.1
2098.9
2133.3
1963.5
1801.2
2365.4
1936.5
1667.6
1983.5
2058.6
2448.3
1858.1
1625.4
2130.6
2515.7
2230.2
2086.9
2235
2100.2
2288.6
2490
2573.7
2543.8
2004.7
2390
2338.4
2724.5
2292.5
2386
2477.9
2337
2605.1
2560.8
2839.3
2407.2
2085.2
2735.6
2798.7
3053.2
2405
2471.9
2727.3
2790.7
2385.4
3206.6
2705.6
3518.4
1954.9
2584.3
2535.8
2685.9
2866
2236.6
2934.9
2668.6
2371.2
3165.9
2887.2
3112.2
2671.2
2432.6
2812.3
3095.7
2862.9
2607.3
2862.5


Summary of computational transaction
Raw Inputview raw input (R code)
Raw Outputview raw output of R engine
Computing time1 seconds
R Server'Gwilym Jenkins' @ 72.249.127.135

\begin{tabular}{lllllllll}
\hline
Summary of computational transaction \tabularnewline
Raw Input & view raw input (R code)  \tabularnewline
Raw Output & view raw output of R engine  \tabularnewline
Computing time & 1 seconds \tabularnewline
R Server & 'Gwilym Jenkins' @ 72.249.127.135 \tabularnewline
\hline
\end{tabular}
%Source: https://freestatistics.org/blog/index.php?pk=59633&T=0

[TABLE]
[ROW][C]Summary of computational transaction[/C][/ROW]
[ROW][C]Raw Input[/C][C]view raw input (R code) [/C][/ROW]
[ROW][C]Raw Output[/C][C]view raw output of R engine [/C][/ROW]
[ROW][C]Computing time[/C][C]1 seconds[/C][/ROW]
[ROW][C]R Server[/C][C]'Gwilym Jenkins' @ 72.249.127.135[/C][/ROW]
[/TABLE]
Source: https://freestatistics.org/blog/index.php?pk=59633&T=0

Globally Unique Identifier (entire table): ba.freestatistics.org/blog/index.php?pk=59633&T=0

As an alternative you can also use a QR Code:  

The GUIDs for individual cells are displayed in the table below:

Summary of computational transaction
Raw Inputview raw input (R code)
Raw Outputview raw output of R engine
Computing time1 seconds
R Server'Gwilym Jenkins' @ 72.249.127.135


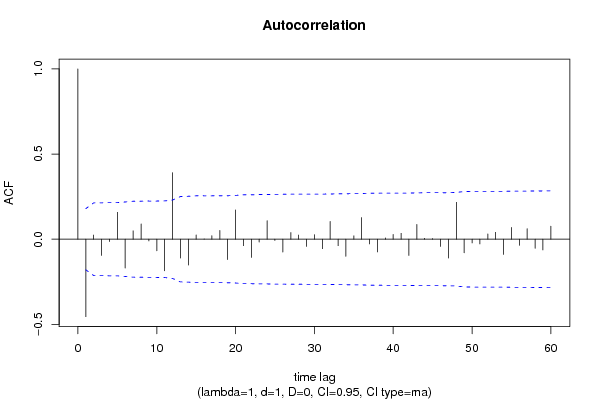
Autocorrelation Function
Time lag kACF(k)T-STATP-value
1-0.454769-4.96091e-06
20.024490.26710.394908
3-0.095358-1.04020.150171
4-0.013465-0.14690.441735
50.1582551.72640.043439
6-0.169238-1.84620.033676
70.0492910.53770.295893
80.0896580.97810.165016
9-0.010132-0.11050.45609
10-0.068186-0.74380.229226
11-0.185799-2.02680.022458
120.3910514.26592e-05
13-0.110612-1.20660.114984
14-0.151454-1.65220.050569
150.0250020.27270.392762
160.0014980.01630.493493
170.0209420.22850.409843
180.0516350.56330.287155
19-0.119154-1.29980.098087
200.1717351.87340.031733
21-0.037981-0.41430.339691
22-0.106997-1.16720.122731
23-0.016727-0.18250.427764
240.1089311.18830.118542
25-0.007335-0.080.468178
26-0.075212-0.82050.206794
270.0390030.42550.335629
280.0243370.26550.395546
29-0.042109-0.45940.32341
300.0264690.28870.386642
31-0.055585-0.60640.272716
320.1041151.13580.129169
33-0.038323-0.41810.338331
34-0.100423-1.09550.137758
350.0198260.21630.414571
360.1274941.39080.083442
37-0.027564-0.30070.382088
38-0.075014-0.81830.207408
390.0073440.08010.46814
400.0283680.30950.378756
410.0347440.3790.352678
42-0.094978-1.03610.151131
430.0871540.95070.171831
440.00560.06110.475694
450.0037150.04050.483871
46-0.042586-0.46460.321547
47-0.110917-1.210.114347
480.2170382.36760.009758
49-0.079709-0.86950.193157
50-0.021631-0.2360.406932
51-0.027711-0.30230.381478
520.0307980.3360.368745
530.0408150.44520.328477
54-0.089542-0.97680.165327
550.0695040.75820.224917
56-0.035988-0.39260.347664
570.0618930.67520.250437
58-0.053692-0.58570.279589
59-0.063106-0.68840.246269
600.0768640.83850.201719

\begin{tabular}{lllllllll}
\hline
Autocorrelation Function \tabularnewline
Time lag k & ACF(k) & T-STAT & P-value \tabularnewline
1 & -0.454769 & -4.9609 & 1e-06 \tabularnewline
2 & 0.02449 & 0.2671 & 0.394908 \tabularnewline
3 & -0.095358 & -1.0402 & 0.150171 \tabularnewline
4 & -0.013465 & -0.1469 & 0.441735 \tabularnewline
5 & 0.158255 & 1.7264 & 0.043439 \tabularnewline
6 & -0.169238 & -1.8462 & 0.033676 \tabularnewline
7 & 0.049291 & 0.5377 & 0.295893 \tabularnewline
8 & 0.089658 & 0.9781 & 0.165016 \tabularnewline
9 & -0.010132 & -0.1105 & 0.45609 \tabularnewline
10 & -0.068186 & -0.7438 & 0.229226 \tabularnewline
11 & -0.185799 & -2.0268 & 0.022458 \tabularnewline
12 & 0.391051 & 4.2659 & 2e-05 \tabularnewline
13 & -0.110612 & -1.2066 & 0.114984 \tabularnewline
14 & -0.151454 & -1.6522 & 0.050569 \tabularnewline
15 & 0.025002 & 0.2727 & 0.392762 \tabularnewline
16 & 0.001498 & 0.0163 & 0.493493 \tabularnewline
17 & 0.020942 & 0.2285 & 0.409843 \tabularnewline
18 & 0.051635 & 0.5633 & 0.287155 \tabularnewline
19 & -0.119154 & -1.2998 & 0.098087 \tabularnewline
20 & 0.171735 & 1.8734 & 0.031733 \tabularnewline
21 & -0.037981 & -0.4143 & 0.339691 \tabularnewline
22 & -0.106997 & -1.1672 & 0.122731 \tabularnewline
23 & -0.016727 & -0.1825 & 0.427764 \tabularnewline
24 & 0.108931 & 1.1883 & 0.118542 \tabularnewline
25 & -0.007335 & -0.08 & 0.468178 \tabularnewline
26 & -0.075212 & -0.8205 & 0.206794 \tabularnewline
27 & 0.039003 & 0.4255 & 0.335629 \tabularnewline
28 & 0.024337 & 0.2655 & 0.395546 \tabularnewline
29 & -0.042109 & -0.4594 & 0.32341 \tabularnewline
30 & 0.026469 & 0.2887 & 0.386642 \tabularnewline
31 & -0.055585 & -0.6064 & 0.272716 \tabularnewline
32 & 0.104115 & 1.1358 & 0.129169 \tabularnewline
33 & -0.038323 & -0.4181 & 0.338331 \tabularnewline
34 & -0.100423 & -1.0955 & 0.137758 \tabularnewline
35 & 0.019826 & 0.2163 & 0.414571 \tabularnewline
36 & 0.127494 & 1.3908 & 0.083442 \tabularnewline
37 & -0.027564 & -0.3007 & 0.382088 \tabularnewline
38 & -0.075014 & -0.8183 & 0.207408 \tabularnewline
39 & 0.007344 & 0.0801 & 0.46814 \tabularnewline
40 & 0.028368 & 0.3095 & 0.378756 \tabularnewline
41 & 0.034744 & 0.379 & 0.352678 \tabularnewline
42 & -0.094978 & -1.0361 & 0.151131 \tabularnewline
43 & 0.087154 & 0.9507 & 0.171831 \tabularnewline
44 & 0.0056 & 0.0611 & 0.475694 \tabularnewline
45 & 0.003715 & 0.0405 & 0.483871 \tabularnewline
46 & -0.042586 & -0.4646 & 0.321547 \tabularnewline
47 & -0.110917 & -1.21 & 0.114347 \tabularnewline
48 & 0.217038 & 2.3676 & 0.009758 \tabularnewline
49 & -0.079709 & -0.8695 & 0.193157 \tabularnewline
50 & -0.021631 & -0.236 & 0.406932 \tabularnewline
51 & -0.027711 & -0.3023 & 0.381478 \tabularnewline
52 & 0.030798 & 0.336 & 0.368745 \tabularnewline
53 & 0.040815 & 0.4452 & 0.328477 \tabularnewline
54 & -0.089542 & -0.9768 & 0.165327 \tabularnewline
55 & 0.069504 & 0.7582 & 0.224917 \tabularnewline
56 & -0.035988 & -0.3926 & 0.347664 \tabularnewline
57 & 0.061893 & 0.6752 & 0.250437 \tabularnewline
58 & -0.053692 & -0.5857 & 0.279589 \tabularnewline
59 & -0.063106 & -0.6884 & 0.246269 \tabularnewline
60 & 0.076864 & 0.8385 & 0.201719 \tabularnewline
\hline
\end{tabular}
%Source: https://freestatistics.org/blog/index.php?pk=59633&T=1

[TABLE]
[ROW][C]Autocorrelation Function[/C][/ROW]
[ROW][C]Time lag k[/C][C]ACF(k)[/C][C]T-STAT[/C][C]P-value[/C][/ROW]
[ROW][C]1[/C][C]-0.454769[/C][C]-4.9609[/C][C]1e-06[/C][/ROW]
[ROW][C]2[/C][C]0.02449[/C][C]0.2671[/C][C]0.394908[/C][/ROW]
[ROW][C]3[/C][C]-0.095358[/C][C]-1.0402[/C][C]0.150171[/C][/ROW]
[ROW][C]4[/C][C]-0.013465[/C][C]-0.1469[/C][C]0.441735[/C][/ROW]
[ROW][C]5[/C][C]0.158255[/C][C]1.7264[/C][C]0.043439[/C][/ROW]
[ROW][C]6[/C][C]-0.169238[/C][C]-1.8462[/C][C]0.033676[/C][/ROW]
[ROW][C]7[/C][C]0.049291[/C][C]0.5377[/C][C]0.295893[/C][/ROW]
[ROW][C]8[/C][C]0.089658[/C][C]0.9781[/C][C]0.165016[/C][/ROW]
[ROW][C]9[/C][C]-0.010132[/C][C]-0.1105[/C][C]0.45609[/C][/ROW]
[ROW][C]10[/C][C]-0.068186[/C][C]-0.7438[/C][C]0.229226[/C][/ROW]
[ROW][C]11[/C][C]-0.185799[/C][C]-2.0268[/C][C]0.022458[/C][/ROW]
[ROW][C]12[/C][C]0.391051[/C][C]4.2659[/C][C]2e-05[/C][/ROW]
[ROW][C]13[/C][C]-0.110612[/C][C]-1.2066[/C][C]0.114984[/C][/ROW]
[ROW][C]14[/C][C]-0.151454[/C][C]-1.6522[/C][C]0.050569[/C][/ROW]
[ROW][C]15[/C][C]0.025002[/C][C]0.2727[/C][C]0.392762[/C][/ROW]
[ROW][C]16[/C][C]0.001498[/C][C]0.0163[/C][C]0.493493[/C][/ROW]
[ROW][C]17[/C][C]0.020942[/C][C]0.2285[/C][C]0.409843[/C][/ROW]
[ROW][C]18[/C][C]0.051635[/C][C]0.5633[/C][C]0.287155[/C][/ROW]
[ROW][C]19[/C][C]-0.119154[/C][C]-1.2998[/C][C]0.098087[/C][/ROW]
[ROW][C]20[/C][C]0.171735[/C][C]1.8734[/C][C]0.031733[/C][/ROW]
[ROW][C]21[/C][C]-0.037981[/C][C]-0.4143[/C][C]0.339691[/C][/ROW]
[ROW][C]22[/C][C]-0.106997[/C][C]-1.1672[/C][C]0.122731[/C][/ROW]
[ROW][C]23[/C][C]-0.016727[/C][C]-0.1825[/C][C]0.427764[/C][/ROW]
[ROW][C]24[/C][C]0.108931[/C][C]1.1883[/C][C]0.118542[/C][/ROW]
[ROW][C]25[/C][C]-0.007335[/C][C]-0.08[/C][C]0.468178[/C][/ROW]
[ROW][C]26[/C][C]-0.075212[/C][C]-0.8205[/C][C]0.206794[/C][/ROW]
[ROW][C]27[/C][C]0.039003[/C][C]0.4255[/C][C]0.335629[/C][/ROW]
[ROW][C]28[/C][C]0.024337[/C][C]0.2655[/C][C]0.395546[/C][/ROW]
[ROW][C]29[/C][C]-0.042109[/C][C]-0.4594[/C][C]0.32341[/C][/ROW]
[ROW][C]30[/C][C]0.026469[/C][C]0.2887[/C][C]0.386642[/C][/ROW]
[ROW][C]31[/C][C]-0.055585[/C][C]-0.6064[/C][C]0.272716[/C][/ROW]
[ROW][C]32[/C][C]0.104115[/C][C]1.1358[/C][C]0.129169[/C][/ROW]
[ROW][C]33[/C][C]-0.038323[/C][C]-0.4181[/C][C]0.338331[/C][/ROW]
[ROW][C]34[/C][C]-0.100423[/C][C]-1.0955[/C][C]0.137758[/C][/ROW]
[ROW][C]35[/C][C]0.019826[/C][C]0.2163[/C][C]0.414571[/C][/ROW]
[ROW][C]36[/C][C]0.127494[/C][C]1.3908[/C][C]0.083442[/C][/ROW]
[ROW][C]37[/C][C]-0.027564[/C][C]-0.3007[/C][C]0.382088[/C][/ROW]
[ROW][C]38[/C][C]-0.075014[/C][C]-0.8183[/C][C]0.207408[/C][/ROW]
[ROW][C]39[/C][C]0.007344[/C][C]0.0801[/C][C]0.46814[/C][/ROW]
[ROW][C]40[/C][C]0.028368[/C][C]0.3095[/C][C]0.378756[/C][/ROW]
[ROW][C]41[/C][C]0.034744[/C][C]0.379[/C][C]0.352678[/C][/ROW]
[ROW][C]42[/C][C]-0.094978[/C][C]-1.0361[/C][C]0.151131[/C][/ROW]
[ROW][C]43[/C][C]0.087154[/C][C]0.9507[/C][C]0.171831[/C][/ROW]
[ROW][C]44[/C][C]0.0056[/C][C]0.0611[/C][C]0.475694[/C][/ROW]
[ROW][C]45[/C][C]0.003715[/C][C]0.0405[/C][C]0.483871[/C][/ROW]
[ROW][C]46[/C][C]-0.042586[/C][C]-0.4646[/C][C]0.321547[/C][/ROW]
[ROW][C]47[/C][C]-0.110917[/C][C]-1.21[/C][C]0.114347[/C][/ROW]
[ROW][C]48[/C][C]0.217038[/C][C]2.3676[/C][C]0.009758[/C][/ROW]
[ROW][C]49[/C][C]-0.079709[/C][C]-0.8695[/C][C]0.193157[/C][/ROW]
[ROW][C]50[/C][C]-0.021631[/C][C]-0.236[/C][C]0.406932[/C][/ROW]
[ROW][C]51[/C][C]-0.027711[/C][C]-0.3023[/C][C]0.381478[/C][/ROW]
[ROW][C]52[/C][C]0.030798[/C][C]0.336[/C][C]0.368745[/C][/ROW]
[ROW][C]53[/C][C]0.040815[/C][C]0.4452[/C][C]0.328477[/C][/ROW]
[ROW][C]54[/C][C]-0.089542[/C][C]-0.9768[/C][C]0.165327[/C][/ROW]
[ROW][C]55[/C][C]0.069504[/C][C]0.7582[/C][C]0.224917[/C][/ROW]
[ROW][C]56[/C][C]-0.035988[/C][C]-0.3926[/C][C]0.347664[/C][/ROW]
[ROW][C]57[/C][C]0.061893[/C][C]0.6752[/C][C]0.250437[/C][/ROW]
[ROW][C]58[/C][C]-0.053692[/C][C]-0.5857[/C][C]0.279589[/C][/ROW]
[ROW][C]59[/C][C]-0.063106[/C][C]-0.6884[/C][C]0.246269[/C][/ROW]
[ROW][C]60[/C][C]0.076864[/C][C]0.8385[/C][C]0.201719[/C][/ROW]
[/TABLE]
Source: https://freestatistics.org/blog/index.php?pk=59633&T=1

Globally Unique Identifier (entire table): ba.freestatistics.org/blog/index.php?pk=59633&T=1

As an alternative you can also use a QR Code:  

The GUIDs for individual cells are displayed in the table below:

Autocorrelation Function
Time lag kACF(k)T-STATP-value
1-0.454769-4.96091e-06
20.024490.26710.394908
3-0.095358-1.04020.150171
4-0.013465-0.14690.441735
50.1582551.72640.043439
6-0.169238-1.84620.033676
70.0492910.53770.295893
80.0896580.97810.165016
9-0.010132-0.11050.45609
10-0.068186-0.74380.229226
11-0.185799-2.02680.022458
120.3910514.26592e-05
13-0.110612-1.20660.114984
14-0.151454-1.65220.050569
150.0250020.27270.392762
160.0014980.01630.493493
170.0209420.22850.409843
180.0516350.56330.287155
19-0.119154-1.29980.098087
200.1717351.87340.031733
21-0.037981-0.41430.339691
22-0.106997-1.16720.122731
23-0.016727-0.18250.427764
240.1089311.18830.118542
25-0.007335-0.080.468178
26-0.075212-0.82050.206794
270.0390030.42550.335629
280.0243370.26550.395546
29-0.042109-0.45940.32341
300.0264690.28870.386642
31-0.055585-0.60640.272716
320.1041151.13580.129169
33-0.038323-0.41810.338331
34-0.100423-1.09550.137758
350.0198260.21630.414571
360.1274941.39080.083442
37-0.027564-0.30070.382088
38-0.075014-0.81830.207408
390.0073440.08010.46814
400.0283680.30950.378756
410.0347440.3790.352678
42-0.094978-1.03610.151131
430.0871540.95070.171831
440.00560.06110.475694
450.0037150.04050.483871
46-0.042586-0.46460.321547
47-0.110917-1.210.114347
480.2170382.36760.009758
49-0.079709-0.86950.193157
50-0.021631-0.2360.406932
51-0.027711-0.30230.381478
520.0307980.3360.368745
530.0408150.44520.328477
54-0.089542-0.97680.165327
550.0695040.75820.224917
56-0.035988-0.39260.347664
570.0618930.67520.250437
58-0.053692-0.58570.279589
59-0.063106-0.68840.246269
600.0768640.83850.201719


Partial Autocorrelation Function
Time lag kPACF(k)T-STATP-value
1-0.454769-4.96091e-06
2-0.229865-2.50750.006753
3-0.24784-2.70360.003932
4-0.249483-2.72150.003737
50.0024170.02640.489504
6-0.150061-1.6370.052139
7-0.137595-1.5010.068004
80.0627050.6840.247642
90.0914220.99730.160321
10-0.02944-0.32120.374329
11-0.277265-3.02460.001525
120.2228922.43150.008264
130.2014632.19770.014953
14-0.159768-1.74290.04197
15-0.078931-0.8610.195474
160.0349660.38140.351781
17-0.239403-2.61160.005086
18-0.017957-0.19590.422516
190.0194160.21180.41631
20-0.00287-0.03130.48754
21-0.009934-0.10840.456944
220.0060370.06590.473802
230.0400340.43670.331555
24-0.026169-0.28550.387889
25-0.092147-1.00520.158418
260.0153360.16730.433712
270.0452590.49370.311206
28-0.020315-0.22160.412497
29-0.029351-0.32020.374696
30-0.04824-0.52620.299853
31-0.034012-0.3710.355637
320.007680.08380.466684
33-0.055163-0.60180.274242
34-0.072227-0.78790.216159
35-0.071177-0.77650.219511
360.04110.44830.32736
370.1016641.1090.134829
38-0.044338-0.48370.314753
39-0.084261-0.91920.179931
40-0.010558-0.11520.454253
410.068420.74640.228458
42-0.079315-0.86520.194329
430.0865590.94420.17348
440.0519230.56640.286089
45-0.04557-0.49710.310012
460.0832780.90850.182738
47-0.064926-0.70830.240086
48-0.04161-0.45390.32536
49-0.001738-0.0190.492454
500.0310750.3390.367609
51-0.005966-0.06510.47411
520.005980.06520.474047
53-0.015898-0.17340.431305
54-0.016803-0.18330.427437
550.0121590.13260.447353
56-0.058796-0.64140.261251
570.0302910.33040.370824
580.0096020.10470.458376
590.0167060.18220.427852
60-0.042234-0.46070.32292

\begin{tabular}{lllllllll}
\hline
Partial Autocorrelation Function \tabularnewline
Time lag k & PACF(k) & T-STAT & P-value \tabularnewline
1 & -0.454769 & -4.9609 & 1e-06 \tabularnewline
2 & -0.229865 & -2.5075 & 0.006753 \tabularnewline
3 & -0.24784 & -2.7036 & 0.003932 \tabularnewline
4 & -0.249483 & -2.7215 & 0.003737 \tabularnewline
5 & 0.002417 & 0.0264 & 0.489504 \tabularnewline
6 & -0.150061 & -1.637 & 0.052139 \tabularnewline
7 & -0.137595 & -1.501 & 0.068004 \tabularnewline
8 & 0.062705 & 0.684 & 0.247642 \tabularnewline
9 & 0.091422 & 0.9973 & 0.160321 \tabularnewline
10 & -0.02944 & -0.3212 & 0.374329 \tabularnewline
11 & -0.277265 & -3.0246 & 0.001525 \tabularnewline
12 & 0.222892 & 2.4315 & 0.008264 \tabularnewline
13 & 0.201463 & 2.1977 & 0.014953 \tabularnewline
14 & -0.159768 & -1.7429 & 0.04197 \tabularnewline
15 & -0.078931 & -0.861 & 0.195474 \tabularnewline
16 & 0.034966 & 0.3814 & 0.351781 \tabularnewline
17 & -0.239403 & -2.6116 & 0.005086 \tabularnewline
18 & -0.017957 & -0.1959 & 0.422516 \tabularnewline
19 & 0.019416 & 0.2118 & 0.41631 \tabularnewline
20 & -0.00287 & -0.0313 & 0.48754 \tabularnewline
21 & -0.009934 & -0.1084 & 0.456944 \tabularnewline
22 & 0.006037 & 0.0659 & 0.473802 \tabularnewline
23 & 0.040034 & 0.4367 & 0.331555 \tabularnewline
24 & -0.026169 & -0.2855 & 0.387889 \tabularnewline
25 & -0.092147 & -1.0052 & 0.158418 \tabularnewline
26 & 0.015336 & 0.1673 & 0.433712 \tabularnewline
27 & 0.045259 & 0.4937 & 0.311206 \tabularnewline
28 & -0.020315 & -0.2216 & 0.412497 \tabularnewline
29 & -0.029351 & -0.3202 & 0.374696 \tabularnewline
30 & -0.04824 & -0.5262 & 0.299853 \tabularnewline
31 & -0.034012 & -0.371 & 0.355637 \tabularnewline
32 & 0.00768 & 0.0838 & 0.466684 \tabularnewline
33 & -0.055163 & -0.6018 & 0.274242 \tabularnewline
34 & -0.072227 & -0.7879 & 0.216159 \tabularnewline
35 & -0.071177 & -0.7765 & 0.219511 \tabularnewline
36 & 0.0411 & 0.4483 & 0.32736 \tabularnewline
37 & 0.101664 & 1.109 & 0.134829 \tabularnewline
38 & -0.044338 & -0.4837 & 0.314753 \tabularnewline
39 & -0.084261 & -0.9192 & 0.179931 \tabularnewline
40 & -0.010558 & -0.1152 & 0.454253 \tabularnewline
41 & 0.06842 & 0.7464 & 0.228458 \tabularnewline
42 & -0.079315 & -0.8652 & 0.194329 \tabularnewline
43 & 0.086559 & 0.9442 & 0.17348 \tabularnewline
44 & 0.051923 & 0.5664 & 0.286089 \tabularnewline
45 & -0.04557 & -0.4971 & 0.310012 \tabularnewline
46 & 0.083278 & 0.9085 & 0.182738 \tabularnewline
47 & -0.064926 & -0.7083 & 0.240086 \tabularnewline
48 & -0.04161 & -0.4539 & 0.32536 \tabularnewline
49 & -0.001738 & -0.019 & 0.492454 \tabularnewline
50 & 0.031075 & 0.339 & 0.367609 \tabularnewline
51 & -0.005966 & -0.0651 & 0.47411 \tabularnewline
52 & 0.00598 & 0.0652 & 0.474047 \tabularnewline
53 & -0.015898 & -0.1734 & 0.431305 \tabularnewline
54 & -0.016803 & -0.1833 & 0.427437 \tabularnewline
55 & 0.012159 & 0.1326 & 0.447353 \tabularnewline
56 & -0.058796 & -0.6414 & 0.261251 \tabularnewline
57 & 0.030291 & 0.3304 & 0.370824 \tabularnewline
58 & 0.009602 & 0.1047 & 0.458376 \tabularnewline
59 & 0.016706 & 0.1822 & 0.427852 \tabularnewline
60 & -0.042234 & -0.4607 & 0.32292 \tabularnewline
\hline
\end{tabular}
%Source: https://freestatistics.org/blog/index.php?pk=59633&T=2

[TABLE]
[ROW][C]Partial Autocorrelation Function[/C][/ROW]
[ROW][C]Time lag k[/C][C]PACF(k)[/C][C]T-STAT[/C][C]P-value[/C][/ROW]
[ROW][C]1[/C][C]-0.454769[/C][C]-4.9609[/C][C]1e-06[/C][/ROW]
[ROW][C]2[/C][C]-0.229865[/C][C]-2.5075[/C][C]0.006753[/C][/ROW]
[ROW][C]3[/C][C]-0.24784[/C][C]-2.7036[/C][C]0.003932[/C][/ROW]
[ROW][C]4[/C][C]-0.249483[/C][C]-2.7215[/C][C]0.003737[/C][/ROW]
[ROW][C]5[/C][C]0.002417[/C][C]0.0264[/C][C]0.489504[/C][/ROW]
[ROW][C]6[/C][C]-0.150061[/C][C]-1.637[/C][C]0.052139[/C][/ROW]
[ROW][C]7[/C][C]-0.137595[/C][C]-1.501[/C][C]0.068004[/C][/ROW]
[ROW][C]8[/C][C]0.062705[/C][C]0.684[/C][C]0.247642[/C][/ROW]
[ROW][C]9[/C][C]0.091422[/C][C]0.9973[/C][C]0.160321[/C][/ROW]
[ROW][C]10[/C][C]-0.02944[/C][C]-0.3212[/C][C]0.374329[/C][/ROW]
[ROW][C]11[/C][C]-0.277265[/C][C]-3.0246[/C][C]0.001525[/C][/ROW]
[ROW][C]12[/C][C]0.222892[/C][C]2.4315[/C][C]0.008264[/C][/ROW]
[ROW][C]13[/C][C]0.201463[/C][C]2.1977[/C][C]0.014953[/C][/ROW]
[ROW][C]14[/C][C]-0.159768[/C][C]-1.7429[/C][C]0.04197[/C][/ROW]
[ROW][C]15[/C][C]-0.078931[/C][C]-0.861[/C][C]0.195474[/C][/ROW]
[ROW][C]16[/C][C]0.034966[/C][C]0.3814[/C][C]0.351781[/C][/ROW]
[ROW][C]17[/C][C]-0.239403[/C][C]-2.6116[/C][C]0.005086[/C][/ROW]
[ROW][C]18[/C][C]-0.017957[/C][C]-0.1959[/C][C]0.422516[/C][/ROW]
[ROW][C]19[/C][C]0.019416[/C][C]0.2118[/C][C]0.41631[/C][/ROW]
[ROW][C]20[/C][C]-0.00287[/C][C]-0.0313[/C][C]0.48754[/C][/ROW]
[ROW][C]21[/C][C]-0.009934[/C][C]-0.1084[/C][C]0.456944[/C][/ROW]
[ROW][C]22[/C][C]0.006037[/C][C]0.0659[/C][C]0.473802[/C][/ROW]
[ROW][C]23[/C][C]0.040034[/C][C]0.4367[/C][C]0.331555[/C][/ROW]
[ROW][C]24[/C][C]-0.026169[/C][C]-0.2855[/C][C]0.387889[/C][/ROW]
[ROW][C]25[/C][C]-0.092147[/C][C]-1.0052[/C][C]0.158418[/C][/ROW]
[ROW][C]26[/C][C]0.015336[/C][C]0.1673[/C][C]0.433712[/C][/ROW]
[ROW][C]27[/C][C]0.045259[/C][C]0.4937[/C][C]0.311206[/C][/ROW]
[ROW][C]28[/C][C]-0.020315[/C][C]-0.2216[/C][C]0.412497[/C][/ROW]
[ROW][C]29[/C][C]-0.029351[/C][C]-0.3202[/C][C]0.374696[/C][/ROW]
[ROW][C]30[/C][C]-0.04824[/C][C]-0.5262[/C][C]0.299853[/C][/ROW]
[ROW][C]31[/C][C]-0.034012[/C][C]-0.371[/C][C]0.355637[/C][/ROW]
[ROW][C]32[/C][C]0.00768[/C][C]0.0838[/C][C]0.466684[/C][/ROW]
[ROW][C]33[/C][C]-0.055163[/C][C]-0.6018[/C][C]0.274242[/C][/ROW]
[ROW][C]34[/C][C]-0.072227[/C][C]-0.7879[/C][C]0.216159[/C][/ROW]
[ROW][C]35[/C][C]-0.071177[/C][C]-0.7765[/C][C]0.219511[/C][/ROW]
[ROW][C]36[/C][C]0.0411[/C][C]0.4483[/C][C]0.32736[/C][/ROW]
[ROW][C]37[/C][C]0.101664[/C][C]1.109[/C][C]0.134829[/C][/ROW]
[ROW][C]38[/C][C]-0.044338[/C][C]-0.4837[/C][C]0.314753[/C][/ROW]
[ROW][C]39[/C][C]-0.084261[/C][C]-0.9192[/C][C]0.179931[/C][/ROW]
[ROW][C]40[/C][C]-0.010558[/C][C]-0.1152[/C][C]0.454253[/C][/ROW]
[ROW][C]41[/C][C]0.06842[/C][C]0.7464[/C][C]0.228458[/C][/ROW]
[ROW][C]42[/C][C]-0.079315[/C][C]-0.8652[/C][C]0.194329[/C][/ROW]
[ROW][C]43[/C][C]0.086559[/C][C]0.9442[/C][C]0.17348[/C][/ROW]
[ROW][C]44[/C][C]0.051923[/C][C]0.5664[/C][C]0.286089[/C][/ROW]
[ROW][C]45[/C][C]-0.04557[/C][C]-0.4971[/C][C]0.310012[/C][/ROW]
[ROW][C]46[/C][C]0.083278[/C][C]0.9085[/C][C]0.182738[/C][/ROW]
[ROW][C]47[/C][C]-0.064926[/C][C]-0.7083[/C][C]0.240086[/C][/ROW]
[ROW][C]48[/C][C]-0.04161[/C][C]-0.4539[/C][C]0.32536[/C][/ROW]
[ROW][C]49[/C][C]-0.001738[/C][C]-0.019[/C][C]0.492454[/C][/ROW]
[ROW][C]50[/C][C]0.031075[/C][C]0.339[/C][C]0.367609[/C][/ROW]
[ROW][C]51[/C][C]-0.005966[/C][C]-0.0651[/C][C]0.47411[/C][/ROW]
[ROW][C]52[/C][C]0.00598[/C][C]0.0652[/C][C]0.474047[/C][/ROW]
[ROW][C]53[/C][C]-0.015898[/C][C]-0.1734[/C][C]0.431305[/C][/ROW]
[ROW][C]54[/C][C]-0.016803[/C][C]-0.1833[/C][C]0.427437[/C][/ROW]
[ROW][C]55[/C][C]0.012159[/C][C]0.1326[/C][C]0.447353[/C][/ROW]
[ROW][C]56[/C][C]-0.058796[/C][C]-0.6414[/C][C]0.261251[/C][/ROW]
[ROW][C]57[/C][C]0.030291[/C][C]0.3304[/C][C]0.370824[/C][/ROW]
[ROW][C]58[/C][C]0.009602[/C][C]0.1047[/C][C]0.458376[/C][/ROW]
[ROW][C]59[/C][C]0.016706[/C][C]0.1822[/C][C]0.427852[/C][/ROW]
[ROW][C]60[/C][C]-0.042234[/C][C]-0.4607[/C][C]0.32292[/C][/ROW]
[/TABLE]
Source: https://freestatistics.org/blog/index.php?pk=59633&T=2

Globally Unique Identifier (entire table): ba.freestatistics.org/blog/index.php?pk=59633&T=2

As an alternative you can also use a QR Code:  

The GUIDs for individual cells are displayed in the table below:

Partial Autocorrelation Function
Time lag kPACF(k)T-STATP-value
1-0.454769-4.96091e-06
2-0.229865-2.50750.006753
3-0.24784-2.70360.003932
4-0.249483-2.72150.003737
50.0024170.02640.489504
6-0.150061-1.6370.052139
7-0.137595-1.5010.068004
80.0627050.6840.247642
90.0914220.99730.160321
10-0.02944-0.32120.374329
11-0.277265-3.02460.001525
120.2228922.43150.008264
130.2014632.19770.014953
14-0.159768-1.74290.04197
15-0.078931-0.8610.195474
160.0349660.38140.351781
17-0.239403-2.61160.005086
18-0.017957-0.19590.422516
190.0194160.21180.41631
20-0.00287-0.03130.48754
21-0.009934-0.10840.456944
220.0060370.06590.473802
230.0400340.43670.331555
24-0.026169-0.28550.387889
25-0.092147-1.00520.158418
260.0153360.16730.433712
270.0452590.49370.311206
28-0.020315-0.22160.412497
29-0.029351-0.32020.374696
30-0.04824-0.52620.299853
31-0.034012-0.3710.355637
320.007680.08380.466684
33-0.055163-0.60180.274242
34-0.072227-0.78790.216159
35-0.071177-0.77650.219511
360.04110.44830.32736
370.1016641.1090.134829
38-0.044338-0.48370.314753
39-0.084261-0.91920.179931
40-0.010558-0.11520.454253
410.068420.74640.228458
42-0.079315-0.86520.194329
430.0865590.94420.17348
440.0519230.56640.286089
45-0.04557-0.49710.310012
460.0832780.90850.182738
47-0.064926-0.70830.240086
48-0.04161-0.45390.32536
49-0.001738-0.0190.492454
500.0310750.3390.367609
51-0.005966-0.06510.47411
520.005980.06520.474047
53-0.015898-0.17340.431305
54-0.016803-0.18330.427437
550.0121590.13260.447353
56-0.058796-0.64140.261251
570.0302910.33040.370824
580.0096020.10470.458376
590.0167060.18220.427852
60-0.042234-0.46070.32292


Parameters (Session):
par1 = 60 ; par2 = 1 ; par3 = 1 ; par4 = 0 ; par5 = 12 ; par6 = MA ; par7 = 0.95 ;
Parameters (R input):
par1 = 60 ; par2 = 1 ; par3 = 1 ; par4 = 0 ; par5 = 12 ; par6 = MA ; par7 = 0.95 ;
R code (references can be found in the software module):
if (par1 == 'Default') {
par1 = 10*log10(length(x))
} else {
par1 <- as.numeric(par1)
}
par2 <- as.numeric(par2)
par3 <- as.numeric(par3)
par4 <- as.numeric(par4)
par5 <- as.numeric(par5)
if (par6 == 'White Noise') par6 <- 'white' else par6 <- 'ma'
par7 <- as.numeric(par7)
if (par2 == 0) {
x <- log(x)
} else {
x <- (x ^ par2 - 1) / par2
}
if (par3 > 0) x <- diff(x,lag=1,difference=par3)
if (par4 > 0) x <- diff(x,lag=par5,difference=par4)
bitmap(file='pic1.png')
racf <- acf(x, par1, main='Autocorrelation', xlab='time lag', ylab='ACF', ci.type=par6, ci=par7, sub=paste('(lambda=',par2,', d=',par3,', D=',par4,', CI=', par7, ', CI type=',par6,')',sep=''))
dev.off()
bitmap(file='pic2.png')
rpacf <- pacf(x,par1,main='Partial Autocorrelation',xlab='lags',ylab='PACF')
dev.off()
(myacf <- c(racf$acf))
(mypacf <- c(rpacf$acf))
lengthx <- length(x)
sqrtn <- sqrt(lengthx)
load(file='createtable')
a<-table.start()
a<-table.row.start(a)
a<-table.element(a,'Autocorrelation Function',4,TRUE)
a<-table.row.end(a)
a<-table.row.start(a)
a<-table.element(a,'Time lag k',header=TRUE)
a<-table.element(a,hyperlink('basics.htm','ACF(k)','click here for more information about the Autocorrelation Function'),header=TRUE)
a<-table.element(a,'T-STAT',header=TRUE)
a<-table.element(a,'P-value',header=TRUE)
a<-table.row.end(a)
for (i in 2:(par1+1)) {
a<-table.row.start(a)
a<-table.element(a,i-1,header=TRUE)
a<-table.element(a,round(myacf[i],6))
mytstat <- myacf[i]*sqrtn
a<-table.element(a,round(mytstat,4))
a<-table.element(a,round(1-pt(abs(mytstat),lengthx),6))
a<-table.row.end(a)
}
a<-table.end(a)
table.save(a,file='mytable.tab')
a<-table.start()
a<-table.row.start(a)
a<-table.element(a,'Partial Autocorrelation Function',4,TRUE)
a<-table.row.end(a)
a<-table.row.start(a)
a<-table.element(a,'Time lag k',header=TRUE)
a<-table.element(a,hyperlink('basics.htm','PACF(k)','click here for more information about the Partial Autocorrelation Function'),header=TRUE)
a<-table.element(a,'T-STAT',header=TRUE)
a<-table.element(a,'P-value',header=TRUE)
a<-table.row.end(a)
for (i in 1:par1) {
a<-table.row.start(a)
a<-table.element(a,i,header=TRUE)
a<-table.element(a,round(mypacf[i],6))
mytstat <- mypacf[i]*sqrtn
a<-table.element(a,round(mytstat,4))
a<-table.element(a,round(1-pt(abs(mytstat),lengthx),6))
a<-table.row.end(a)
}
a<-table.end(a)
table.save(a,file='mytable1.tab')