Free Statistics

of Irreproducible Research!

Author's title

Author*The author of this computation has been verified*
R Software Modulerwasp_autocorrelation.wasp
Title produced by software(Partial) Autocorrelation Function
Date of computationThu, 26 Nov 2009 03:19:32 -0700
Cite this page as followsStatistical Computations at FreeStatistics.org, Office for Research Development and Education, URL https://freestatistics.org/blog/index.php?v=date/2009/Nov/26/t1259230831za2qn8hz0zrawl6.htm/, Retrieved Mon, 29 Apr 2024 04:43:54 +0000
Statistical Computations at FreeStatistics.org, Office for Research Development and Education, URL https://freestatistics.org/blog/index.php?pk=59780, Retrieved Mon, 29 Apr 2024 04:43:54 +0000
QR Codes:

Original text written by user:
IsPrivate?No (this computation is public)
User-defined keywords
Estimated Impact104
Family? (F = Feedback message, R = changed R code, M = changed R Module, P = changed Parameters, D = changed Data)
-     [Univariate Explorative Data Analysis] [Run Sequence gebo...] [2008-12-12 13:32:37] [76963dc1903f0f612b6153510a3818cf]
- R  D  [Univariate Explorative Data Analysis] [Run Sequence gebo...] [2008-12-17 12:14:40] [76963dc1903f0f612b6153510a3818cf]
-         [Univariate Explorative Data Analysis] [Run Sequence Plot...] [2008-12-22 18:19:51] [1ce0d16c8f4225c977b42c8fa93bc163]
- RMP       [(Partial) Autocorrelation Function] [Identifying Integ...] [2009-11-22 12:19:56] [b98453cac15ba1066b407e146608df68]
-   PD          [(Partial) Autocorrelation Function] [] [2009-11-26 10:19:32] [791a4a78a0a7ca497fb8791b982a539e] [Current]
Feedback Forum

Post a new message
Dataseries X:
785.8
819.3
849.4
880.4
900.1
937.2
948.9
952.6
947.3
974.2
1000.8
1032.8
1050.7
1057.3
1075.4
1118.4
1179.8
1227
1257.8
1251.5
1236.3
1170.6
1213.1
1265.5
1300.8
1348.4
1371.9
1403.3
1451.8
1474.2
1438.2
1513.6
1562.2
1546.2
1527.5
1418.7
1448.5
1492.1
1395.4
1403.7
1316.6
1274.5
1264.4
1323.9
1332.1
1250.2
1096.7
1080.8
1039.2
792
746.6
688.8
715.8
672.9
629.5
681.2
755.4
760.6
765.9
836.8
904.9


Summary of computational transaction
Raw Inputview raw input (R code)
Raw Outputview raw output of R engine
Computing time1 seconds
R Server'Gwilym Jenkins' @ 72.249.127.135

\begin{tabular}{lllllllll}
\hline
Summary of computational transaction \tabularnewline
Raw Input & view raw input (R code)  \tabularnewline
Raw Output & view raw output of R engine  \tabularnewline
Computing time & 1 seconds \tabularnewline
R Server & 'Gwilym Jenkins' @ 72.249.127.135 \tabularnewline
\hline
\end{tabular}
%Source: https://freestatistics.org/blog/index.php?pk=59780&T=0

[TABLE]
[ROW][C]Summary of computational transaction[/C][/ROW]
[ROW][C]Raw Input[/C][C]view raw input (R code) [/C][/ROW]
[ROW][C]Raw Output[/C][C]view raw output of R engine [/C][/ROW]
[ROW][C]Computing time[/C][C]1 seconds[/C][/ROW]
[ROW][C]R Server[/C][C]'Gwilym Jenkins' @ 72.249.127.135[/C][/ROW]
[/TABLE]
Source: https://freestatistics.org/blog/index.php?pk=59780&T=0

Globally Unique Identifier (entire table): ba.freestatistics.org/blog/index.php?pk=59780&T=0

As an alternative you can also use a QR Code:  

The GUIDs for individual cells are displayed in the table below:

Summary of computational transaction
Raw Inputview raw input (R code)
Raw Outputview raw output of R engine
Computing time1 seconds
R Server'Gwilym Jenkins' @ 72.249.127.135


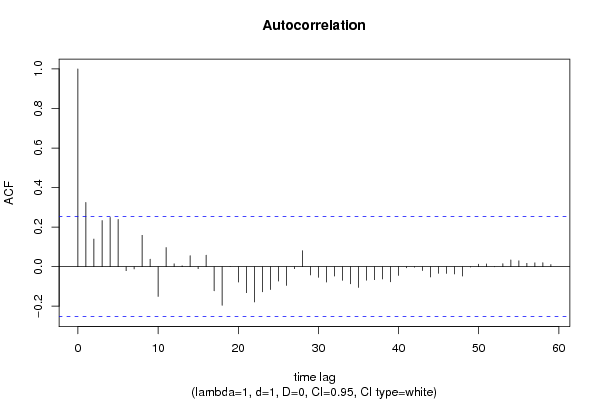
Autocorrelation Function
Time lag kACF(k)T-STATP-value
10.3245712.51410.007317
20.139581.08120.141972
30.2332971.80710.037879
40.2486551.92610.029419
50.2387711.84950.034655
6-0.020655-0.160.436711
7-0.011905-0.09220.463416
80.1587331.22950.111835
90.0379020.29360.385043
10-0.150881-1.16870.12357
110.0962740.74570.229369
120.0141680.10970.456488
130.004440.03440.48634
140.0555410.43020.334289
15-0.01043-0.08080.467938
160.0579270.44870.327631
17-0.122494-0.94880.173256
18-0.195882-1.51730.067221
19-0.000556-0.00430.498288
20-0.077906-0.60350.274241
21-0.131977-1.02230.155373
22-0.178449-1.38230.086008
23-0.127103-0.98450.164403
24-0.115911-0.89780.186429
25-0.073005-0.56550.286923
26-0.094817-0.73440.232768
27-0.010736-0.08320.466999
280.080670.62490.267214
29-0.041953-0.3250.373169
30-0.053962-0.4180.338724
31-0.078307-0.60660.273214
32-0.047702-0.36950.356528
33-0.069252-0.53640.296826
34-0.08689-0.6730.25175
35-0.104996-0.81330.209632
36-0.068829-0.53310.297952
37-0.066013-0.51130.305495
38-0.062583-0.48480.314805
39-0.077032-0.59670.276481
40-0.044416-0.3440.366008
41-0.006171-0.04780.481016
42-0.00265-0.02050.491847
43-0.019991-0.15490.438729
44-0.052375-0.40570.343206
45-0.033724-0.26120.397407
46-0.034243-0.26520.395865
47-0.036814-0.28520.388251
48-0.047817-0.37040.356199
49-0.00243-0.01880.492524
500.0123150.09540.46216
510.0139120.10780.457273
52-0.000927-0.00720.497147
530.0149560.11580.45408
540.0337430.26140.39735
550.0297480.23040.409272
560.0166720.12910.44884
570.0196190.1520.43986
580.0199680.15470.4388
590.0103220.080.46827
60NANANA

\begin{tabular}{lllllllll}
\hline
Autocorrelation Function \tabularnewline
Time lag k & ACF(k) & T-STAT & P-value \tabularnewline
1 & 0.324571 & 2.5141 & 0.007317 \tabularnewline
2 & 0.13958 & 1.0812 & 0.141972 \tabularnewline
3 & 0.233297 & 1.8071 & 0.037879 \tabularnewline
4 & 0.248655 & 1.9261 & 0.029419 \tabularnewline
5 & 0.238771 & 1.8495 & 0.034655 \tabularnewline
6 & -0.020655 & -0.16 & 0.436711 \tabularnewline
7 & -0.011905 & -0.0922 & 0.463416 \tabularnewline
8 & 0.158733 & 1.2295 & 0.111835 \tabularnewline
9 & 0.037902 & 0.2936 & 0.385043 \tabularnewline
10 & -0.150881 & -1.1687 & 0.12357 \tabularnewline
11 & 0.096274 & 0.7457 & 0.229369 \tabularnewline
12 & 0.014168 & 0.1097 & 0.456488 \tabularnewline
13 & 0.00444 & 0.0344 & 0.48634 \tabularnewline
14 & 0.055541 & 0.4302 & 0.334289 \tabularnewline
15 & -0.01043 & -0.0808 & 0.467938 \tabularnewline
16 & 0.057927 & 0.4487 & 0.327631 \tabularnewline
17 & -0.122494 & -0.9488 & 0.173256 \tabularnewline
18 & -0.195882 & -1.5173 & 0.067221 \tabularnewline
19 & -0.000556 & -0.0043 & 0.498288 \tabularnewline
20 & -0.077906 & -0.6035 & 0.274241 \tabularnewline
21 & -0.131977 & -1.0223 & 0.155373 \tabularnewline
22 & -0.178449 & -1.3823 & 0.086008 \tabularnewline
23 & -0.127103 & -0.9845 & 0.164403 \tabularnewline
24 & -0.115911 & -0.8978 & 0.186429 \tabularnewline
25 & -0.073005 & -0.5655 & 0.286923 \tabularnewline
26 & -0.094817 & -0.7344 & 0.232768 \tabularnewline
27 & -0.010736 & -0.0832 & 0.466999 \tabularnewline
28 & 0.08067 & 0.6249 & 0.267214 \tabularnewline
29 & -0.041953 & -0.325 & 0.373169 \tabularnewline
30 & -0.053962 & -0.418 & 0.338724 \tabularnewline
31 & -0.078307 & -0.6066 & 0.273214 \tabularnewline
32 & -0.047702 & -0.3695 & 0.356528 \tabularnewline
33 & -0.069252 & -0.5364 & 0.296826 \tabularnewline
34 & -0.08689 & -0.673 & 0.25175 \tabularnewline
35 & -0.104996 & -0.8133 & 0.209632 \tabularnewline
36 & -0.068829 & -0.5331 & 0.297952 \tabularnewline
37 & -0.066013 & -0.5113 & 0.305495 \tabularnewline
38 & -0.062583 & -0.4848 & 0.314805 \tabularnewline
39 & -0.077032 & -0.5967 & 0.276481 \tabularnewline
40 & -0.044416 & -0.344 & 0.366008 \tabularnewline
41 & -0.006171 & -0.0478 & 0.481016 \tabularnewline
42 & -0.00265 & -0.0205 & 0.491847 \tabularnewline
43 & -0.019991 & -0.1549 & 0.438729 \tabularnewline
44 & -0.052375 & -0.4057 & 0.343206 \tabularnewline
45 & -0.033724 & -0.2612 & 0.397407 \tabularnewline
46 & -0.034243 & -0.2652 & 0.395865 \tabularnewline
47 & -0.036814 & -0.2852 & 0.388251 \tabularnewline
48 & -0.047817 & -0.3704 & 0.356199 \tabularnewline
49 & -0.00243 & -0.0188 & 0.492524 \tabularnewline
50 & 0.012315 & 0.0954 & 0.46216 \tabularnewline
51 & 0.013912 & 0.1078 & 0.457273 \tabularnewline
52 & -0.000927 & -0.0072 & 0.497147 \tabularnewline
53 & 0.014956 & 0.1158 & 0.45408 \tabularnewline
54 & 0.033743 & 0.2614 & 0.39735 \tabularnewline
55 & 0.029748 & 0.2304 & 0.409272 \tabularnewline
56 & 0.016672 & 0.1291 & 0.44884 \tabularnewline
57 & 0.019619 & 0.152 & 0.43986 \tabularnewline
58 & 0.019968 & 0.1547 & 0.4388 \tabularnewline
59 & 0.010322 & 0.08 & 0.46827 \tabularnewline
60 & NA & NA & NA \tabularnewline
\hline
\end{tabular}
%Source: https://freestatistics.org/blog/index.php?pk=59780&T=1

[TABLE]
[ROW][C]Autocorrelation Function[/C][/ROW]
[ROW][C]Time lag k[/C][C]ACF(k)[/C][C]T-STAT[/C][C]P-value[/C][/ROW]
[ROW][C]1[/C][C]0.324571[/C][C]2.5141[/C][C]0.007317[/C][/ROW]
[ROW][C]2[/C][C]0.13958[/C][C]1.0812[/C][C]0.141972[/C][/ROW]
[ROW][C]3[/C][C]0.233297[/C][C]1.8071[/C][C]0.037879[/C][/ROW]
[ROW][C]4[/C][C]0.248655[/C][C]1.9261[/C][C]0.029419[/C][/ROW]
[ROW][C]5[/C][C]0.238771[/C][C]1.8495[/C][C]0.034655[/C][/ROW]
[ROW][C]6[/C][C]-0.020655[/C][C]-0.16[/C][C]0.436711[/C][/ROW]
[ROW][C]7[/C][C]-0.011905[/C][C]-0.0922[/C][C]0.463416[/C][/ROW]
[ROW][C]8[/C][C]0.158733[/C][C]1.2295[/C][C]0.111835[/C][/ROW]
[ROW][C]9[/C][C]0.037902[/C][C]0.2936[/C][C]0.385043[/C][/ROW]
[ROW][C]10[/C][C]-0.150881[/C][C]-1.1687[/C][C]0.12357[/C][/ROW]
[ROW][C]11[/C][C]0.096274[/C][C]0.7457[/C][C]0.229369[/C][/ROW]
[ROW][C]12[/C][C]0.014168[/C][C]0.1097[/C][C]0.456488[/C][/ROW]
[ROW][C]13[/C][C]0.00444[/C][C]0.0344[/C][C]0.48634[/C][/ROW]
[ROW][C]14[/C][C]0.055541[/C][C]0.4302[/C][C]0.334289[/C][/ROW]
[ROW][C]15[/C][C]-0.01043[/C][C]-0.0808[/C][C]0.467938[/C][/ROW]
[ROW][C]16[/C][C]0.057927[/C][C]0.4487[/C][C]0.327631[/C][/ROW]
[ROW][C]17[/C][C]-0.122494[/C][C]-0.9488[/C][C]0.173256[/C][/ROW]
[ROW][C]18[/C][C]-0.195882[/C][C]-1.5173[/C][C]0.067221[/C][/ROW]
[ROW][C]19[/C][C]-0.000556[/C][C]-0.0043[/C][C]0.498288[/C][/ROW]
[ROW][C]20[/C][C]-0.077906[/C][C]-0.6035[/C][C]0.274241[/C][/ROW]
[ROW][C]21[/C][C]-0.131977[/C][C]-1.0223[/C][C]0.155373[/C][/ROW]
[ROW][C]22[/C][C]-0.178449[/C][C]-1.3823[/C][C]0.086008[/C][/ROW]
[ROW][C]23[/C][C]-0.127103[/C][C]-0.9845[/C][C]0.164403[/C][/ROW]
[ROW][C]24[/C][C]-0.115911[/C][C]-0.8978[/C][C]0.186429[/C][/ROW]
[ROW][C]25[/C][C]-0.073005[/C][C]-0.5655[/C][C]0.286923[/C][/ROW]
[ROW][C]26[/C][C]-0.094817[/C][C]-0.7344[/C][C]0.232768[/C][/ROW]
[ROW][C]27[/C][C]-0.010736[/C][C]-0.0832[/C][C]0.466999[/C][/ROW]
[ROW][C]28[/C][C]0.08067[/C][C]0.6249[/C][C]0.267214[/C][/ROW]
[ROW][C]29[/C][C]-0.041953[/C][C]-0.325[/C][C]0.373169[/C][/ROW]
[ROW][C]30[/C][C]-0.053962[/C][C]-0.418[/C][C]0.338724[/C][/ROW]
[ROW][C]31[/C][C]-0.078307[/C][C]-0.6066[/C][C]0.273214[/C][/ROW]
[ROW][C]32[/C][C]-0.047702[/C][C]-0.3695[/C][C]0.356528[/C][/ROW]
[ROW][C]33[/C][C]-0.069252[/C][C]-0.5364[/C][C]0.296826[/C][/ROW]
[ROW][C]34[/C][C]-0.08689[/C][C]-0.673[/C][C]0.25175[/C][/ROW]
[ROW][C]35[/C][C]-0.104996[/C][C]-0.8133[/C][C]0.209632[/C][/ROW]
[ROW][C]36[/C][C]-0.068829[/C][C]-0.5331[/C][C]0.297952[/C][/ROW]
[ROW][C]37[/C][C]-0.066013[/C][C]-0.5113[/C][C]0.305495[/C][/ROW]
[ROW][C]38[/C][C]-0.062583[/C][C]-0.4848[/C][C]0.314805[/C][/ROW]
[ROW][C]39[/C][C]-0.077032[/C][C]-0.5967[/C][C]0.276481[/C][/ROW]
[ROW][C]40[/C][C]-0.044416[/C][C]-0.344[/C][C]0.366008[/C][/ROW]
[ROW][C]41[/C][C]-0.006171[/C][C]-0.0478[/C][C]0.481016[/C][/ROW]
[ROW][C]42[/C][C]-0.00265[/C][C]-0.0205[/C][C]0.491847[/C][/ROW]
[ROW][C]43[/C][C]-0.019991[/C][C]-0.1549[/C][C]0.438729[/C][/ROW]
[ROW][C]44[/C][C]-0.052375[/C][C]-0.4057[/C][C]0.343206[/C][/ROW]
[ROW][C]45[/C][C]-0.033724[/C][C]-0.2612[/C][C]0.397407[/C][/ROW]
[ROW][C]46[/C][C]-0.034243[/C][C]-0.2652[/C][C]0.395865[/C][/ROW]
[ROW][C]47[/C][C]-0.036814[/C][C]-0.2852[/C][C]0.388251[/C][/ROW]
[ROW][C]48[/C][C]-0.047817[/C][C]-0.3704[/C][C]0.356199[/C][/ROW]
[ROW][C]49[/C][C]-0.00243[/C][C]-0.0188[/C][C]0.492524[/C][/ROW]
[ROW][C]50[/C][C]0.012315[/C][C]0.0954[/C][C]0.46216[/C][/ROW]
[ROW][C]51[/C][C]0.013912[/C][C]0.1078[/C][C]0.457273[/C][/ROW]
[ROW][C]52[/C][C]-0.000927[/C][C]-0.0072[/C][C]0.497147[/C][/ROW]
[ROW][C]53[/C][C]0.014956[/C][C]0.1158[/C][C]0.45408[/C][/ROW]
[ROW][C]54[/C][C]0.033743[/C][C]0.2614[/C][C]0.39735[/C][/ROW]
[ROW][C]55[/C][C]0.029748[/C][C]0.2304[/C][C]0.409272[/C][/ROW]
[ROW][C]56[/C][C]0.016672[/C][C]0.1291[/C][C]0.44884[/C][/ROW]
[ROW][C]57[/C][C]0.019619[/C][C]0.152[/C][C]0.43986[/C][/ROW]
[ROW][C]58[/C][C]0.019968[/C][C]0.1547[/C][C]0.4388[/C][/ROW]
[ROW][C]59[/C][C]0.010322[/C][C]0.08[/C][C]0.46827[/C][/ROW]
[ROW][C]60[/C][C]NA[/C][C]NA[/C][C]NA[/C][/ROW]
[/TABLE]
Source: https://freestatistics.org/blog/index.php?pk=59780&T=1

Globally Unique Identifier (entire table): ba.freestatistics.org/blog/index.php?pk=59780&T=1

As an alternative you can also use a QR Code:  

The GUIDs for individual cells are displayed in the table below:

Autocorrelation Function
Time lag kACF(k)T-STATP-value
10.3245712.51410.007317
20.139581.08120.141972
30.2332971.80710.037879
40.2486551.92610.029419
50.2387711.84950.034655
6-0.020655-0.160.436711
7-0.011905-0.09220.463416
80.1587331.22950.111835
90.0379020.29360.385043
10-0.150881-1.16870.12357
110.0962740.74570.229369
120.0141680.10970.456488
130.004440.03440.48634
140.0555410.43020.334289
15-0.01043-0.08080.467938
160.0579270.44870.327631
17-0.122494-0.94880.173256
18-0.195882-1.51730.067221
19-0.000556-0.00430.498288
20-0.077906-0.60350.274241
21-0.131977-1.02230.155373
22-0.178449-1.38230.086008
23-0.127103-0.98450.164403
24-0.115911-0.89780.186429
25-0.073005-0.56550.286923
26-0.094817-0.73440.232768
27-0.010736-0.08320.466999
280.080670.62490.267214
29-0.041953-0.3250.373169
30-0.053962-0.4180.338724
31-0.078307-0.60660.273214
32-0.047702-0.36950.356528
33-0.069252-0.53640.296826
34-0.08689-0.6730.25175
35-0.104996-0.81330.209632
36-0.068829-0.53310.297952
37-0.066013-0.51130.305495
38-0.062583-0.48480.314805
39-0.077032-0.59670.276481
40-0.044416-0.3440.366008
41-0.006171-0.04780.481016
42-0.00265-0.02050.491847
43-0.019991-0.15490.438729
44-0.052375-0.40570.343206
45-0.033724-0.26120.397407
46-0.034243-0.26520.395865
47-0.036814-0.28520.388251
48-0.047817-0.37040.356199
49-0.00243-0.01880.492524
500.0123150.09540.46216
510.0139120.10780.457273
52-0.000927-0.00720.497147
530.0149560.11580.45408
540.0337430.26140.39735
550.0297480.23040.409272
560.0166720.12910.44884
570.0196190.1520.43986
580.0199680.15470.4388
590.0103220.080.46827
60NANANA


Partial Autocorrelation Function
Time lag kPACF(k)T-STATP-value
10.3245712.51410.007317
20.0382640.29640.383977
30.1984771.53740.064727
40.1357441.05150.14863
50.1288390.9980.161148
6-0.200019-1.54930.063279
7-0.038324-0.29690.3838
80.1099380.85160.198918
9-0.058704-0.45470.325475
10-0.17395-1.34740.091457
110.2560681.98350.025947
12-0.119781-0.92780.17861
130.0084960.06580.473874
140.1321791.02390.155008
15-0.018036-0.13970.444681
16-0.096472-0.74730.22891
17-0.13957-1.08110.141989
18-0.108842-0.84310.201263
190.0291940.22610.410932
20-0.070557-0.54650.293364
210.0868080.67240.251951
22-0.154706-1.19830.117747
230.0235880.18270.427821
24-0.1002-0.77610.220356
250.0917530.71070.240008
260.0169840.13160.447887
270.0372340.28840.387012
280.0991550.7680.222735
29-0.030477-0.23610.407091
30-0.163901-1.26960.104569
310.0027590.02140.491509
32-0.071596-0.55460.290622
33-0.038839-0.30080.382285
34-0.018983-0.1470.441796
35-0.00333-0.02580.489752
36-0.033563-0.260.397887
370.0204520.15840.437329
380.0755670.58530.280257
39-0.144446-1.11890.133827
40-0.0215-0.16650.434147
410.0138260.10710.457536
42-0.073287-0.56770.286185
430.01750.13560.446315
44-0.027667-0.21430.415517
450.0082870.06420.474517
46-0.034633-0.26830.394708
47-0.024703-0.19130.424449
48-0.003317-0.02570.489794
490.0221560.17160.432158
500.0779840.60410.274039
510.0100130.07760.469219
52-0.022668-0.17560.430605
53-0.030401-0.23550.407317
54-0.074577-0.57770.282825
550.009820.07610.469809
56-0.064584-0.50030.309359
57-0.035485-0.27490.392181
580.0595440.46120.323153
59-0.013815-0.1070.45757
60NANANA

\begin{tabular}{lllllllll}
\hline
Partial Autocorrelation Function \tabularnewline
Time lag k & PACF(k) & T-STAT & P-value \tabularnewline
1 & 0.324571 & 2.5141 & 0.007317 \tabularnewline
2 & 0.038264 & 0.2964 & 0.383977 \tabularnewline
3 & 0.198477 & 1.5374 & 0.064727 \tabularnewline
4 & 0.135744 & 1.0515 & 0.14863 \tabularnewline
5 & 0.128839 & 0.998 & 0.161148 \tabularnewline
6 & -0.200019 & -1.5493 & 0.063279 \tabularnewline
7 & -0.038324 & -0.2969 & 0.3838 \tabularnewline
8 & 0.109938 & 0.8516 & 0.198918 \tabularnewline
9 & -0.058704 & -0.4547 & 0.325475 \tabularnewline
10 & -0.17395 & -1.3474 & 0.091457 \tabularnewline
11 & 0.256068 & 1.9835 & 0.025947 \tabularnewline
12 & -0.119781 & -0.9278 & 0.17861 \tabularnewline
13 & 0.008496 & 0.0658 & 0.473874 \tabularnewline
14 & 0.132179 & 1.0239 & 0.155008 \tabularnewline
15 & -0.018036 & -0.1397 & 0.444681 \tabularnewline
16 & -0.096472 & -0.7473 & 0.22891 \tabularnewline
17 & -0.13957 & -1.0811 & 0.141989 \tabularnewline
18 & -0.108842 & -0.8431 & 0.201263 \tabularnewline
19 & 0.029194 & 0.2261 & 0.410932 \tabularnewline
20 & -0.070557 & -0.5465 & 0.293364 \tabularnewline
21 & 0.086808 & 0.6724 & 0.251951 \tabularnewline
22 & -0.154706 & -1.1983 & 0.117747 \tabularnewline
23 & 0.023588 & 0.1827 & 0.427821 \tabularnewline
24 & -0.1002 & -0.7761 & 0.220356 \tabularnewline
25 & 0.091753 & 0.7107 & 0.240008 \tabularnewline
26 & 0.016984 & 0.1316 & 0.447887 \tabularnewline
27 & 0.037234 & 0.2884 & 0.387012 \tabularnewline
28 & 0.099155 & 0.768 & 0.222735 \tabularnewline
29 & -0.030477 & -0.2361 & 0.407091 \tabularnewline
30 & -0.163901 & -1.2696 & 0.104569 \tabularnewline
31 & 0.002759 & 0.0214 & 0.491509 \tabularnewline
32 & -0.071596 & -0.5546 & 0.290622 \tabularnewline
33 & -0.038839 & -0.3008 & 0.382285 \tabularnewline
34 & -0.018983 & -0.147 & 0.441796 \tabularnewline
35 & -0.00333 & -0.0258 & 0.489752 \tabularnewline
36 & -0.033563 & -0.26 & 0.397887 \tabularnewline
37 & 0.020452 & 0.1584 & 0.437329 \tabularnewline
38 & 0.075567 & 0.5853 & 0.280257 \tabularnewline
39 & -0.144446 & -1.1189 & 0.133827 \tabularnewline
40 & -0.0215 & -0.1665 & 0.434147 \tabularnewline
41 & 0.013826 & 0.1071 & 0.457536 \tabularnewline
42 & -0.073287 & -0.5677 & 0.286185 \tabularnewline
43 & 0.0175 & 0.1356 & 0.446315 \tabularnewline
44 & -0.027667 & -0.2143 & 0.415517 \tabularnewline
45 & 0.008287 & 0.0642 & 0.474517 \tabularnewline
46 & -0.034633 & -0.2683 & 0.394708 \tabularnewline
47 & -0.024703 & -0.1913 & 0.424449 \tabularnewline
48 & -0.003317 & -0.0257 & 0.489794 \tabularnewline
49 & 0.022156 & 0.1716 & 0.432158 \tabularnewline
50 & 0.077984 & 0.6041 & 0.274039 \tabularnewline
51 & 0.010013 & 0.0776 & 0.469219 \tabularnewline
52 & -0.022668 & -0.1756 & 0.430605 \tabularnewline
53 & -0.030401 & -0.2355 & 0.407317 \tabularnewline
54 & -0.074577 & -0.5777 & 0.282825 \tabularnewline
55 & 0.00982 & 0.0761 & 0.469809 \tabularnewline
56 & -0.064584 & -0.5003 & 0.309359 \tabularnewline
57 & -0.035485 & -0.2749 & 0.392181 \tabularnewline
58 & 0.059544 & 0.4612 & 0.323153 \tabularnewline
59 & -0.013815 & -0.107 & 0.45757 \tabularnewline
60 & NA & NA & NA \tabularnewline
\hline
\end{tabular}
%Source: https://freestatistics.org/blog/index.php?pk=59780&T=2

[TABLE]
[ROW][C]Partial Autocorrelation Function[/C][/ROW]
[ROW][C]Time lag k[/C][C]PACF(k)[/C][C]T-STAT[/C][C]P-value[/C][/ROW]
[ROW][C]1[/C][C]0.324571[/C][C]2.5141[/C][C]0.007317[/C][/ROW]
[ROW][C]2[/C][C]0.038264[/C][C]0.2964[/C][C]0.383977[/C][/ROW]
[ROW][C]3[/C][C]0.198477[/C][C]1.5374[/C][C]0.064727[/C][/ROW]
[ROW][C]4[/C][C]0.135744[/C][C]1.0515[/C][C]0.14863[/C][/ROW]
[ROW][C]5[/C][C]0.128839[/C][C]0.998[/C][C]0.161148[/C][/ROW]
[ROW][C]6[/C][C]-0.200019[/C][C]-1.5493[/C][C]0.063279[/C][/ROW]
[ROW][C]7[/C][C]-0.038324[/C][C]-0.2969[/C][C]0.3838[/C][/ROW]
[ROW][C]8[/C][C]0.109938[/C][C]0.8516[/C][C]0.198918[/C][/ROW]
[ROW][C]9[/C][C]-0.058704[/C][C]-0.4547[/C][C]0.325475[/C][/ROW]
[ROW][C]10[/C][C]-0.17395[/C][C]-1.3474[/C][C]0.091457[/C][/ROW]
[ROW][C]11[/C][C]0.256068[/C][C]1.9835[/C][C]0.025947[/C][/ROW]
[ROW][C]12[/C][C]-0.119781[/C][C]-0.9278[/C][C]0.17861[/C][/ROW]
[ROW][C]13[/C][C]0.008496[/C][C]0.0658[/C][C]0.473874[/C][/ROW]
[ROW][C]14[/C][C]0.132179[/C][C]1.0239[/C][C]0.155008[/C][/ROW]
[ROW][C]15[/C][C]-0.018036[/C][C]-0.1397[/C][C]0.444681[/C][/ROW]
[ROW][C]16[/C][C]-0.096472[/C][C]-0.7473[/C][C]0.22891[/C][/ROW]
[ROW][C]17[/C][C]-0.13957[/C][C]-1.0811[/C][C]0.141989[/C][/ROW]
[ROW][C]18[/C][C]-0.108842[/C][C]-0.8431[/C][C]0.201263[/C][/ROW]
[ROW][C]19[/C][C]0.029194[/C][C]0.2261[/C][C]0.410932[/C][/ROW]
[ROW][C]20[/C][C]-0.070557[/C][C]-0.5465[/C][C]0.293364[/C][/ROW]
[ROW][C]21[/C][C]0.086808[/C][C]0.6724[/C][C]0.251951[/C][/ROW]
[ROW][C]22[/C][C]-0.154706[/C][C]-1.1983[/C][C]0.117747[/C][/ROW]
[ROW][C]23[/C][C]0.023588[/C][C]0.1827[/C][C]0.427821[/C][/ROW]
[ROW][C]24[/C][C]-0.1002[/C][C]-0.7761[/C][C]0.220356[/C][/ROW]
[ROW][C]25[/C][C]0.091753[/C][C]0.7107[/C][C]0.240008[/C][/ROW]
[ROW][C]26[/C][C]0.016984[/C][C]0.1316[/C][C]0.447887[/C][/ROW]
[ROW][C]27[/C][C]0.037234[/C][C]0.2884[/C][C]0.387012[/C][/ROW]
[ROW][C]28[/C][C]0.099155[/C][C]0.768[/C][C]0.222735[/C][/ROW]
[ROW][C]29[/C][C]-0.030477[/C][C]-0.2361[/C][C]0.407091[/C][/ROW]
[ROW][C]30[/C][C]-0.163901[/C][C]-1.2696[/C][C]0.104569[/C][/ROW]
[ROW][C]31[/C][C]0.002759[/C][C]0.0214[/C][C]0.491509[/C][/ROW]
[ROW][C]32[/C][C]-0.071596[/C][C]-0.5546[/C][C]0.290622[/C][/ROW]
[ROW][C]33[/C][C]-0.038839[/C][C]-0.3008[/C][C]0.382285[/C][/ROW]
[ROW][C]34[/C][C]-0.018983[/C][C]-0.147[/C][C]0.441796[/C][/ROW]
[ROW][C]35[/C][C]-0.00333[/C][C]-0.0258[/C][C]0.489752[/C][/ROW]
[ROW][C]36[/C][C]-0.033563[/C][C]-0.26[/C][C]0.397887[/C][/ROW]
[ROW][C]37[/C][C]0.020452[/C][C]0.1584[/C][C]0.437329[/C][/ROW]
[ROW][C]38[/C][C]0.075567[/C][C]0.5853[/C][C]0.280257[/C][/ROW]
[ROW][C]39[/C][C]-0.144446[/C][C]-1.1189[/C][C]0.133827[/C][/ROW]
[ROW][C]40[/C][C]-0.0215[/C][C]-0.1665[/C][C]0.434147[/C][/ROW]
[ROW][C]41[/C][C]0.013826[/C][C]0.1071[/C][C]0.457536[/C][/ROW]
[ROW][C]42[/C][C]-0.073287[/C][C]-0.5677[/C][C]0.286185[/C][/ROW]
[ROW][C]43[/C][C]0.0175[/C][C]0.1356[/C][C]0.446315[/C][/ROW]
[ROW][C]44[/C][C]-0.027667[/C][C]-0.2143[/C][C]0.415517[/C][/ROW]
[ROW][C]45[/C][C]0.008287[/C][C]0.0642[/C][C]0.474517[/C][/ROW]
[ROW][C]46[/C][C]-0.034633[/C][C]-0.2683[/C][C]0.394708[/C][/ROW]
[ROW][C]47[/C][C]-0.024703[/C][C]-0.1913[/C][C]0.424449[/C][/ROW]
[ROW][C]48[/C][C]-0.003317[/C][C]-0.0257[/C][C]0.489794[/C][/ROW]
[ROW][C]49[/C][C]0.022156[/C][C]0.1716[/C][C]0.432158[/C][/ROW]
[ROW][C]50[/C][C]0.077984[/C][C]0.6041[/C][C]0.274039[/C][/ROW]
[ROW][C]51[/C][C]0.010013[/C][C]0.0776[/C][C]0.469219[/C][/ROW]
[ROW][C]52[/C][C]-0.022668[/C][C]-0.1756[/C][C]0.430605[/C][/ROW]
[ROW][C]53[/C][C]-0.030401[/C][C]-0.2355[/C][C]0.407317[/C][/ROW]
[ROW][C]54[/C][C]-0.074577[/C][C]-0.5777[/C][C]0.282825[/C][/ROW]
[ROW][C]55[/C][C]0.00982[/C][C]0.0761[/C][C]0.469809[/C][/ROW]
[ROW][C]56[/C][C]-0.064584[/C][C]-0.5003[/C][C]0.309359[/C][/ROW]
[ROW][C]57[/C][C]-0.035485[/C][C]-0.2749[/C][C]0.392181[/C][/ROW]
[ROW][C]58[/C][C]0.059544[/C][C]0.4612[/C][C]0.323153[/C][/ROW]
[ROW][C]59[/C][C]-0.013815[/C][C]-0.107[/C][C]0.45757[/C][/ROW]
[ROW][C]60[/C][C]NA[/C][C]NA[/C][C]NA[/C][/ROW]
[/TABLE]
Source: https://freestatistics.org/blog/index.php?pk=59780&T=2

Globally Unique Identifier (entire table): ba.freestatistics.org/blog/index.php?pk=59780&T=2

As an alternative you can also use a QR Code:  

The GUIDs for individual cells are displayed in the table below:

Partial Autocorrelation Function
Time lag kPACF(k)T-STATP-value
10.3245712.51410.007317
20.0382640.29640.383977
30.1984771.53740.064727
40.1357441.05150.14863
50.1288390.9980.161148
6-0.200019-1.54930.063279
7-0.038324-0.29690.3838
80.1099380.85160.198918
9-0.058704-0.45470.325475
10-0.17395-1.34740.091457
110.2560681.98350.025947
12-0.119781-0.92780.17861
130.0084960.06580.473874
140.1321791.02390.155008
15-0.018036-0.13970.444681
16-0.096472-0.74730.22891
17-0.13957-1.08110.141989
18-0.108842-0.84310.201263
190.0291940.22610.410932
20-0.070557-0.54650.293364
210.0868080.67240.251951
22-0.154706-1.19830.117747
230.0235880.18270.427821
24-0.1002-0.77610.220356
250.0917530.71070.240008
260.0169840.13160.447887
270.0372340.28840.387012
280.0991550.7680.222735
29-0.030477-0.23610.407091
30-0.163901-1.26960.104569
310.0027590.02140.491509
32-0.071596-0.55460.290622
33-0.038839-0.30080.382285
34-0.018983-0.1470.441796
35-0.00333-0.02580.489752
36-0.033563-0.260.397887
370.0204520.15840.437329
380.0755670.58530.280257
39-0.144446-1.11890.133827
40-0.0215-0.16650.434147
410.0138260.10710.457536
42-0.073287-0.56770.286185
430.01750.13560.446315
44-0.027667-0.21430.415517
450.0082870.06420.474517
46-0.034633-0.26830.394708
47-0.024703-0.19130.424449
48-0.003317-0.02570.489794
490.0221560.17160.432158
500.0779840.60410.274039
510.0100130.07760.469219
52-0.022668-0.17560.430605
53-0.030401-0.23550.407317
54-0.074577-0.57770.282825
550.009820.07610.469809
56-0.064584-0.50030.309359
57-0.035485-0.27490.392181
580.0595440.46120.323153
59-0.013815-0.1070.45757
60NANANA


Parameters (Session):
par1 = 60 ; par2 = 1 ; par3 = 1 ; par4 = 0 ; par5 = 12 ; par6 = White Noise ; par7 = 0.95 ;
Parameters (R input):
par1 = 60 ; par2 = 1 ; par3 = 1 ; par4 = 0 ; par5 = 12 ; par6 = White Noise ; par7 = 0.95 ;
R code (references can be found in the software module):
if (par1 == 'Default') {
par1 = 10*log10(length(x))
} else {
par1 <- as.numeric(par1)
}
par2 <- as.numeric(par2)
par3 <- as.numeric(par3)
par4 <- as.numeric(par4)
par5 <- as.numeric(par5)
if (par6 == 'White Noise') par6 <- 'white' else par6 <- 'ma'
par7 <- as.numeric(par7)
if (par2 == 0) {
x <- log(x)
} else {
x <- (x ^ par2 - 1) / par2
}
if (par3 > 0) x <- diff(x,lag=1,difference=par3)
if (par4 > 0) x <- diff(x,lag=par5,difference=par4)
bitmap(file='pic1.png')
racf <- acf(x, par1, main='Autocorrelation', xlab='time lag', ylab='ACF', ci.type=par6, ci=par7, sub=paste('(lambda=',par2,', d=',par3,', D=',par4,', CI=', par7, ', CI type=',par6,')',sep=''))
dev.off()
bitmap(file='pic2.png')
rpacf <- pacf(x,par1,main='Partial Autocorrelation',xlab='lags',ylab='PACF')
dev.off()
(myacf <- c(racf$acf))
(mypacf <- c(rpacf$acf))
lengthx <- length(x)
sqrtn <- sqrt(lengthx)
load(file='createtable')
a<-table.start()
a<-table.row.start(a)
a<-table.element(a,'Autocorrelation Function',4,TRUE)
a<-table.row.end(a)
a<-table.row.start(a)
a<-table.element(a,'Time lag k',header=TRUE)
a<-table.element(a,hyperlink('basics.htm','ACF(k)','click here for more information about the Autocorrelation Function'),header=TRUE)
a<-table.element(a,'T-STAT',header=TRUE)
a<-table.element(a,'P-value',header=TRUE)
a<-table.row.end(a)
for (i in 2:(par1+1)) {
a<-table.row.start(a)
a<-table.element(a,i-1,header=TRUE)
a<-table.element(a,round(myacf[i],6))
mytstat <- myacf[i]*sqrtn
a<-table.element(a,round(mytstat,4))
a<-table.element(a,round(1-pt(abs(mytstat),lengthx),6))
a<-table.row.end(a)
}
a<-table.end(a)
table.save(a,file='mytable.tab')
a<-table.start()
a<-table.row.start(a)
a<-table.element(a,'Partial Autocorrelation Function',4,TRUE)
a<-table.row.end(a)
a<-table.row.start(a)
a<-table.element(a,'Time lag k',header=TRUE)
a<-table.element(a,hyperlink('basics.htm','PACF(k)','click here for more information about the Partial Autocorrelation Function'),header=TRUE)
a<-table.element(a,'T-STAT',header=TRUE)
a<-table.element(a,'P-value',header=TRUE)
a<-table.row.end(a)
for (i in 1:par1) {
a<-table.row.start(a)
a<-table.element(a,i,header=TRUE)
a<-table.element(a,round(mypacf[i],6))
mytstat <- mypacf[i]*sqrtn
a<-table.element(a,round(mytstat,4))
a<-table.element(a,round(1-pt(abs(mytstat),lengthx),6))
a<-table.row.end(a)
}
a<-table.end(a)
table.save(a,file='mytable1.tab')