Free Statistics

of Irreproducible Research!

Author's title

Author*The author of this computation has been verified*
R Software Modulerwasp_autocorrelation.wasp
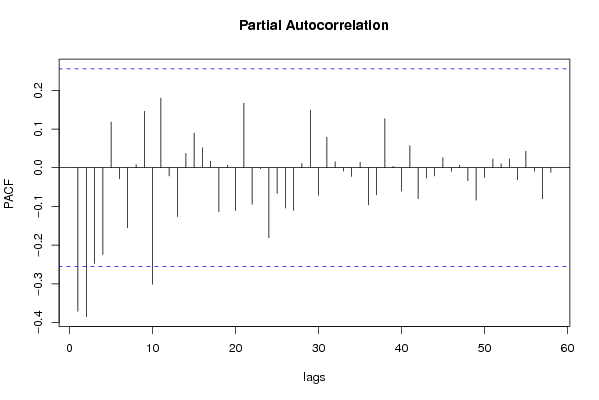
Title produced by software(Partial) Autocorrelation Function
Date of computationThu, 26 Nov 2009 03:35:41 -0700
Cite this page as followsStatistical Computations at FreeStatistics.org, Office for Research Development and Education, URL https://freestatistics.org/blog/index.php?v=date/2009/Nov/26/t1259231889mukocaqv71np88l.htm/, Retrieved Sun, 28 Apr 2024 22:22:49 +0000
Statistical Computations at FreeStatistics.org, Office for Research Development and Education, URL https://freestatistics.org/blog/index.php?pk=59802, Retrieved Sun, 28 Apr 2024 22:22:49 +0000
QR Codes:

Original text written by user:
IsPrivate?No (this computation is public)
User-defined keywords
Estimated Impact96
Family? (F = Feedback message, R = changed R code, M = changed R Module, P = changed Parameters, D = changed Data)
-     [Univariate Explorative Data Analysis] [Run Sequence gebo...] [2008-12-12 13:32:37] [76963dc1903f0f612b6153510a3818cf]
- R  D  [Univariate Explorative Data Analysis] [Run Sequence gebo...] [2008-12-17 12:14:40] [76963dc1903f0f612b6153510a3818cf]
-         [Univariate Explorative Data Analysis] [Run Sequence Plot...] [2008-12-22 18:19:51] [1ce0d16c8f4225c977b42c8fa93bc163]
- RMP       [(Partial) Autocorrelation Function] [Identifying Integ...] [2009-11-22 12:16:10] [b98453cac15ba1066b407e146608df68]
-   PD          [(Partial) Autocorrelation Function] [] [2009-11-26 10:35:41] [791a4a78a0a7ca497fb8791b982a539e] [Current]
Feedback Forum

Post a new message
Dataseries X:
785.8
819.3
849.4
880.4
900.1
937.2
948.9
952.6
947.3
974.2
1000.8
1032.8
1050.7
1057.3
1075.4
1118.4
1179.8
1227
1257.8
1251.5
1236.3
1170.6
1213.1
1265.5
1300.8
1348.4
1371.9
1403.3
1451.8
1474.2
1438.2
1513.6
1562.2
1546.2
1527.5
1418.7
1448.5
1492.1
1395.4
1403.7
1316.6
1274.5
1264.4
1323.9
1332.1
1250.2
1096.7
1080.8
1039.2
792
746.6
688.8
715.8
672.9
629.5
681.2
755.4
760.6
765.9
836.8
904.9


Summary of computational transaction
Raw Inputview raw input (R code)
Raw Outputview raw output of R engine
Computing time2 seconds
R Server'Gwilym Jenkins' @ 72.249.127.135

\begin{tabular}{lllllllll}
\hline
Summary of computational transaction \tabularnewline
Raw Input & view raw input (R code)  \tabularnewline
Raw Output & view raw output of R engine  \tabularnewline
Computing time & 2 seconds \tabularnewline
R Server & 'Gwilym Jenkins' @ 72.249.127.135 \tabularnewline
\hline
\end{tabular}
%Source: https://freestatistics.org/blog/index.php?pk=59802&T=0

[TABLE]
[ROW][C]Summary of computational transaction[/C][/ROW]
[ROW][C]Raw Input[/C][C]view raw input (R code) [/C][/ROW]
[ROW][C]Raw Output[/C][C]view raw output of R engine [/C][/ROW]
[ROW][C]Computing time[/C][C]2 seconds[/C][/ROW]
[ROW][C]R Server[/C][C]'Gwilym Jenkins' @ 72.249.127.135[/C][/ROW]
[/TABLE]
Source: https://freestatistics.org/blog/index.php?pk=59802&T=0

Globally Unique Identifier (entire table): ba.freestatistics.org/blog/index.php?pk=59802&T=0

As an alternative you can also use a QR Code:  

The GUIDs for individual cells are displayed in the table below:

Summary of computational transaction
Raw Inputview raw input (R code)
Raw Outputview raw output of R engine
Computing time2 seconds
R Server'Gwilym Jenkins' @ 72.249.127.135


Autocorrelation Function
Time lag kACF(k)T-STATP-value
1-0.370752-2.84780.003025
2-0.194303-1.49250.070452
30.0605620.46520.321757
4-0.000143-0.00110.499563
50.1969161.51250.067867
6-0.177961-1.36690.088415
7-0.121244-0.93130.177748
80.1990161.52870.065845
90.07250.55690.289857
10-0.33276-2.5560.006592
110.3007962.31050.012189
12-0.10409-0.79950.213596
13-0.053592-0.41170.341043
140.1199230.92110.180362
15-0.121027-0.92960.178176
160.1673271.28530.101862
17-0.091669-0.70410.242063
18-0.181354-1.3930.084422
190.2149191.65080.052044
20-0.000473-0.00360.498557
21-0.042045-0.3230.373935
22-0.048768-0.37460.354654
23-0.00241-0.01850.492646
24-0.021978-0.16880.433258
250.0862550.66250.255103
26-0.103109-0.7920.215768
27-0.00811-0.06230.475271
280.1486361.14170.129096
29-0.083559-0.64180.261736
300.0239420.18390.427362
31-0.052765-0.40530.343364
320.0403640.310.378811
330.0014420.01110.495599
340.0125960.09680.461626
35-0.063373-0.48680.314111
360.0265740.20410.41948
370.0114720.08810.46504
380.0034480.02650.48948
390.002370.01820.492767
40-0.022158-0.17020.432719
410.0201870.15510.438653
42-0.001618-0.01240.495063
430.013210.10150.459761
44-0.0318-0.24430.403937
450.0269810.20720.418267
46-0.008649-0.06640.47363
470.0120760.09280.463206
48-0.021783-0.16730.433847
49-0.004372-0.03360.486661
500.0124780.09580.461985
510.0022740.01750.493061
52-0.007144-0.05490.478211
53-0.004532-0.03480.486175
540.0040320.0310.487699
55-0.002067-0.01590.493693
560.0002340.00180.499286
57-0.000974-0.00750.497029
585.1e-054e-040.499846
59NANANA
60NANANA

\begin{tabular}{lllllllll}
\hline
Autocorrelation Function \tabularnewline
Time lag k & ACF(k) & T-STAT & P-value \tabularnewline
1 & -0.370752 & -2.8478 & 0.003025 \tabularnewline
2 & -0.194303 & -1.4925 & 0.070452 \tabularnewline
3 & 0.060562 & 0.4652 & 0.321757 \tabularnewline
4 & -0.000143 & -0.0011 & 0.499563 \tabularnewline
5 & 0.196916 & 1.5125 & 0.067867 \tabularnewline
6 & -0.177961 & -1.3669 & 0.088415 \tabularnewline
7 & -0.121244 & -0.9313 & 0.177748 \tabularnewline
8 & 0.199016 & 1.5287 & 0.065845 \tabularnewline
9 & 0.0725 & 0.5569 & 0.289857 \tabularnewline
10 & -0.33276 & -2.556 & 0.006592 \tabularnewline
11 & 0.300796 & 2.3105 & 0.012189 \tabularnewline
12 & -0.10409 & -0.7995 & 0.213596 \tabularnewline
13 & -0.053592 & -0.4117 & 0.341043 \tabularnewline
14 & 0.119923 & 0.9211 & 0.180362 \tabularnewline
15 & -0.121027 & -0.9296 & 0.178176 \tabularnewline
16 & 0.167327 & 1.2853 & 0.101862 \tabularnewline
17 & -0.091669 & -0.7041 & 0.242063 \tabularnewline
18 & -0.181354 & -1.393 & 0.084422 \tabularnewline
19 & 0.214919 & 1.6508 & 0.052044 \tabularnewline
20 & -0.000473 & -0.0036 & 0.498557 \tabularnewline
21 & -0.042045 & -0.323 & 0.373935 \tabularnewline
22 & -0.048768 & -0.3746 & 0.354654 \tabularnewline
23 & -0.00241 & -0.0185 & 0.492646 \tabularnewline
24 & -0.021978 & -0.1688 & 0.433258 \tabularnewline
25 & 0.086255 & 0.6625 & 0.255103 \tabularnewline
26 & -0.103109 & -0.792 & 0.215768 \tabularnewline
27 & -0.00811 & -0.0623 & 0.475271 \tabularnewline
28 & 0.148636 & 1.1417 & 0.129096 \tabularnewline
29 & -0.083559 & -0.6418 & 0.261736 \tabularnewline
30 & 0.023942 & 0.1839 & 0.427362 \tabularnewline
31 & -0.052765 & -0.4053 & 0.343364 \tabularnewline
32 & 0.040364 & 0.31 & 0.378811 \tabularnewline
33 & 0.001442 & 0.0111 & 0.495599 \tabularnewline
34 & 0.012596 & 0.0968 & 0.461626 \tabularnewline
35 & -0.063373 & -0.4868 & 0.314111 \tabularnewline
36 & 0.026574 & 0.2041 & 0.41948 \tabularnewline
37 & 0.011472 & 0.0881 & 0.46504 \tabularnewline
38 & 0.003448 & 0.0265 & 0.48948 \tabularnewline
39 & 0.00237 & 0.0182 & 0.492767 \tabularnewline
40 & -0.022158 & -0.1702 & 0.432719 \tabularnewline
41 & 0.020187 & 0.1551 & 0.438653 \tabularnewline
42 & -0.001618 & -0.0124 & 0.495063 \tabularnewline
43 & 0.01321 & 0.1015 & 0.459761 \tabularnewline
44 & -0.0318 & -0.2443 & 0.403937 \tabularnewline
45 & 0.026981 & 0.2072 & 0.418267 \tabularnewline
46 & -0.008649 & -0.0664 & 0.47363 \tabularnewline
47 & 0.012076 & 0.0928 & 0.463206 \tabularnewline
48 & -0.021783 & -0.1673 & 0.433847 \tabularnewline
49 & -0.004372 & -0.0336 & 0.486661 \tabularnewline
50 & 0.012478 & 0.0958 & 0.461985 \tabularnewline
51 & 0.002274 & 0.0175 & 0.493061 \tabularnewline
52 & -0.007144 & -0.0549 & 0.478211 \tabularnewline
53 & -0.004532 & -0.0348 & 0.486175 \tabularnewline
54 & 0.004032 & 0.031 & 0.487699 \tabularnewline
55 & -0.002067 & -0.0159 & 0.493693 \tabularnewline
56 & 0.000234 & 0.0018 & 0.499286 \tabularnewline
57 & -0.000974 & -0.0075 & 0.497029 \tabularnewline
58 & 5.1e-05 & 4e-04 & 0.499846 \tabularnewline
59 & NA & NA & NA \tabularnewline
60 & NA & NA & NA \tabularnewline
\hline
\end{tabular}
%Source: https://freestatistics.org/blog/index.php?pk=59802&T=1

[TABLE]
[ROW][C]Autocorrelation Function[/C][/ROW]
[ROW][C]Time lag k[/C][C]ACF(k)[/C][C]T-STAT[/C][C]P-value[/C][/ROW]
[ROW][C]1[/C][C]-0.370752[/C][C]-2.8478[/C][C]0.003025[/C][/ROW]
[ROW][C]2[/C][C]-0.194303[/C][C]-1.4925[/C][C]0.070452[/C][/ROW]
[ROW][C]3[/C][C]0.060562[/C][C]0.4652[/C][C]0.321757[/C][/ROW]
[ROW][C]4[/C][C]-0.000143[/C][C]-0.0011[/C][C]0.499563[/C][/ROW]
[ROW][C]5[/C][C]0.196916[/C][C]1.5125[/C][C]0.067867[/C][/ROW]
[ROW][C]6[/C][C]-0.177961[/C][C]-1.3669[/C][C]0.088415[/C][/ROW]
[ROW][C]7[/C][C]-0.121244[/C][C]-0.9313[/C][C]0.177748[/C][/ROW]
[ROW][C]8[/C][C]0.199016[/C][C]1.5287[/C][C]0.065845[/C][/ROW]
[ROW][C]9[/C][C]0.0725[/C][C]0.5569[/C][C]0.289857[/C][/ROW]
[ROW][C]10[/C][C]-0.33276[/C][C]-2.556[/C][C]0.006592[/C][/ROW]
[ROW][C]11[/C][C]0.300796[/C][C]2.3105[/C][C]0.012189[/C][/ROW]
[ROW][C]12[/C][C]-0.10409[/C][C]-0.7995[/C][C]0.213596[/C][/ROW]
[ROW][C]13[/C][C]-0.053592[/C][C]-0.4117[/C][C]0.341043[/C][/ROW]
[ROW][C]14[/C][C]0.119923[/C][C]0.9211[/C][C]0.180362[/C][/ROW]
[ROW][C]15[/C][C]-0.121027[/C][C]-0.9296[/C][C]0.178176[/C][/ROW]
[ROW][C]16[/C][C]0.167327[/C][C]1.2853[/C][C]0.101862[/C][/ROW]
[ROW][C]17[/C][C]-0.091669[/C][C]-0.7041[/C][C]0.242063[/C][/ROW]
[ROW][C]18[/C][C]-0.181354[/C][C]-1.393[/C][C]0.084422[/C][/ROW]
[ROW][C]19[/C][C]0.214919[/C][C]1.6508[/C][C]0.052044[/C][/ROW]
[ROW][C]20[/C][C]-0.000473[/C][C]-0.0036[/C][C]0.498557[/C][/ROW]
[ROW][C]21[/C][C]-0.042045[/C][C]-0.323[/C][C]0.373935[/C][/ROW]
[ROW][C]22[/C][C]-0.048768[/C][C]-0.3746[/C][C]0.354654[/C][/ROW]
[ROW][C]23[/C][C]-0.00241[/C][C]-0.0185[/C][C]0.492646[/C][/ROW]
[ROW][C]24[/C][C]-0.021978[/C][C]-0.1688[/C][C]0.433258[/C][/ROW]
[ROW][C]25[/C][C]0.086255[/C][C]0.6625[/C][C]0.255103[/C][/ROW]
[ROW][C]26[/C][C]-0.103109[/C][C]-0.792[/C][C]0.215768[/C][/ROW]
[ROW][C]27[/C][C]-0.00811[/C][C]-0.0623[/C][C]0.475271[/C][/ROW]
[ROW][C]28[/C][C]0.148636[/C][C]1.1417[/C][C]0.129096[/C][/ROW]
[ROW][C]29[/C][C]-0.083559[/C][C]-0.6418[/C][C]0.261736[/C][/ROW]
[ROW][C]30[/C][C]0.023942[/C][C]0.1839[/C][C]0.427362[/C][/ROW]
[ROW][C]31[/C][C]-0.052765[/C][C]-0.4053[/C][C]0.343364[/C][/ROW]
[ROW][C]32[/C][C]0.040364[/C][C]0.31[/C][C]0.378811[/C][/ROW]
[ROW][C]33[/C][C]0.001442[/C][C]0.0111[/C][C]0.495599[/C][/ROW]
[ROW][C]34[/C][C]0.012596[/C][C]0.0968[/C][C]0.461626[/C][/ROW]
[ROW][C]35[/C][C]-0.063373[/C][C]-0.4868[/C][C]0.314111[/C][/ROW]
[ROW][C]36[/C][C]0.026574[/C][C]0.2041[/C][C]0.41948[/C][/ROW]
[ROW][C]37[/C][C]0.011472[/C][C]0.0881[/C][C]0.46504[/C][/ROW]
[ROW][C]38[/C][C]0.003448[/C][C]0.0265[/C][C]0.48948[/C][/ROW]
[ROW][C]39[/C][C]0.00237[/C][C]0.0182[/C][C]0.492767[/C][/ROW]
[ROW][C]40[/C][C]-0.022158[/C][C]-0.1702[/C][C]0.432719[/C][/ROW]
[ROW][C]41[/C][C]0.020187[/C][C]0.1551[/C][C]0.438653[/C][/ROW]
[ROW][C]42[/C][C]-0.001618[/C][C]-0.0124[/C][C]0.495063[/C][/ROW]
[ROW][C]43[/C][C]0.01321[/C][C]0.1015[/C][C]0.459761[/C][/ROW]
[ROW][C]44[/C][C]-0.0318[/C][C]-0.2443[/C][C]0.403937[/C][/ROW]
[ROW][C]45[/C][C]0.026981[/C][C]0.2072[/C][C]0.418267[/C][/ROW]
[ROW][C]46[/C][C]-0.008649[/C][C]-0.0664[/C][C]0.47363[/C][/ROW]
[ROW][C]47[/C][C]0.012076[/C][C]0.0928[/C][C]0.463206[/C][/ROW]
[ROW][C]48[/C][C]-0.021783[/C][C]-0.1673[/C][C]0.433847[/C][/ROW]
[ROW][C]49[/C][C]-0.004372[/C][C]-0.0336[/C][C]0.486661[/C][/ROW]
[ROW][C]50[/C][C]0.012478[/C][C]0.0958[/C][C]0.461985[/C][/ROW]
[ROW][C]51[/C][C]0.002274[/C][C]0.0175[/C][C]0.493061[/C][/ROW]
[ROW][C]52[/C][C]-0.007144[/C][C]-0.0549[/C][C]0.478211[/C][/ROW]
[ROW][C]53[/C][C]-0.004532[/C][C]-0.0348[/C][C]0.486175[/C][/ROW]
[ROW][C]54[/C][C]0.004032[/C][C]0.031[/C][C]0.487699[/C][/ROW]
[ROW][C]55[/C][C]-0.002067[/C][C]-0.0159[/C][C]0.493693[/C][/ROW]
[ROW][C]56[/C][C]0.000234[/C][C]0.0018[/C][C]0.499286[/C][/ROW]
[ROW][C]57[/C][C]-0.000974[/C][C]-0.0075[/C][C]0.497029[/C][/ROW]
[ROW][C]58[/C][C]5.1e-05[/C][C]4e-04[/C][C]0.499846[/C][/ROW]
[ROW][C]59[/C][C]NA[/C][C]NA[/C][C]NA[/C][/ROW]
[ROW][C]60[/C][C]NA[/C][C]NA[/C][C]NA[/C][/ROW]
[/TABLE]
Source: https://freestatistics.org/blog/index.php?pk=59802&T=1

Globally Unique Identifier (entire table): ba.freestatistics.org/blog/index.php?pk=59802&T=1

As an alternative you can also use a QR Code:  

The GUIDs for individual cells are displayed in the table below:

Autocorrelation Function
Time lag kACF(k)T-STATP-value
1-0.370752-2.84780.003025
2-0.194303-1.49250.070452
30.0605620.46520.321757
4-0.000143-0.00110.499563
50.1969161.51250.067867
6-0.177961-1.36690.088415
7-0.121244-0.93130.177748
80.1990161.52870.065845
90.07250.55690.289857
10-0.33276-2.5560.006592
110.3007962.31050.012189
12-0.10409-0.79950.213596
13-0.053592-0.41170.341043
140.1199230.92110.180362
15-0.121027-0.92960.178176
160.1673271.28530.101862
17-0.091669-0.70410.242063
18-0.181354-1.3930.084422
190.2149191.65080.052044
20-0.000473-0.00360.498557
21-0.042045-0.3230.373935
22-0.048768-0.37460.354654
23-0.00241-0.01850.492646
24-0.021978-0.16880.433258
250.0862550.66250.255103
26-0.103109-0.7920.215768
27-0.00811-0.06230.475271
280.1486361.14170.129096
29-0.083559-0.64180.261736
300.0239420.18390.427362
31-0.052765-0.40530.343364
320.0403640.310.378811
330.0014420.01110.495599
340.0125960.09680.461626
35-0.063373-0.48680.314111
360.0265740.20410.41948
370.0114720.08810.46504
380.0034480.02650.48948
390.002370.01820.492767
40-0.022158-0.17020.432719
410.0201870.15510.438653
42-0.001618-0.01240.495063
430.013210.10150.459761
44-0.0318-0.24430.403937
450.0269810.20720.418267
46-0.008649-0.06640.47363
470.0120760.09280.463206
48-0.021783-0.16730.433847
49-0.004372-0.03360.486661
500.0124780.09580.461985
510.0022740.01750.493061
52-0.007144-0.05490.478211
53-0.004532-0.03480.486175
540.0040320.0310.487699
55-0.002067-0.01590.493693
560.0002340.00180.499286
57-0.000974-0.00750.497029
585.1e-054e-040.499846
59NANANA
60NANANA


Partial Autocorrelation Function
Time lag kPACF(k)T-STATP-value
1-0.370752-2.84780.003025
2-0.384631-2.95440.002247
3-0.247351-1.89990.031166
4-0.223785-1.71890.045436
50.1178640.90530.184487
6-0.028375-0.21790.41411
7-0.15525-1.19250.11892
80.0081610.06270.475114
90.1456741.11890.133849
10-0.300691-2.30960.012213
110.1797061.38030.086344
12-0.021334-0.16390.435198
13-0.126134-0.96890.168287
140.0370890.28490.388364
150.089660.68870.246859
160.0516450.39670.346513
170.017070.13110.448064
18-0.113818-0.87420.192764
190.0066950.05140.47958
20-0.110524-0.8490.199669
210.1666351.27990.102786
22-0.094183-0.72340.236135
23-0.002589-0.01990.492101
24-0.18052-1.38660.085391
25-0.066198-0.50850.306508
26-0.104216-0.80050.213316
27-0.110248-0.84680.200257
280.0109440.08410.466646
290.1488281.14320.128793
30-0.071283-0.54750.293038
310.0790580.60730.273006
320.0156980.12060.452218
33-0.008532-0.06550.473983
34-0.022464-0.17260.431798
350.013970.10730.457455
36-0.096095-0.73810.231684
37-0.069993-0.53760.296427
380.1266550.97290.167299
390.0035250.02710.489246
40-0.060209-0.46250.322722
410.0568860.43690.331872
42-0.079811-0.6130.271104
43-0.026692-0.2050.419128
44-0.021293-0.16360.43532
450.0255240.19610.42262
46-0.009616-0.07390.470686
470.0064780.04980.480242
48-0.033887-0.26030.397773
49-0.08392-0.64460.260842
50-0.024998-0.1920.424196
510.0223120.17140.432254
520.0104960.08060.468009
530.0225350.17310.431585
54-0.030961-0.23780.406424
550.0428290.3290.37167
56-0.009012-0.06920.472523
57-0.080074-0.61510.27044
58-0.011968-0.09190.463532
59NANANA
60NANANA

\begin{tabular}{lllllllll}
\hline
Partial Autocorrelation Function \tabularnewline
Time lag k & PACF(k) & T-STAT & P-value \tabularnewline
1 & -0.370752 & -2.8478 & 0.003025 \tabularnewline
2 & -0.384631 & -2.9544 & 0.002247 \tabularnewline
3 & -0.247351 & -1.8999 & 0.031166 \tabularnewline
4 & -0.223785 & -1.7189 & 0.045436 \tabularnewline
5 & 0.117864 & 0.9053 & 0.184487 \tabularnewline
6 & -0.028375 & -0.2179 & 0.41411 \tabularnewline
7 & -0.15525 & -1.1925 & 0.11892 \tabularnewline
8 & 0.008161 & 0.0627 & 0.475114 \tabularnewline
9 & 0.145674 & 1.1189 & 0.133849 \tabularnewline
10 & -0.300691 & -2.3096 & 0.012213 \tabularnewline
11 & 0.179706 & 1.3803 & 0.086344 \tabularnewline
12 & -0.021334 & -0.1639 & 0.435198 \tabularnewline
13 & -0.126134 & -0.9689 & 0.168287 \tabularnewline
14 & 0.037089 & 0.2849 & 0.388364 \tabularnewline
15 & 0.08966 & 0.6887 & 0.246859 \tabularnewline
16 & 0.051645 & 0.3967 & 0.346513 \tabularnewline
17 & 0.01707 & 0.1311 & 0.448064 \tabularnewline
18 & -0.113818 & -0.8742 & 0.192764 \tabularnewline
19 & 0.006695 & 0.0514 & 0.47958 \tabularnewline
20 & -0.110524 & -0.849 & 0.199669 \tabularnewline
21 & 0.166635 & 1.2799 & 0.102786 \tabularnewline
22 & -0.094183 & -0.7234 & 0.236135 \tabularnewline
23 & -0.002589 & -0.0199 & 0.492101 \tabularnewline
24 & -0.18052 & -1.3866 & 0.085391 \tabularnewline
25 & -0.066198 & -0.5085 & 0.306508 \tabularnewline
26 & -0.104216 & -0.8005 & 0.213316 \tabularnewline
27 & -0.110248 & -0.8468 & 0.200257 \tabularnewline
28 & 0.010944 & 0.0841 & 0.466646 \tabularnewline
29 & 0.148828 & 1.1432 & 0.128793 \tabularnewline
30 & -0.071283 & -0.5475 & 0.293038 \tabularnewline
31 & 0.079058 & 0.6073 & 0.273006 \tabularnewline
32 & 0.015698 & 0.1206 & 0.452218 \tabularnewline
33 & -0.008532 & -0.0655 & 0.473983 \tabularnewline
34 & -0.022464 & -0.1726 & 0.431798 \tabularnewline
35 & 0.01397 & 0.1073 & 0.457455 \tabularnewline
36 & -0.096095 & -0.7381 & 0.231684 \tabularnewline
37 & -0.069993 & -0.5376 & 0.296427 \tabularnewline
38 & 0.126655 & 0.9729 & 0.167299 \tabularnewline
39 & 0.003525 & 0.0271 & 0.489246 \tabularnewline
40 & -0.060209 & -0.4625 & 0.322722 \tabularnewline
41 & 0.056886 & 0.4369 & 0.331872 \tabularnewline
42 & -0.079811 & -0.613 & 0.271104 \tabularnewline
43 & -0.026692 & -0.205 & 0.419128 \tabularnewline
44 & -0.021293 & -0.1636 & 0.43532 \tabularnewline
45 & 0.025524 & 0.1961 & 0.42262 \tabularnewline
46 & -0.009616 & -0.0739 & 0.470686 \tabularnewline
47 & 0.006478 & 0.0498 & 0.480242 \tabularnewline
48 & -0.033887 & -0.2603 & 0.397773 \tabularnewline
49 & -0.08392 & -0.6446 & 0.260842 \tabularnewline
50 & -0.024998 & -0.192 & 0.424196 \tabularnewline
51 & 0.022312 & 0.1714 & 0.432254 \tabularnewline
52 & 0.010496 & 0.0806 & 0.468009 \tabularnewline
53 & 0.022535 & 0.1731 & 0.431585 \tabularnewline
54 & -0.030961 & -0.2378 & 0.406424 \tabularnewline
55 & 0.042829 & 0.329 & 0.37167 \tabularnewline
56 & -0.009012 & -0.0692 & 0.472523 \tabularnewline
57 & -0.080074 & -0.6151 & 0.27044 \tabularnewline
58 & -0.011968 & -0.0919 & 0.463532 \tabularnewline
59 & NA & NA & NA \tabularnewline
60 & NA & NA & NA \tabularnewline
\hline
\end{tabular}
%Source: https://freestatistics.org/blog/index.php?pk=59802&T=2

[TABLE]
[ROW][C]Partial Autocorrelation Function[/C][/ROW]
[ROW][C]Time lag k[/C][C]PACF(k)[/C][C]T-STAT[/C][C]P-value[/C][/ROW]
[ROW][C]1[/C][C]-0.370752[/C][C]-2.8478[/C][C]0.003025[/C][/ROW]
[ROW][C]2[/C][C]-0.384631[/C][C]-2.9544[/C][C]0.002247[/C][/ROW]
[ROW][C]3[/C][C]-0.247351[/C][C]-1.8999[/C][C]0.031166[/C][/ROW]
[ROW][C]4[/C][C]-0.223785[/C][C]-1.7189[/C][C]0.045436[/C][/ROW]
[ROW][C]5[/C][C]0.117864[/C][C]0.9053[/C][C]0.184487[/C][/ROW]
[ROW][C]6[/C][C]-0.028375[/C][C]-0.2179[/C][C]0.41411[/C][/ROW]
[ROW][C]7[/C][C]-0.15525[/C][C]-1.1925[/C][C]0.11892[/C][/ROW]
[ROW][C]8[/C][C]0.008161[/C][C]0.0627[/C][C]0.475114[/C][/ROW]
[ROW][C]9[/C][C]0.145674[/C][C]1.1189[/C][C]0.133849[/C][/ROW]
[ROW][C]10[/C][C]-0.300691[/C][C]-2.3096[/C][C]0.012213[/C][/ROW]
[ROW][C]11[/C][C]0.179706[/C][C]1.3803[/C][C]0.086344[/C][/ROW]
[ROW][C]12[/C][C]-0.021334[/C][C]-0.1639[/C][C]0.435198[/C][/ROW]
[ROW][C]13[/C][C]-0.126134[/C][C]-0.9689[/C][C]0.168287[/C][/ROW]
[ROW][C]14[/C][C]0.037089[/C][C]0.2849[/C][C]0.388364[/C][/ROW]
[ROW][C]15[/C][C]0.08966[/C][C]0.6887[/C][C]0.246859[/C][/ROW]
[ROW][C]16[/C][C]0.051645[/C][C]0.3967[/C][C]0.346513[/C][/ROW]
[ROW][C]17[/C][C]0.01707[/C][C]0.1311[/C][C]0.448064[/C][/ROW]
[ROW][C]18[/C][C]-0.113818[/C][C]-0.8742[/C][C]0.192764[/C][/ROW]
[ROW][C]19[/C][C]0.006695[/C][C]0.0514[/C][C]0.47958[/C][/ROW]
[ROW][C]20[/C][C]-0.110524[/C][C]-0.849[/C][C]0.199669[/C][/ROW]
[ROW][C]21[/C][C]0.166635[/C][C]1.2799[/C][C]0.102786[/C][/ROW]
[ROW][C]22[/C][C]-0.094183[/C][C]-0.7234[/C][C]0.236135[/C][/ROW]
[ROW][C]23[/C][C]-0.002589[/C][C]-0.0199[/C][C]0.492101[/C][/ROW]
[ROW][C]24[/C][C]-0.18052[/C][C]-1.3866[/C][C]0.085391[/C][/ROW]
[ROW][C]25[/C][C]-0.066198[/C][C]-0.5085[/C][C]0.306508[/C][/ROW]
[ROW][C]26[/C][C]-0.104216[/C][C]-0.8005[/C][C]0.213316[/C][/ROW]
[ROW][C]27[/C][C]-0.110248[/C][C]-0.8468[/C][C]0.200257[/C][/ROW]
[ROW][C]28[/C][C]0.010944[/C][C]0.0841[/C][C]0.466646[/C][/ROW]
[ROW][C]29[/C][C]0.148828[/C][C]1.1432[/C][C]0.128793[/C][/ROW]
[ROW][C]30[/C][C]-0.071283[/C][C]-0.5475[/C][C]0.293038[/C][/ROW]
[ROW][C]31[/C][C]0.079058[/C][C]0.6073[/C][C]0.273006[/C][/ROW]
[ROW][C]32[/C][C]0.015698[/C][C]0.1206[/C][C]0.452218[/C][/ROW]
[ROW][C]33[/C][C]-0.008532[/C][C]-0.0655[/C][C]0.473983[/C][/ROW]
[ROW][C]34[/C][C]-0.022464[/C][C]-0.1726[/C][C]0.431798[/C][/ROW]
[ROW][C]35[/C][C]0.01397[/C][C]0.1073[/C][C]0.457455[/C][/ROW]
[ROW][C]36[/C][C]-0.096095[/C][C]-0.7381[/C][C]0.231684[/C][/ROW]
[ROW][C]37[/C][C]-0.069993[/C][C]-0.5376[/C][C]0.296427[/C][/ROW]
[ROW][C]38[/C][C]0.126655[/C][C]0.9729[/C][C]0.167299[/C][/ROW]
[ROW][C]39[/C][C]0.003525[/C][C]0.0271[/C][C]0.489246[/C][/ROW]
[ROW][C]40[/C][C]-0.060209[/C][C]-0.4625[/C][C]0.322722[/C][/ROW]
[ROW][C]41[/C][C]0.056886[/C][C]0.4369[/C][C]0.331872[/C][/ROW]
[ROW][C]42[/C][C]-0.079811[/C][C]-0.613[/C][C]0.271104[/C][/ROW]
[ROW][C]43[/C][C]-0.026692[/C][C]-0.205[/C][C]0.419128[/C][/ROW]
[ROW][C]44[/C][C]-0.021293[/C][C]-0.1636[/C][C]0.43532[/C][/ROW]
[ROW][C]45[/C][C]0.025524[/C][C]0.1961[/C][C]0.42262[/C][/ROW]
[ROW][C]46[/C][C]-0.009616[/C][C]-0.0739[/C][C]0.470686[/C][/ROW]
[ROW][C]47[/C][C]0.006478[/C][C]0.0498[/C][C]0.480242[/C][/ROW]
[ROW][C]48[/C][C]-0.033887[/C][C]-0.2603[/C][C]0.397773[/C][/ROW]
[ROW][C]49[/C][C]-0.08392[/C][C]-0.6446[/C][C]0.260842[/C][/ROW]
[ROW][C]50[/C][C]-0.024998[/C][C]-0.192[/C][C]0.424196[/C][/ROW]
[ROW][C]51[/C][C]0.022312[/C][C]0.1714[/C][C]0.432254[/C][/ROW]
[ROW][C]52[/C][C]0.010496[/C][C]0.0806[/C][C]0.468009[/C][/ROW]
[ROW][C]53[/C][C]0.022535[/C][C]0.1731[/C][C]0.431585[/C][/ROW]
[ROW][C]54[/C][C]-0.030961[/C][C]-0.2378[/C][C]0.406424[/C][/ROW]
[ROW][C]55[/C][C]0.042829[/C][C]0.329[/C][C]0.37167[/C][/ROW]
[ROW][C]56[/C][C]-0.009012[/C][C]-0.0692[/C][C]0.472523[/C][/ROW]
[ROW][C]57[/C][C]-0.080074[/C][C]-0.6151[/C][C]0.27044[/C][/ROW]
[ROW][C]58[/C][C]-0.011968[/C][C]-0.0919[/C][C]0.463532[/C][/ROW]
[ROW][C]59[/C][C]NA[/C][C]NA[/C][C]NA[/C][/ROW]
[ROW][C]60[/C][C]NA[/C][C]NA[/C][C]NA[/C][/ROW]
[/TABLE]
Source: https://freestatistics.org/blog/index.php?pk=59802&T=2

Globally Unique Identifier (entire table): ba.freestatistics.org/blog/index.php?pk=59802&T=2

As an alternative you can also use a QR Code:  

The GUIDs for individual cells are displayed in the table below:

Partial Autocorrelation Function
Time lag kPACF(k)T-STATP-value
1-0.370752-2.84780.003025
2-0.384631-2.95440.002247
3-0.247351-1.89990.031166
4-0.223785-1.71890.045436
50.1178640.90530.184487
6-0.028375-0.21790.41411
7-0.15525-1.19250.11892
80.0081610.06270.475114
90.1456741.11890.133849
10-0.300691-2.30960.012213
110.1797061.38030.086344
12-0.021334-0.16390.435198
13-0.126134-0.96890.168287
140.0370890.28490.388364
150.089660.68870.246859
160.0516450.39670.346513
170.017070.13110.448064
18-0.113818-0.87420.192764
190.0066950.05140.47958
20-0.110524-0.8490.199669
210.1666351.27990.102786
22-0.094183-0.72340.236135
23-0.002589-0.01990.492101
24-0.18052-1.38660.085391
25-0.066198-0.50850.306508
26-0.104216-0.80050.213316
27-0.110248-0.84680.200257
280.0109440.08410.466646
290.1488281.14320.128793
30-0.071283-0.54750.293038
310.0790580.60730.273006
320.0156980.12060.452218
33-0.008532-0.06550.473983
34-0.022464-0.17260.431798
350.013970.10730.457455
36-0.096095-0.73810.231684
37-0.069993-0.53760.296427
380.1266550.97290.167299
390.0035250.02710.489246
40-0.060209-0.46250.322722
410.0568860.43690.331872
42-0.079811-0.6130.271104
43-0.026692-0.2050.419128
44-0.021293-0.16360.43532
450.0255240.19610.42262
46-0.009616-0.07390.470686
470.0064780.04980.480242
48-0.033887-0.26030.397773
49-0.08392-0.64460.260842
50-0.024998-0.1920.424196
510.0223120.17140.432254
520.0104960.08060.468009
530.0225350.17310.431585
54-0.030961-0.23780.406424
550.0428290.3290.37167
56-0.009012-0.06920.472523
57-0.080074-0.61510.27044
58-0.011968-0.09190.463532
59NANANA
60NANANA


Parameters (Session):
par1 = 60 ; par2 = 1 ; par3 = 2 ; par4 = 0 ; par5 = 12 ; par6 = White Noise ; par7 = 0.95 ;
Parameters (R input):
par1 = 60 ; par2 = 1 ; par3 = 2 ; par4 = 0 ; par5 = 12 ; par6 = White Noise ; par7 = 0.95 ;
R code (references can be found in the software module):
if (par1 == 'Default') {
par1 = 10*log10(length(x))
} else {
par1 <- as.numeric(par1)
}
par2 <- as.numeric(par2)
par3 <- as.numeric(par3)
par4 <- as.numeric(par4)
par5 <- as.numeric(par5)
if (par6 == 'White Noise') par6 <- 'white' else par6 <- 'ma'
par7 <- as.numeric(par7)
if (par2 == 0) {
x <- log(x)
} else {
x <- (x ^ par2 - 1) / par2
}
if (par3 > 0) x <- diff(x,lag=1,difference=par3)
if (par4 > 0) x <- diff(x,lag=par5,difference=par4)
bitmap(file='pic1.png')
racf <- acf(x, par1, main='Autocorrelation', xlab='time lag', ylab='ACF', ci.type=par6, ci=par7, sub=paste('(lambda=',par2,', d=',par3,', D=',par4,', CI=', par7, ', CI type=',par6,')',sep=''))
dev.off()
bitmap(file='pic2.png')
rpacf <- pacf(x,par1,main='Partial Autocorrelation',xlab='lags',ylab='PACF')
dev.off()
(myacf <- c(racf$acf))
(mypacf <- c(rpacf$acf))
lengthx <- length(x)
sqrtn <- sqrt(lengthx)
load(file='createtable')
a<-table.start()
a<-table.row.start(a)
a<-table.element(a,'Autocorrelation Function',4,TRUE)
a<-table.row.end(a)
a<-table.row.start(a)
a<-table.element(a,'Time lag k',header=TRUE)
a<-table.element(a,hyperlink('basics.htm','ACF(k)','click here for more information about the Autocorrelation Function'),header=TRUE)
a<-table.element(a,'T-STAT',header=TRUE)
a<-table.element(a,'P-value',header=TRUE)
a<-table.row.end(a)
for (i in 2:(par1+1)) {
a<-table.row.start(a)
a<-table.element(a,i-1,header=TRUE)
a<-table.element(a,round(myacf[i],6))
mytstat <- myacf[i]*sqrtn
a<-table.element(a,round(mytstat,4))
a<-table.element(a,round(1-pt(abs(mytstat),lengthx),6))
a<-table.row.end(a)
}
a<-table.end(a)
table.save(a,file='mytable.tab')
a<-table.start()
a<-table.row.start(a)
a<-table.element(a,'Partial Autocorrelation Function',4,TRUE)
a<-table.row.end(a)
a<-table.row.start(a)
a<-table.element(a,'Time lag k',header=TRUE)
a<-table.element(a,hyperlink('basics.htm','PACF(k)','click here for more information about the Partial Autocorrelation Function'),header=TRUE)
a<-table.element(a,'T-STAT',header=TRUE)
a<-table.element(a,'P-value',header=TRUE)
a<-table.row.end(a)
for (i in 1:par1) {
a<-table.row.start(a)
a<-table.element(a,i,header=TRUE)
a<-table.element(a,round(mypacf[i],6))
mytstat <- mypacf[i]*sqrtn
a<-table.element(a,round(mytstat,4))
a<-table.element(a,round(1-pt(abs(mytstat),lengthx),6))
a<-table.row.end(a)
}
a<-table.end(a)
table.save(a,file='mytable1.tab')