Free Statistics

of Irreproducible Research!

Author's title

Author*The author of this computation has been verified*
R Software Modulerwasp_autocorrelation.wasp
Title produced by software(Partial) Autocorrelation Function
Date of computationThu, 26 Nov 2009 03:51:55 -0700
Cite this page as followsStatistical Computations at FreeStatistics.org, Office for Research Development and Education, URL https://freestatistics.org/blog/index.php?v=date/2009/Nov/26/t12592329319k1kvaeye8aurlx.htm/, Retrieved Mon, 29 Apr 2024 02:37:16 +0000
Statistical Computations at FreeStatistics.org, Office for Research Development and Education, URL https://freestatistics.org/blog/index.php?pk=59813, Retrieved Mon, 29 Apr 2024 02:37:16 +0000
QR Codes:

Original text written by user:
IsPrivate?No (this computation is public)
User-defined keywords
Estimated Impact126
Family? (F = Feedback message, R = changed R code, M = changed R Module, P = changed Parameters, D = changed Data)
-     [Univariate Explorative Data Analysis] [Run Sequence gebo...] [2008-12-12 13:32:37] [76963dc1903f0f612b6153510a3818cf]
- R  D  [Univariate Explorative Data Analysis] [Run Sequence gebo...] [2008-12-17 12:14:40] [76963dc1903f0f612b6153510a3818cf]
-         [Univariate Explorative Data Analysis] [Run Sequence Plot...] [2008-12-22 18:19:51] [1ce0d16c8f4225c977b42c8fa93bc163]
- RMP       [(Partial) Autocorrelation Function] [Identifying Integ...] [2009-11-22 12:16:10] [b98453cac15ba1066b407e146608df68]
-    D          [(Partial) Autocorrelation Function] [workshop 3] [2009-11-26 10:51:55] [0852d9c28828e87a0aee4d255e088d63] [Current]
Feedback Forum

Post a new message
Dataseries X:
108.2
108.8
110.2
109.5
109.5
116
111.2
112.1
114
119.1
114.1
115.1
115.4
110.8
116
119.2
126.5
127.8
131.3
140.3
137.3
143
134.5
139.9
159.3
170.4
175
175.8
180.9
180.3
169.6
172.3
184.8
177.7
184.6
211.4
215.3
215.9
244.7
259.3
289
310.9
321
315.1
333.2
314.1
284.7
273.9
216
196.4
190.9
206.4
196.3
199.5
198.9
214.4
214.2
187.6
180.6
172.2


Summary of computational transaction
Raw Inputview raw input (R code)
Raw Outputview raw output of R engine
Computing time1 seconds
R Server'Gwilym Jenkins' @ 72.249.127.135

\begin{tabular}{lllllllll}
\hline
Summary of computational transaction \tabularnewline
Raw Input & view raw input (R code)  \tabularnewline
Raw Output & view raw output of R engine  \tabularnewline
Computing time & 1 seconds \tabularnewline
R Server & 'Gwilym Jenkins' @ 72.249.127.135 \tabularnewline
\hline
\end{tabular}
%Source: https://freestatistics.org/blog/index.php?pk=59813&T=0

[TABLE]
[ROW][C]Summary of computational transaction[/C][/ROW]
[ROW][C]Raw Input[/C][C]view raw input (R code) [/C][/ROW]
[ROW][C]Raw Output[/C][C]view raw output of R engine [/C][/ROW]
[ROW][C]Computing time[/C][C]1 seconds[/C][/ROW]
[ROW][C]R Server[/C][C]'Gwilym Jenkins' @ 72.249.127.135[/C][/ROW]
[/TABLE]
Source: https://freestatistics.org/blog/index.php?pk=59813&T=0

Globally Unique Identifier (entire table): ba.freestatistics.org/blog/index.php?pk=59813&T=0

As an alternative you can also use a QR Code:  

The GUIDs for individual cells are displayed in the table below:

Summary of computational transaction
Raw Inputview raw input (R code)
Raw Outputview raw output of R engine
Computing time1 seconds
R Server'Gwilym Jenkins' @ 72.249.127.135


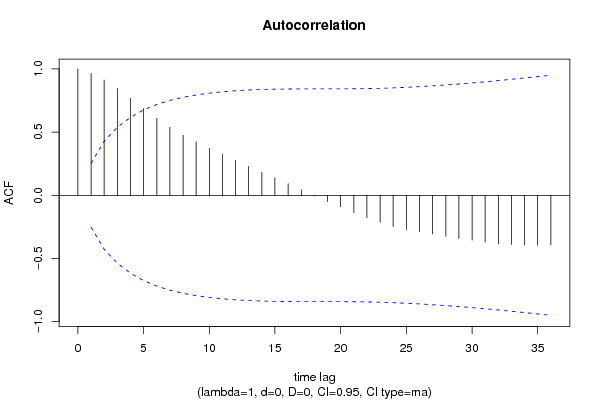
Autocorrelation Function
Time lag kACF(k)T-STATP-value
10.9648017.47330
20.9117227.06220
30.8456576.55040
40.767945.94840
50.6865625.31811e-06
60.6104314.72847e-06
70.5377534.16545.1e-05
80.4743033.67390.000255
90.4240983.2850.000853
100.3729452.88880.002686
110.3256412.52240.007163
120.2769112.14490.018008
130.2279941.7660.041239
140.1812311.40380.082765
150.1379461.06850.144782
160.0914830.70860.240651
170.0429020.33230.370404
18-0.00446-0.03450.486277
19-0.04944-0.3830.35155
20-0.091798-0.71110.2399
21-0.136726-1.05910.146904
22-0.177424-1.37430.087227
23-0.214345-1.66030.051035
24-0.247879-1.92010.029804
25-0.271674-2.10440.019772
26-0.28865-2.23590.014546
27-0.306727-2.37590.010358
28-0.325066-2.51790.007245
29-0.341279-2.64350.005226
30-0.354345-2.74470.003989
31-0.370102-2.86680.002856
32-0.383186-2.96810.00215
33-0.389943-3.02050.001852
34-0.39569-3.0650.00163
35-0.396309-3.06980.001608
36-0.391117-3.02960.001805

\begin{tabular}{lllllllll}
\hline
Autocorrelation Function \tabularnewline
Time lag k & ACF(k) & T-STAT & P-value \tabularnewline
1 & 0.964801 & 7.4733 & 0 \tabularnewline
2 & 0.911722 & 7.0622 & 0 \tabularnewline
3 & 0.845657 & 6.5504 & 0 \tabularnewline
4 & 0.76794 & 5.9484 & 0 \tabularnewline
5 & 0.686562 & 5.3181 & 1e-06 \tabularnewline
6 & 0.610431 & 4.7284 & 7e-06 \tabularnewline
7 & 0.537753 & 4.1654 & 5.1e-05 \tabularnewline
8 & 0.474303 & 3.6739 & 0.000255 \tabularnewline
9 & 0.424098 & 3.285 & 0.000853 \tabularnewline
10 & 0.372945 & 2.8888 & 0.002686 \tabularnewline
11 & 0.325641 & 2.5224 & 0.007163 \tabularnewline
12 & 0.276911 & 2.1449 & 0.018008 \tabularnewline
13 & 0.227994 & 1.766 & 0.041239 \tabularnewline
14 & 0.181231 & 1.4038 & 0.082765 \tabularnewline
15 & 0.137946 & 1.0685 & 0.144782 \tabularnewline
16 & 0.091483 & 0.7086 & 0.240651 \tabularnewline
17 & 0.042902 & 0.3323 & 0.370404 \tabularnewline
18 & -0.00446 & -0.0345 & 0.486277 \tabularnewline
19 & -0.04944 & -0.383 & 0.35155 \tabularnewline
20 & -0.091798 & -0.7111 & 0.2399 \tabularnewline
21 & -0.136726 & -1.0591 & 0.146904 \tabularnewline
22 & -0.177424 & -1.3743 & 0.087227 \tabularnewline
23 & -0.214345 & -1.6603 & 0.051035 \tabularnewline
24 & -0.247879 & -1.9201 & 0.029804 \tabularnewline
25 & -0.271674 & -2.1044 & 0.019772 \tabularnewline
26 & -0.28865 & -2.2359 & 0.014546 \tabularnewline
27 & -0.306727 & -2.3759 & 0.010358 \tabularnewline
28 & -0.325066 & -2.5179 & 0.007245 \tabularnewline
29 & -0.341279 & -2.6435 & 0.005226 \tabularnewline
30 & -0.354345 & -2.7447 & 0.003989 \tabularnewline
31 & -0.370102 & -2.8668 & 0.002856 \tabularnewline
32 & -0.383186 & -2.9681 & 0.00215 \tabularnewline
33 & -0.389943 & -3.0205 & 0.001852 \tabularnewline
34 & -0.39569 & -3.065 & 0.00163 \tabularnewline
35 & -0.396309 & -3.0698 & 0.001608 \tabularnewline
36 & -0.391117 & -3.0296 & 0.001805 \tabularnewline
\hline
\end{tabular}
%Source: https://freestatistics.org/blog/index.php?pk=59813&T=1

[TABLE]
[ROW][C]Autocorrelation Function[/C][/ROW]
[ROW][C]Time lag k[/C][C]ACF(k)[/C][C]T-STAT[/C][C]P-value[/C][/ROW]
[ROW][C]1[/C][C]0.964801[/C][C]7.4733[/C][C]0[/C][/ROW]
[ROW][C]2[/C][C]0.911722[/C][C]7.0622[/C][C]0[/C][/ROW]
[ROW][C]3[/C][C]0.845657[/C][C]6.5504[/C][C]0[/C][/ROW]
[ROW][C]4[/C][C]0.76794[/C][C]5.9484[/C][C]0[/C][/ROW]
[ROW][C]5[/C][C]0.686562[/C][C]5.3181[/C][C]1e-06[/C][/ROW]
[ROW][C]6[/C][C]0.610431[/C][C]4.7284[/C][C]7e-06[/C][/ROW]
[ROW][C]7[/C][C]0.537753[/C][C]4.1654[/C][C]5.1e-05[/C][/ROW]
[ROW][C]8[/C][C]0.474303[/C][C]3.6739[/C][C]0.000255[/C][/ROW]
[ROW][C]9[/C][C]0.424098[/C][C]3.285[/C][C]0.000853[/C][/ROW]
[ROW][C]10[/C][C]0.372945[/C][C]2.8888[/C][C]0.002686[/C][/ROW]
[ROW][C]11[/C][C]0.325641[/C][C]2.5224[/C][C]0.007163[/C][/ROW]
[ROW][C]12[/C][C]0.276911[/C][C]2.1449[/C][C]0.018008[/C][/ROW]
[ROW][C]13[/C][C]0.227994[/C][C]1.766[/C][C]0.041239[/C][/ROW]
[ROW][C]14[/C][C]0.181231[/C][C]1.4038[/C][C]0.082765[/C][/ROW]
[ROW][C]15[/C][C]0.137946[/C][C]1.0685[/C][C]0.144782[/C][/ROW]
[ROW][C]16[/C][C]0.091483[/C][C]0.7086[/C][C]0.240651[/C][/ROW]
[ROW][C]17[/C][C]0.042902[/C][C]0.3323[/C][C]0.370404[/C][/ROW]
[ROW][C]18[/C][C]-0.00446[/C][C]-0.0345[/C][C]0.486277[/C][/ROW]
[ROW][C]19[/C][C]-0.04944[/C][C]-0.383[/C][C]0.35155[/C][/ROW]
[ROW][C]20[/C][C]-0.091798[/C][C]-0.7111[/C][C]0.2399[/C][/ROW]
[ROW][C]21[/C][C]-0.136726[/C][C]-1.0591[/C][C]0.146904[/C][/ROW]
[ROW][C]22[/C][C]-0.177424[/C][C]-1.3743[/C][C]0.087227[/C][/ROW]
[ROW][C]23[/C][C]-0.214345[/C][C]-1.6603[/C][C]0.051035[/C][/ROW]
[ROW][C]24[/C][C]-0.247879[/C][C]-1.9201[/C][C]0.029804[/C][/ROW]
[ROW][C]25[/C][C]-0.271674[/C][C]-2.1044[/C][C]0.019772[/C][/ROW]
[ROW][C]26[/C][C]-0.28865[/C][C]-2.2359[/C][C]0.014546[/C][/ROW]
[ROW][C]27[/C][C]-0.306727[/C][C]-2.3759[/C][C]0.010358[/C][/ROW]
[ROW][C]28[/C][C]-0.325066[/C][C]-2.5179[/C][C]0.007245[/C][/ROW]
[ROW][C]29[/C][C]-0.341279[/C][C]-2.6435[/C][C]0.005226[/C][/ROW]
[ROW][C]30[/C][C]-0.354345[/C][C]-2.7447[/C][C]0.003989[/C][/ROW]
[ROW][C]31[/C][C]-0.370102[/C][C]-2.8668[/C][C]0.002856[/C][/ROW]
[ROW][C]32[/C][C]-0.383186[/C][C]-2.9681[/C][C]0.00215[/C][/ROW]
[ROW][C]33[/C][C]-0.389943[/C][C]-3.0205[/C][C]0.001852[/C][/ROW]
[ROW][C]34[/C][C]-0.39569[/C][C]-3.065[/C][C]0.00163[/C][/ROW]
[ROW][C]35[/C][C]-0.396309[/C][C]-3.0698[/C][C]0.001608[/C][/ROW]
[ROW][C]36[/C][C]-0.391117[/C][C]-3.0296[/C][C]0.001805[/C][/ROW]
[/TABLE]
Source: https://freestatistics.org/blog/index.php?pk=59813&T=1

Globally Unique Identifier (entire table): ba.freestatistics.org/blog/index.php?pk=59813&T=1

As an alternative you can also use a QR Code:  

The GUIDs for individual cells are displayed in the table below:

Autocorrelation Function
Time lag kACF(k)T-STATP-value
10.9648017.47330
20.9117227.06220
30.8456576.55040
40.767945.94840
50.6865625.31811e-06
60.6104314.72847e-06
70.5377534.16545.1e-05
80.4743033.67390.000255
90.4240983.2850.000853
100.3729452.88880.002686
110.3256412.52240.007163
120.2769112.14490.018008
130.2279941.7660.041239
140.1812311.40380.082765
150.1379461.06850.144782
160.0914830.70860.240651
170.0429020.33230.370404
18-0.00446-0.03450.486277
19-0.04944-0.3830.35155
20-0.091798-0.71110.2399
21-0.136726-1.05910.146904
22-0.177424-1.37430.087227
23-0.214345-1.66030.051035
24-0.247879-1.92010.029804
25-0.271674-2.10440.019772
26-0.28865-2.23590.014546
27-0.306727-2.37590.010358
28-0.325066-2.51790.007245
29-0.341279-2.64350.005226
30-0.354345-2.74470.003989
31-0.370102-2.86680.002856
32-0.383186-2.96810.00215
33-0.389943-3.02050.001852
34-0.39569-3.0650.00163
35-0.396309-3.06980.001608
36-0.391117-3.02960.001805


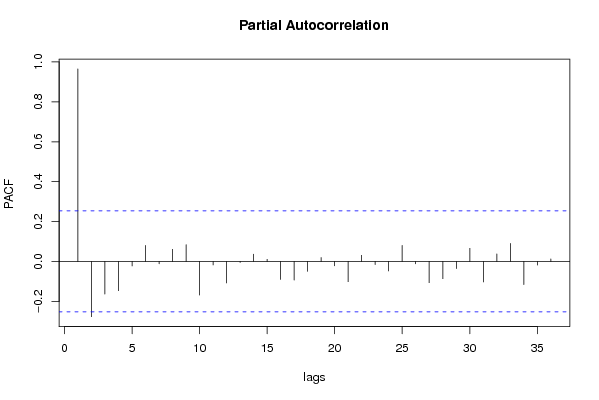
Partial Autocorrelation Function
Time lag kPACF(k)T-STATP-value
10.9648017.47330
2-0.276453-2.14140.018156
3-0.163256-1.26460.105456
4-0.14615-1.13210.131054
5-0.022101-0.17120.432325
60.0802820.62190.268194
7-0.011778-0.09120.463807
80.0607150.47030.319924
90.0842710.65280.258203
10-0.168211-1.3030.098784
11-0.017354-0.13440.446759
12-0.107585-0.83330.203977
13-0.004481-0.03470.486212
140.0365190.28290.389123
150.0109110.08450.466463
16-0.09022-0.69880.243675
17-0.092895-0.71960.237294
18-0.049197-0.38110.352245
190.019350.14990.440681
20-0.021723-0.16830.433471
21-0.100985-0.78220.218578
220.0311190.2410.40517
23-0.015365-0.1190.452829
24-0.047195-0.36560.357985
250.0802140.62130.268368
26-0.011914-0.09230.46339
27-0.106422-0.82430.206505
28-0.086086-0.66680.253721
29-0.035426-0.27440.392356
300.066090.51190.30529
31-0.102327-0.79260.21556
320.037550.29090.386079
330.09070.70260.242523
34-0.115925-0.8980.1864
35-0.018166-0.14070.444284
360.012810.09920.460644

\begin{tabular}{lllllllll}
\hline
Partial Autocorrelation Function \tabularnewline
Time lag k & PACF(k) & T-STAT & P-value \tabularnewline
1 & 0.964801 & 7.4733 & 0 \tabularnewline
2 & -0.276453 & -2.1414 & 0.018156 \tabularnewline
3 & -0.163256 & -1.2646 & 0.105456 \tabularnewline
4 & -0.14615 & -1.1321 & 0.131054 \tabularnewline
5 & -0.022101 & -0.1712 & 0.432325 \tabularnewline
6 & 0.080282 & 0.6219 & 0.268194 \tabularnewline
7 & -0.011778 & -0.0912 & 0.463807 \tabularnewline
8 & 0.060715 & 0.4703 & 0.319924 \tabularnewline
9 & 0.084271 & 0.6528 & 0.258203 \tabularnewline
10 & -0.168211 & -1.303 & 0.098784 \tabularnewline
11 & -0.017354 & -0.1344 & 0.446759 \tabularnewline
12 & -0.107585 & -0.8333 & 0.203977 \tabularnewline
13 & -0.004481 & -0.0347 & 0.486212 \tabularnewline
14 & 0.036519 & 0.2829 & 0.389123 \tabularnewline
15 & 0.010911 & 0.0845 & 0.466463 \tabularnewline
16 & -0.09022 & -0.6988 & 0.243675 \tabularnewline
17 & -0.092895 & -0.7196 & 0.237294 \tabularnewline
18 & -0.049197 & -0.3811 & 0.352245 \tabularnewline
19 & 0.01935 & 0.1499 & 0.440681 \tabularnewline
20 & -0.021723 & -0.1683 & 0.433471 \tabularnewline
21 & -0.100985 & -0.7822 & 0.218578 \tabularnewline
22 & 0.031119 & 0.241 & 0.40517 \tabularnewline
23 & -0.015365 & -0.119 & 0.452829 \tabularnewline
24 & -0.047195 & -0.3656 & 0.357985 \tabularnewline
25 & 0.080214 & 0.6213 & 0.268368 \tabularnewline
26 & -0.011914 & -0.0923 & 0.46339 \tabularnewline
27 & -0.106422 & -0.8243 & 0.206505 \tabularnewline
28 & -0.086086 & -0.6668 & 0.253721 \tabularnewline
29 & -0.035426 & -0.2744 & 0.392356 \tabularnewline
30 & 0.06609 & 0.5119 & 0.30529 \tabularnewline
31 & -0.102327 & -0.7926 & 0.21556 \tabularnewline
32 & 0.03755 & 0.2909 & 0.386079 \tabularnewline
33 & 0.0907 & 0.7026 & 0.242523 \tabularnewline
34 & -0.115925 & -0.898 & 0.1864 \tabularnewline
35 & -0.018166 & -0.1407 & 0.444284 \tabularnewline
36 & 0.01281 & 0.0992 & 0.460644 \tabularnewline
\hline
\end{tabular}
%Source: https://freestatistics.org/blog/index.php?pk=59813&T=2

[TABLE]
[ROW][C]Partial Autocorrelation Function[/C][/ROW]
[ROW][C]Time lag k[/C][C]PACF(k)[/C][C]T-STAT[/C][C]P-value[/C][/ROW]
[ROW][C]1[/C][C]0.964801[/C][C]7.4733[/C][C]0[/C][/ROW]
[ROW][C]2[/C][C]-0.276453[/C][C]-2.1414[/C][C]0.018156[/C][/ROW]
[ROW][C]3[/C][C]-0.163256[/C][C]-1.2646[/C][C]0.105456[/C][/ROW]
[ROW][C]4[/C][C]-0.14615[/C][C]-1.1321[/C][C]0.131054[/C][/ROW]
[ROW][C]5[/C][C]-0.022101[/C][C]-0.1712[/C][C]0.432325[/C][/ROW]
[ROW][C]6[/C][C]0.080282[/C][C]0.6219[/C][C]0.268194[/C][/ROW]
[ROW][C]7[/C][C]-0.011778[/C][C]-0.0912[/C][C]0.463807[/C][/ROW]
[ROW][C]8[/C][C]0.060715[/C][C]0.4703[/C][C]0.319924[/C][/ROW]
[ROW][C]9[/C][C]0.084271[/C][C]0.6528[/C][C]0.258203[/C][/ROW]
[ROW][C]10[/C][C]-0.168211[/C][C]-1.303[/C][C]0.098784[/C][/ROW]
[ROW][C]11[/C][C]-0.017354[/C][C]-0.1344[/C][C]0.446759[/C][/ROW]
[ROW][C]12[/C][C]-0.107585[/C][C]-0.8333[/C][C]0.203977[/C][/ROW]
[ROW][C]13[/C][C]-0.004481[/C][C]-0.0347[/C][C]0.486212[/C][/ROW]
[ROW][C]14[/C][C]0.036519[/C][C]0.2829[/C][C]0.389123[/C][/ROW]
[ROW][C]15[/C][C]0.010911[/C][C]0.0845[/C][C]0.466463[/C][/ROW]
[ROW][C]16[/C][C]-0.09022[/C][C]-0.6988[/C][C]0.243675[/C][/ROW]
[ROW][C]17[/C][C]-0.092895[/C][C]-0.7196[/C][C]0.237294[/C][/ROW]
[ROW][C]18[/C][C]-0.049197[/C][C]-0.3811[/C][C]0.352245[/C][/ROW]
[ROW][C]19[/C][C]0.01935[/C][C]0.1499[/C][C]0.440681[/C][/ROW]
[ROW][C]20[/C][C]-0.021723[/C][C]-0.1683[/C][C]0.433471[/C][/ROW]
[ROW][C]21[/C][C]-0.100985[/C][C]-0.7822[/C][C]0.218578[/C][/ROW]
[ROW][C]22[/C][C]0.031119[/C][C]0.241[/C][C]0.40517[/C][/ROW]
[ROW][C]23[/C][C]-0.015365[/C][C]-0.119[/C][C]0.452829[/C][/ROW]
[ROW][C]24[/C][C]-0.047195[/C][C]-0.3656[/C][C]0.357985[/C][/ROW]
[ROW][C]25[/C][C]0.080214[/C][C]0.6213[/C][C]0.268368[/C][/ROW]
[ROW][C]26[/C][C]-0.011914[/C][C]-0.0923[/C][C]0.46339[/C][/ROW]
[ROW][C]27[/C][C]-0.106422[/C][C]-0.8243[/C][C]0.206505[/C][/ROW]
[ROW][C]28[/C][C]-0.086086[/C][C]-0.6668[/C][C]0.253721[/C][/ROW]
[ROW][C]29[/C][C]-0.035426[/C][C]-0.2744[/C][C]0.392356[/C][/ROW]
[ROW][C]30[/C][C]0.06609[/C][C]0.5119[/C][C]0.30529[/C][/ROW]
[ROW][C]31[/C][C]-0.102327[/C][C]-0.7926[/C][C]0.21556[/C][/ROW]
[ROW][C]32[/C][C]0.03755[/C][C]0.2909[/C][C]0.386079[/C][/ROW]
[ROW][C]33[/C][C]0.0907[/C][C]0.7026[/C][C]0.242523[/C][/ROW]
[ROW][C]34[/C][C]-0.115925[/C][C]-0.898[/C][C]0.1864[/C][/ROW]
[ROW][C]35[/C][C]-0.018166[/C][C]-0.1407[/C][C]0.444284[/C][/ROW]
[ROW][C]36[/C][C]0.01281[/C][C]0.0992[/C][C]0.460644[/C][/ROW]
[/TABLE]
Source: https://freestatistics.org/blog/index.php?pk=59813&T=2

Globally Unique Identifier (entire table): ba.freestatistics.org/blog/index.php?pk=59813&T=2

As an alternative you can also use a QR Code:  

The GUIDs for individual cells are displayed in the table below:

Partial Autocorrelation Function
Time lag kPACF(k)T-STATP-value
10.9648017.47330
2-0.276453-2.14140.018156
3-0.163256-1.26460.105456
4-0.14615-1.13210.131054
5-0.022101-0.17120.432325
60.0802820.62190.268194
7-0.011778-0.09120.463807
80.0607150.47030.319924
90.0842710.65280.258203
10-0.168211-1.3030.098784
11-0.017354-0.13440.446759
12-0.107585-0.83330.203977
13-0.004481-0.03470.486212
140.0365190.28290.389123
150.0109110.08450.466463
16-0.09022-0.69880.243675
17-0.092895-0.71960.237294
18-0.049197-0.38110.352245
190.019350.14990.440681
20-0.021723-0.16830.433471
21-0.100985-0.78220.218578
220.0311190.2410.40517
23-0.015365-0.1190.452829
24-0.047195-0.36560.357985
250.0802140.62130.268368
26-0.011914-0.09230.46339
27-0.106422-0.82430.206505
28-0.086086-0.66680.253721
29-0.035426-0.27440.392356
300.066090.51190.30529
31-0.102327-0.79260.21556
320.037550.29090.386079
330.09070.70260.242523
34-0.115925-0.8980.1864
35-0.018166-0.14070.444284
360.012810.09920.460644


Parameters (Session):
par1 = 36 ; par2 = 1 ; par3 = 0 ; par4 = 0 ; par5 = 12 ; par6 = MA ; par7 = 0.95 ;
Parameters (R input):
par1 = 36 ; par2 = 1 ; par3 = 0 ; par4 = 0 ; par5 = 12 ; par6 = MA ; par7 = 0.95 ;
R code (references can be found in the software module):
if (par1 == 'Default') {
par1 = 10*log10(length(x))
} else {
par1 <- as.numeric(par1)
}
par2 <- as.numeric(par2)
par3 <- as.numeric(par3)
par4 <- as.numeric(par4)
par5 <- as.numeric(par5)
if (par6 == 'White Noise') par6 <- 'white' else par6 <- 'ma'
par7 <- as.numeric(par7)
if (par2 == 0) {
x <- log(x)
} else {
x <- (x ^ par2 - 1) / par2
}
if (par3 > 0) x <- diff(x,lag=1,difference=par3)
if (par4 > 0) x <- diff(x,lag=par5,difference=par4)
bitmap(file='pic1.png')
racf <- acf(x, par1, main='Autocorrelation', xlab='time lag', ylab='ACF', ci.type=par6, ci=par7, sub=paste('(lambda=',par2,', d=',par3,', D=',par4,', CI=', par7, ', CI type=',par6,')',sep=''))
dev.off()
bitmap(file='pic2.png')
rpacf <- pacf(x,par1,main='Partial Autocorrelation',xlab='lags',ylab='PACF')
dev.off()
(myacf <- c(racf$acf))
(mypacf <- c(rpacf$acf))
lengthx <- length(x)
sqrtn <- sqrt(lengthx)
load(file='createtable')
a<-table.start()
a<-table.row.start(a)
a<-table.element(a,'Autocorrelation Function',4,TRUE)
a<-table.row.end(a)
a<-table.row.start(a)
a<-table.element(a,'Time lag k',header=TRUE)
a<-table.element(a,hyperlink('basics.htm','ACF(k)','click here for more information about the Autocorrelation Function'),header=TRUE)
a<-table.element(a,'T-STAT',header=TRUE)
a<-table.element(a,'P-value',header=TRUE)
a<-table.row.end(a)
for (i in 2:(par1+1)) {
a<-table.row.start(a)
a<-table.element(a,i-1,header=TRUE)
a<-table.element(a,round(myacf[i],6))
mytstat <- myacf[i]*sqrtn
a<-table.element(a,round(mytstat,4))
a<-table.element(a,round(1-pt(abs(mytstat),lengthx),6))
a<-table.row.end(a)
}
a<-table.end(a)
table.save(a,file='mytable.tab')
a<-table.start()
a<-table.row.start(a)
a<-table.element(a,'Partial Autocorrelation Function',4,TRUE)
a<-table.row.end(a)
a<-table.row.start(a)
a<-table.element(a,'Time lag k',header=TRUE)
a<-table.element(a,hyperlink('basics.htm','PACF(k)','click here for more information about the Partial Autocorrelation Function'),header=TRUE)
a<-table.element(a,'T-STAT',header=TRUE)
a<-table.element(a,'P-value',header=TRUE)
a<-table.row.end(a)
for (i in 1:par1) {
a<-table.row.start(a)
a<-table.element(a,i,header=TRUE)
a<-table.element(a,round(mypacf[i],6))
mytstat <- mypacf[i]*sqrtn
a<-table.element(a,round(mytstat,4))
a<-table.element(a,round(1-pt(abs(mytstat),lengthx),6))
a<-table.row.end(a)
}
a<-table.end(a)
table.save(a,file='mytable1.tab')