Free Statistics

of Irreproducible Research!

Author's title

Author*The author of this computation has been verified*
R Software Modulerwasp_autocorrelation.wasp
Title produced by software(Partial) Autocorrelation Function
Date of computationThu, 26 Nov 2009 04:04:07 -0700
Cite this page as followsStatistical Computations at FreeStatistics.org, Office for Research Development and Education, URL https://freestatistics.org/blog/index.php?v=date/2009/Nov/26/t1259233542my66fdeznayysj9.htm/, Retrieved Mon, 29 Apr 2024 05:37:57 +0000
Statistical Computations at FreeStatistics.org, Office for Research Development and Education, URL https://freestatistics.org/blog/index.php?pk=59825, Retrieved Mon, 29 Apr 2024 05:37:57 +0000
QR Codes:

Original text written by user:
IsPrivate?No (this computation is public)
User-defined keywords
Estimated Impact133
Family? (F = Feedback message, R = changed R code, M = changed R Module, P = changed Parameters, D = changed Data)
-     [Univariate Explorative Data Analysis] [Run Sequence gebo...] [2008-12-12 13:32:37] [76963dc1903f0f612b6153510a3818cf]
- R  D  [Univariate Explorative Data Analysis] [Run Sequence gebo...] [2008-12-17 12:14:40] [76963dc1903f0f612b6153510a3818cf]
-         [Univariate Explorative Data Analysis] [Run Sequence Plot...] [2008-12-22 18:19:51] [1ce0d16c8f4225c977b42c8fa93bc163]
- RMP       [(Partial) Autocorrelation Function] [Identifying Integ...] [2009-11-22 12:19:56] [b98453cac15ba1066b407e146608df68]
-    D          [(Partial) Autocorrelation Function] [workshop 3] [2009-11-26 11:04:07] [0852d9c28828e87a0aee4d255e088d63] [Current]
Feedback Forum

Post a new message
Dataseries X:
108.2
108.8
110.2
109.5
109.5
116
111.2
112.1
114
119.1
114.1
115.1
115.4
110.8
116
119.2
126.5
127.8
131.3
140.3
137.3
143
134.5
139.9
159.3
170.4
175
175.8
180.9
180.3
169.6
172.3
184.8
177.7
184.6
211.4
215.3
215.9
244.7
259.3
289
310.9
321
315.1
333.2
314.1
284.7
273.9
216
196.4
190.9
206.4
196.3
199.5
198.9
214.4
214.2
187.6
180.6
172.2


Summary of computational transaction
Raw Inputview raw input (R code)
Raw Outputview raw output of R engine
Computing time2 seconds
R Server'Gwilym Jenkins' @ 72.249.127.135

\begin{tabular}{lllllllll}
\hline
Summary of computational transaction \tabularnewline
Raw Input & view raw input (R code)  \tabularnewline
Raw Output & view raw output of R engine  \tabularnewline
Computing time & 2 seconds \tabularnewline
R Server & 'Gwilym Jenkins' @ 72.249.127.135 \tabularnewline
\hline
\end{tabular}
%Source: https://freestatistics.org/blog/index.php?pk=59825&T=0

[TABLE]
[ROW][C]Summary of computational transaction[/C][/ROW]
[ROW][C]Raw Input[/C][C]view raw input (R code) [/C][/ROW]
[ROW][C]Raw Output[/C][C]view raw output of R engine [/C][/ROW]
[ROW][C]Computing time[/C][C]2 seconds[/C][/ROW]
[ROW][C]R Server[/C][C]'Gwilym Jenkins' @ 72.249.127.135[/C][/ROW]
[/TABLE]
Source: https://freestatistics.org/blog/index.php?pk=59825&T=0

Globally Unique Identifier (entire table): ba.freestatistics.org/blog/index.php?pk=59825&T=0

As an alternative you can also use a QR Code:  

The GUIDs for individual cells are displayed in the table below:

Summary of computational transaction
Raw Inputview raw input (R code)
Raw Outputview raw output of R engine
Computing time2 seconds
R Server'Gwilym Jenkins' @ 72.249.127.135


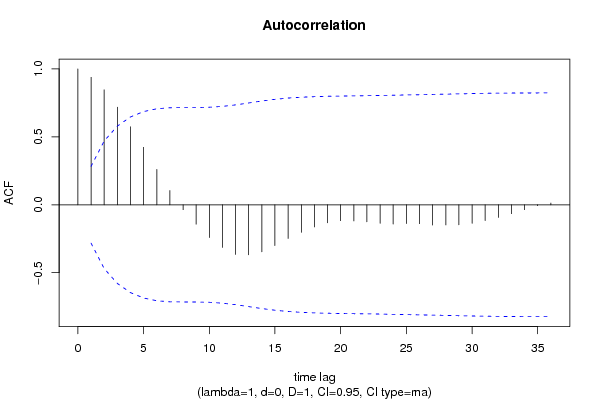
Autocorrelation Function
Time lag kACF(k)T-STATP-value
10.9384126.50150
20.8462055.86270
30.7182584.97624e-06
40.5742843.97880.000117
50.4227322.92880.002596
60.260611.80560.038631
70.1045780.72450.236126
8-0.036141-0.25040.401675
9-0.142987-0.99060.163414
10-0.241624-1.6740.050316
11-0.313841-2.17440.01732
12-0.365203-2.53020.007367
13-0.368495-2.5530.006957
14-0.346211-2.39860.010196
15-0.300322-2.08070.021411
16-0.2474-1.7140.046486
17-0.203074-1.40690.082944
18-0.163256-1.13110.131822
19-0.132572-0.91850.181479
20-0.116734-0.80880.211323
21-0.118518-0.82110.20782
22-0.125413-0.86890.194616
23-0.136779-0.94760.174031
24-0.142392-0.98650.164412
25-0.138315-0.95830.171363
26-0.139645-0.96750.169074
27-0.149128-1.03320.153346
28-0.148132-1.02630.154951
29-0.14722-1.020.156428
30-0.136414-0.94510.174669
31-0.116259-0.80550.212262
32-0.093532-0.6480.260033
33-0.065561-0.45420.325859
34-0.035795-0.2480.402598
35-0.006594-0.04570.481875
360.0126220.08740.46534

\begin{tabular}{lllllllll}
\hline
Autocorrelation Function \tabularnewline
Time lag k & ACF(k) & T-STAT & P-value \tabularnewline
1 & 0.938412 & 6.5015 & 0 \tabularnewline
2 & 0.846205 & 5.8627 & 0 \tabularnewline
3 & 0.718258 & 4.9762 & 4e-06 \tabularnewline
4 & 0.574284 & 3.9788 & 0.000117 \tabularnewline
5 & 0.422732 & 2.9288 & 0.002596 \tabularnewline
6 & 0.26061 & 1.8056 & 0.038631 \tabularnewline
7 & 0.104578 & 0.7245 & 0.236126 \tabularnewline
8 & -0.036141 & -0.2504 & 0.401675 \tabularnewline
9 & -0.142987 & -0.9906 & 0.163414 \tabularnewline
10 & -0.241624 & -1.674 & 0.050316 \tabularnewline
11 & -0.313841 & -2.1744 & 0.01732 \tabularnewline
12 & -0.365203 & -2.5302 & 0.007367 \tabularnewline
13 & -0.368495 & -2.553 & 0.006957 \tabularnewline
14 & -0.346211 & -2.3986 & 0.010196 \tabularnewline
15 & -0.300322 & -2.0807 & 0.021411 \tabularnewline
16 & -0.2474 & -1.714 & 0.046486 \tabularnewline
17 & -0.203074 & -1.4069 & 0.082944 \tabularnewline
18 & -0.163256 & -1.1311 & 0.131822 \tabularnewline
19 & -0.132572 & -0.9185 & 0.181479 \tabularnewline
20 & -0.116734 & -0.8088 & 0.211323 \tabularnewline
21 & -0.118518 & -0.8211 & 0.20782 \tabularnewline
22 & -0.125413 & -0.8689 & 0.194616 \tabularnewline
23 & -0.136779 & -0.9476 & 0.174031 \tabularnewline
24 & -0.142392 & -0.9865 & 0.164412 \tabularnewline
25 & -0.138315 & -0.9583 & 0.171363 \tabularnewline
26 & -0.139645 & -0.9675 & 0.169074 \tabularnewline
27 & -0.149128 & -1.0332 & 0.153346 \tabularnewline
28 & -0.148132 & -1.0263 & 0.154951 \tabularnewline
29 & -0.14722 & -1.02 & 0.156428 \tabularnewline
30 & -0.136414 & -0.9451 & 0.174669 \tabularnewline
31 & -0.116259 & -0.8055 & 0.212262 \tabularnewline
32 & -0.093532 & -0.648 & 0.260033 \tabularnewline
33 & -0.065561 & -0.4542 & 0.325859 \tabularnewline
34 & -0.035795 & -0.248 & 0.402598 \tabularnewline
35 & -0.006594 & -0.0457 & 0.481875 \tabularnewline
36 & 0.012622 & 0.0874 & 0.46534 \tabularnewline
\hline
\end{tabular}
%Source: https://freestatistics.org/blog/index.php?pk=59825&T=1

[TABLE]
[ROW][C]Autocorrelation Function[/C][/ROW]
[ROW][C]Time lag k[/C][C]ACF(k)[/C][C]T-STAT[/C][C]P-value[/C][/ROW]
[ROW][C]1[/C][C]0.938412[/C][C]6.5015[/C][C]0[/C][/ROW]
[ROW][C]2[/C][C]0.846205[/C][C]5.8627[/C][C]0[/C][/ROW]
[ROW][C]3[/C][C]0.718258[/C][C]4.9762[/C][C]4e-06[/C][/ROW]
[ROW][C]4[/C][C]0.574284[/C][C]3.9788[/C][C]0.000117[/C][/ROW]
[ROW][C]5[/C][C]0.422732[/C][C]2.9288[/C][C]0.002596[/C][/ROW]
[ROW][C]6[/C][C]0.26061[/C][C]1.8056[/C][C]0.038631[/C][/ROW]
[ROW][C]7[/C][C]0.104578[/C][C]0.7245[/C][C]0.236126[/C][/ROW]
[ROW][C]8[/C][C]-0.036141[/C][C]-0.2504[/C][C]0.401675[/C][/ROW]
[ROW][C]9[/C][C]-0.142987[/C][C]-0.9906[/C][C]0.163414[/C][/ROW]
[ROW][C]10[/C][C]-0.241624[/C][C]-1.674[/C][C]0.050316[/C][/ROW]
[ROW][C]11[/C][C]-0.313841[/C][C]-2.1744[/C][C]0.01732[/C][/ROW]
[ROW][C]12[/C][C]-0.365203[/C][C]-2.5302[/C][C]0.007367[/C][/ROW]
[ROW][C]13[/C][C]-0.368495[/C][C]-2.553[/C][C]0.006957[/C][/ROW]
[ROW][C]14[/C][C]-0.346211[/C][C]-2.3986[/C][C]0.010196[/C][/ROW]
[ROW][C]15[/C][C]-0.300322[/C][C]-2.0807[/C][C]0.021411[/C][/ROW]
[ROW][C]16[/C][C]-0.2474[/C][C]-1.714[/C][C]0.046486[/C][/ROW]
[ROW][C]17[/C][C]-0.203074[/C][C]-1.4069[/C][C]0.082944[/C][/ROW]
[ROW][C]18[/C][C]-0.163256[/C][C]-1.1311[/C][C]0.131822[/C][/ROW]
[ROW][C]19[/C][C]-0.132572[/C][C]-0.9185[/C][C]0.181479[/C][/ROW]
[ROW][C]20[/C][C]-0.116734[/C][C]-0.8088[/C][C]0.211323[/C][/ROW]
[ROW][C]21[/C][C]-0.118518[/C][C]-0.8211[/C][C]0.20782[/C][/ROW]
[ROW][C]22[/C][C]-0.125413[/C][C]-0.8689[/C][C]0.194616[/C][/ROW]
[ROW][C]23[/C][C]-0.136779[/C][C]-0.9476[/C][C]0.174031[/C][/ROW]
[ROW][C]24[/C][C]-0.142392[/C][C]-0.9865[/C][C]0.164412[/C][/ROW]
[ROW][C]25[/C][C]-0.138315[/C][C]-0.9583[/C][C]0.171363[/C][/ROW]
[ROW][C]26[/C][C]-0.139645[/C][C]-0.9675[/C][C]0.169074[/C][/ROW]
[ROW][C]27[/C][C]-0.149128[/C][C]-1.0332[/C][C]0.153346[/C][/ROW]
[ROW][C]28[/C][C]-0.148132[/C][C]-1.0263[/C][C]0.154951[/C][/ROW]
[ROW][C]29[/C][C]-0.14722[/C][C]-1.02[/C][C]0.156428[/C][/ROW]
[ROW][C]30[/C][C]-0.136414[/C][C]-0.9451[/C][C]0.174669[/C][/ROW]
[ROW][C]31[/C][C]-0.116259[/C][C]-0.8055[/C][C]0.212262[/C][/ROW]
[ROW][C]32[/C][C]-0.093532[/C][C]-0.648[/C][C]0.260033[/C][/ROW]
[ROW][C]33[/C][C]-0.065561[/C][C]-0.4542[/C][C]0.325859[/C][/ROW]
[ROW][C]34[/C][C]-0.035795[/C][C]-0.248[/C][C]0.402598[/C][/ROW]
[ROW][C]35[/C][C]-0.006594[/C][C]-0.0457[/C][C]0.481875[/C][/ROW]
[ROW][C]36[/C][C]0.012622[/C][C]0.0874[/C][C]0.46534[/C][/ROW]
[/TABLE]
Source: https://freestatistics.org/blog/index.php?pk=59825&T=1

Globally Unique Identifier (entire table): ba.freestatistics.org/blog/index.php?pk=59825&T=1

As an alternative you can also use a QR Code:  

The GUIDs for individual cells are displayed in the table below:

Autocorrelation Function
Time lag kACF(k)T-STATP-value
10.9384126.50150
20.8462055.86270
30.7182584.97624e-06
40.5742843.97880.000117
50.4227322.92880.002596
60.260611.80560.038631
70.1045780.72450.236126
8-0.036141-0.25040.401675
9-0.142987-0.99060.163414
10-0.241624-1.6740.050316
11-0.313841-2.17440.01732
12-0.365203-2.53020.007367
13-0.368495-2.5530.006957
14-0.346211-2.39860.010196
15-0.300322-2.08070.021411
16-0.2474-1.7140.046486
17-0.203074-1.40690.082944
18-0.163256-1.13110.131822
19-0.132572-0.91850.181479
20-0.116734-0.80880.211323
21-0.118518-0.82110.20782
22-0.125413-0.86890.194616
23-0.136779-0.94760.174031
24-0.142392-0.98650.164412
25-0.138315-0.95830.171363
26-0.139645-0.96750.169074
27-0.149128-1.03320.153346
28-0.148132-1.02630.154951
29-0.14722-1.020.156428
30-0.136414-0.94510.174669
31-0.116259-0.80550.212262
32-0.093532-0.6480.260033
33-0.065561-0.45420.325859
34-0.035795-0.2480.402598
35-0.006594-0.04570.481875
360.0126220.08740.46534


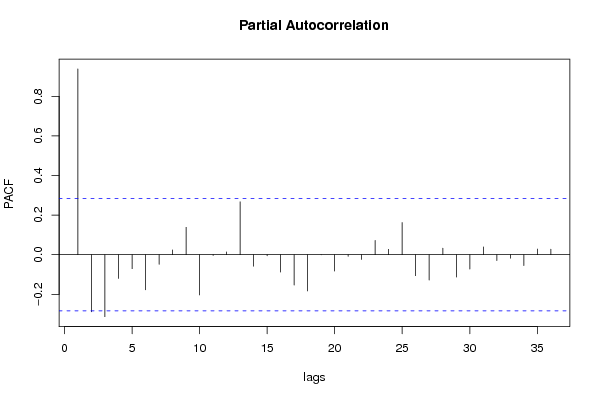
Partial Autocorrelation Function
Time lag kPACF(k)T-STATP-value
10.9384126.50150
2-0.288258-1.99710.02575
3-0.312696-2.16640.017637
4-0.119592-0.82860.205727
5-0.07051-0.48850.313708
6-0.177385-1.2290.112539
7-0.048053-0.33290.370321
80.0245660.17020.432784
90.1387290.96110.170649
10-0.202712-1.40440.083314
11-0.003498-0.02420.490382
120.0141680.09820.461108
130.2675961.8540.034948
14-0.057759-0.40020.345405
15-0.005305-0.03680.485417
16-0.087753-0.6080.273037
17-0.152963-1.05980.147279
18-0.182802-1.26650.105724
19-0.000254-0.00180.499302
20-0.08257-0.57210.284975
21-0.00766-0.05310.478949
22-0.023656-0.16390.435253
230.0722530.50060.309475
240.0275380.19080.424749
250.162321.12460.133178
26-0.105729-0.73250.233708
27-0.127904-0.88610.189979
280.033370.23120.409073
29-0.112691-0.78070.219392
30-0.072579-0.50280.308687
310.0393530.27260.393148
32-0.029651-0.20540.419052
33-0.017478-0.12110.452062
34-0.05455-0.37790.353572
350.028740.19910.421507
360.0277830.19250.424088

\begin{tabular}{lllllllll}
\hline
Partial Autocorrelation Function \tabularnewline
Time lag k & PACF(k) & T-STAT & P-value \tabularnewline
1 & 0.938412 & 6.5015 & 0 \tabularnewline
2 & -0.288258 & -1.9971 & 0.02575 \tabularnewline
3 & -0.312696 & -2.1664 & 0.017637 \tabularnewline
4 & -0.119592 & -0.8286 & 0.205727 \tabularnewline
5 & -0.07051 & -0.4885 & 0.313708 \tabularnewline
6 & -0.177385 & -1.229 & 0.112539 \tabularnewline
7 & -0.048053 & -0.3329 & 0.370321 \tabularnewline
8 & 0.024566 & 0.1702 & 0.432784 \tabularnewline
9 & 0.138729 & 0.9611 & 0.170649 \tabularnewline
10 & -0.202712 & -1.4044 & 0.083314 \tabularnewline
11 & -0.003498 & -0.0242 & 0.490382 \tabularnewline
12 & 0.014168 & 0.0982 & 0.461108 \tabularnewline
13 & 0.267596 & 1.854 & 0.034948 \tabularnewline
14 & -0.057759 & -0.4002 & 0.345405 \tabularnewline
15 & -0.005305 & -0.0368 & 0.485417 \tabularnewline
16 & -0.087753 & -0.608 & 0.273037 \tabularnewline
17 & -0.152963 & -1.0598 & 0.147279 \tabularnewline
18 & -0.182802 & -1.2665 & 0.105724 \tabularnewline
19 & -0.000254 & -0.0018 & 0.499302 \tabularnewline
20 & -0.08257 & -0.5721 & 0.284975 \tabularnewline
21 & -0.00766 & -0.0531 & 0.478949 \tabularnewline
22 & -0.023656 & -0.1639 & 0.435253 \tabularnewline
23 & 0.072253 & 0.5006 & 0.309475 \tabularnewline
24 & 0.027538 & 0.1908 & 0.424749 \tabularnewline
25 & 0.16232 & 1.1246 & 0.133178 \tabularnewline
26 & -0.105729 & -0.7325 & 0.233708 \tabularnewline
27 & -0.127904 & -0.8861 & 0.189979 \tabularnewline
28 & 0.03337 & 0.2312 & 0.409073 \tabularnewline
29 & -0.112691 & -0.7807 & 0.219392 \tabularnewline
30 & -0.072579 & -0.5028 & 0.308687 \tabularnewline
31 & 0.039353 & 0.2726 & 0.393148 \tabularnewline
32 & -0.029651 & -0.2054 & 0.419052 \tabularnewline
33 & -0.017478 & -0.1211 & 0.452062 \tabularnewline
34 & -0.05455 & -0.3779 & 0.353572 \tabularnewline
35 & 0.02874 & 0.1991 & 0.421507 \tabularnewline
36 & 0.027783 & 0.1925 & 0.424088 \tabularnewline
\hline
\end{tabular}
%Source: https://freestatistics.org/blog/index.php?pk=59825&T=2

[TABLE]
[ROW][C]Partial Autocorrelation Function[/C][/ROW]
[ROW][C]Time lag k[/C][C]PACF(k)[/C][C]T-STAT[/C][C]P-value[/C][/ROW]
[ROW][C]1[/C][C]0.938412[/C][C]6.5015[/C][C]0[/C][/ROW]
[ROW][C]2[/C][C]-0.288258[/C][C]-1.9971[/C][C]0.02575[/C][/ROW]
[ROW][C]3[/C][C]-0.312696[/C][C]-2.1664[/C][C]0.017637[/C][/ROW]
[ROW][C]4[/C][C]-0.119592[/C][C]-0.8286[/C][C]0.205727[/C][/ROW]
[ROW][C]5[/C][C]-0.07051[/C][C]-0.4885[/C][C]0.313708[/C][/ROW]
[ROW][C]6[/C][C]-0.177385[/C][C]-1.229[/C][C]0.112539[/C][/ROW]
[ROW][C]7[/C][C]-0.048053[/C][C]-0.3329[/C][C]0.370321[/C][/ROW]
[ROW][C]8[/C][C]0.024566[/C][C]0.1702[/C][C]0.432784[/C][/ROW]
[ROW][C]9[/C][C]0.138729[/C][C]0.9611[/C][C]0.170649[/C][/ROW]
[ROW][C]10[/C][C]-0.202712[/C][C]-1.4044[/C][C]0.083314[/C][/ROW]
[ROW][C]11[/C][C]-0.003498[/C][C]-0.0242[/C][C]0.490382[/C][/ROW]
[ROW][C]12[/C][C]0.014168[/C][C]0.0982[/C][C]0.461108[/C][/ROW]
[ROW][C]13[/C][C]0.267596[/C][C]1.854[/C][C]0.034948[/C][/ROW]
[ROW][C]14[/C][C]-0.057759[/C][C]-0.4002[/C][C]0.345405[/C][/ROW]
[ROW][C]15[/C][C]-0.005305[/C][C]-0.0368[/C][C]0.485417[/C][/ROW]
[ROW][C]16[/C][C]-0.087753[/C][C]-0.608[/C][C]0.273037[/C][/ROW]
[ROW][C]17[/C][C]-0.152963[/C][C]-1.0598[/C][C]0.147279[/C][/ROW]
[ROW][C]18[/C][C]-0.182802[/C][C]-1.2665[/C][C]0.105724[/C][/ROW]
[ROW][C]19[/C][C]-0.000254[/C][C]-0.0018[/C][C]0.499302[/C][/ROW]
[ROW][C]20[/C][C]-0.08257[/C][C]-0.5721[/C][C]0.284975[/C][/ROW]
[ROW][C]21[/C][C]-0.00766[/C][C]-0.0531[/C][C]0.478949[/C][/ROW]
[ROW][C]22[/C][C]-0.023656[/C][C]-0.1639[/C][C]0.435253[/C][/ROW]
[ROW][C]23[/C][C]0.072253[/C][C]0.5006[/C][C]0.309475[/C][/ROW]
[ROW][C]24[/C][C]0.027538[/C][C]0.1908[/C][C]0.424749[/C][/ROW]
[ROW][C]25[/C][C]0.16232[/C][C]1.1246[/C][C]0.133178[/C][/ROW]
[ROW][C]26[/C][C]-0.105729[/C][C]-0.7325[/C][C]0.233708[/C][/ROW]
[ROW][C]27[/C][C]-0.127904[/C][C]-0.8861[/C][C]0.189979[/C][/ROW]
[ROW][C]28[/C][C]0.03337[/C][C]0.2312[/C][C]0.409073[/C][/ROW]
[ROW][C]29[/C][C]-0.112691[/C][C]-0.7807[/C][C]0.219392[/C][/ROW]
[ROW][C]30[/C][C]-0.072579[/C][C]-0.5028[/C][C]0.308687[/C][/ROW]
[ROW][C]31[/C][C]0.039353[/C][C]0.2726[/C][C]0.393148[/C][/ROW]
[ROW][C]32[/C][C]-0.029651[/C][C]-0.2054[/C][C]0.419052[/C][/ROW]
[ROW][C]33[/C][C]-0.017478[/C][C]-0.1211[/C][C]0.452062[/C][/ROW]
[ROW][C]34[/C][C]-0.05455[/C][C]-0.3779[/C][C]0.353572[/C][/ROW]
[ROW][C]35[/C][C]0.02874[/C][C]0.1991[/C][C]0.421507[/C][/ROW]
[ROW][C]36[/C][C]0.027783[/C][C]0.1925[/C][C]0.424088[/C][/ROW]
[/TABLE]
Source: https://freestatistics.org/blog/index.php?pk=59825&T=2

Globally Unique Identifier (entire table): ba.freestatistics.org/blog/index.php?pk=59825&T=2

As an alternative you can also use a QR Code:  

The GUIDs for individual cells are displayed in the table below:

Partial Autocorrelation Function
Time lag kPACF(k)T-STATP-value
10.9384126.50150
2-0.288258-1.99710.02575
3-0.312696-2.16640.017637
4-0.119592-0.82860.205727
5-0.07051-0.48850.313708
6-0.177385-1.2290.112539
7-0.048053-0.33290.370321
80.0245660.17020.432784
90.1387290.96110.170649
10-0.202712-1.40440.083314
11-0.003498-0.02420.490382
120.0141680.09820.461108
130.2675961.8540.034948
14-0.057759-0.40020.345405
15-0.005305-0.03680.485417
16-0.087753-0.6080.273037
17-0.152963-1.05980.147279
18-0.182802-1.26650.105724
19-0.000254-0.00180.499302
20-0.08257-0.57210.284975
21-0.00766-0.05310.478949
22-0.023656-0.16390.435253
230.0722530.50060.309475
240.0275380.19080.424749
250.162321.12460.133178
26-0.105729-0.73250.233708
27-0.127904-0.88610.189979
280.033370.23120.409073
29-0.112691-0.78070.219392
30-0.072579-0.50280.308687
310.0393530.27260.393148
32-0.029651-0.20540.419052
33-0.017478-0.12110.452062
34-0.05455-0.37790.353572
350.028740.19910.421507
360.0277830.19250.424088


Parameters (Session):
par1 = 36 ; par2 = 1 ; par3 = 0 ; par4 = 1 ; par5 = 12 ; par6 = MA ; par7 = 0.95 ;
Parameters (R input):
par1 = 36 ; par2 = 1 ; par3 = 0 ; par4 = 1 ; par5 = 12 ; par6 = MA ; par7 = 0.95 ;
R code (references can be found in the software module):
if (par1 == 'Default') {
par1 = 10*log10(length(x))
} else {
par1 <- as.numeric(par1)
}
par2 <- as.numeric(par2)
par3 <- as.numeric(par3)
par4 <- as.numeric(par4)
par5 <- as.numeric(par5)
if (par6 == 'White Noise') par6 <- 'white' else par6 <- 'ma'
par7 <- as.numeric(par7)
if (par2 == 0) {
x <- log(x)
} else {
x <- (x ^ par2 - 1) / par2
}
if (par3 > 0) x <- diff(x,lag=1,difference=par3)
if (par4 > 0) x <- diff(x,lag=par5,difference=par4)
bitmap(file='pic1.png')
racf <- acf(x, par1, main='Autocorrelation', xlab='time lag', ylab='ACF', ci.type=par6, ci=par7, sub=paste('(lambda=',par2,', d=',par3,', D=',par4,', CI=', par7, ', CI type=',par6,')',sep=''))
dev.off()
bitmap(file='pic2.png')
rpacf <- pacf(x,par1,main='Partial Autocorrelation',xlab='lags',ylab='PACF')
dev.off()
(myacf <- c(racf$acf))
(mypacf <- c(rpacf$acf))
lengthx <- length(x)
sqrtn <- sqrt(lengthx)
load(file='createtable')
a<-table.start()
a<-table.row.start(a)
a<-table.element(a,'Autocorrelation Function',4,TRUE)
a<-table.row.end(a)
a<-table.row.start(a)
a<-table.element(a,'Time lag k',header=TRUE)
a<-table.element(a,hyperlink('basics.htm','ACF(k)','click here for more information about the Autocorrelation Function'),header=TRUE)
a<-table.element(a,'T-STAT',header=TRUE)
a<-table.element(a,'P-value',header=TRUE)
a<-table.row.end(a)
for (i in 2:(par1+1)) {
a<-table.row.start(a)
a<-table.element(a,i-1,header=TRUE)
a<-table.element(a,round(myacf[i],6))
mytstat <- myacf[i]*sqrtn
a<-table.element(a,round(mytstat,4))
a<-table.element(a,round(1-pt(abs(mytstat),lengthx),6))
a<-table.row.end(a)
}
a<-table.end(a)
table.save(a,file='mytable.tab')
a<-table.start()
a<-table.row.start(a)
a<-table.element(a,'Partial Autocorrelation Function',4,TRUE)
a<-table.row.end(a)
a<-table.row.start(a)
a<-table.element(a,'Time lag k',header=TRUE)
a<-table.element(a,hyperlink('basics.htm','PACF(k)','click here for more information about the Partial Autocorrelation Function'),header=TRUE)
a<-table.element(a,'T-STAT',header=TRUE)
a<-table.element(a,'P-value',header=TRUE)
a<-table.row.end(a)
for (i in 1:par1) {
a<-table.row.start(a)
a<-table.element(a,i,header=TRUE)
a<-table.element(a,round(mypacf[i],6))
mytstat <- mypacf[i]*sqrtn
a<-table.element(a,round(mytstat,4))
a<-table.element(a,round(1-pt(abs(mytstat),lengthx),6))
a<-table.row.end(a)
}
a<-table.end(a)
table.save(a,file='mytable1.tab')