Free Statistics

of Irreproducible Research!

Author's title

Author*The author of this computation has been verified*
R Software Modulerwasp_autocorrelation.wasp
Title produced by software(Partial) Autocorrelation Function
Date of computationThu, 26 Nov 2009 04:07:37 -0700
Cite this page as followsStatistical Computations at FreeStatistics.org, Office for Research Development and Education, URL https://freestatistics.org/blog/index.php?v=date/2009/Nov/26/t1259233737f6ksu9de6mmz14u.htm/, Retrieved Sun, 28 Apr 2024 19:57:41 +0000
Statistical Computations at FreeStatistics.org, Office for Research Development and Education, URL https://freestatistics.org/blog/index.php?pk=59826, Retrieved Sun, 28 Apr 2024 19:57:41 +0000
QR Codes:

Original text written by user:
IsPrivate?No (this computation is public)
User-defined keywords
Estimated Impact143
Family? (F = Feedback message, R = changed R code, M = changed R Module, P = changed Parameters, D = changed Data)
-     [Univariate Explorative Data Analysis] [Run Sequence gebo...] [2008-12-12 13:32:37] [76963dc1903f0f612b6153510a3818cf]
- R  D  [Univariate Explorative Data Analysis] [Run Sequence gebo...] [2008-12-17 12:14:40] [76963dc1903f0f612b6153510a3818cf]
-         [Univariate Explorative Data Analysis] [Run Sequence Plot...] [2008-12-22 18:19:51] [1ce0d16c8f4225c977b42c8fa93bc163]
- RMP       [(Partial) Autocorrelation Function] [Identifying Integ...] [2009-11-22 12:26:39] [b98453cac15ba1066b407e146608df68]
-    D          [(Partial) Autocorrelation Function] [workshop 3] [2009-11-26 11:07:37] [0852d9c28828e87a0aee4d255e088d63] [Current]
Feedback Forum

Post a new message
Dataseries X:
108.2
108.8
110.2
109.5
109.5
116
111.2
112.1
114
119.1
114.1
115.1
115.4
110.8
116
119.2
126.5
127.8
131.3
140.3
137.3
143
134.5
139.9
159.3
170.4
175
175.8
180.9
180.3
169.6
172.3
184.8
177.7
184.6
211.4
215.3
215.9
244.7
259.3
289
310.9
321
315.1
333.2
314.1
284.7
273.9
216
196.4
190.9
206.4
196.3
199.5
198.9
214.4
214.2
187.6
180.6
172.2


Summary of computational transaction
Raw Inputview raw input (R code)
Raw Outputview raw output of R engine
Computing time2 seconds
R Server'Gwilym Jenkins' @ 72.249.127.135

\begin{tabular}{lllllllll}
\hline
Summary of computational transaction \tabularnewline
Raw Input & view raw input (R code)  \tabularnewline
Raw Output & view raw output of R engine  \tabularnewline
Computing time & 2 seconds \tabularnewline
R Server & 'Gwilym Jenkins' @ 72.249.127.135 \tabularnewline
\hline
\end{tabular}
%Source: https://freestatistics.org/blog/index.php?pk=59826&T=0

[TABLE]
[ROW][C]Summary of computational transaction[/C][/ROW]
[ROW][C]Raw Input[/C][C]view raw input (R code) [/C][/ROW]
[ROW][C]Raw Output[/C][C]view raw output of R engine [/C][/ROW]
[ROW][C]Computing time[/C][C]2 seconds[/C][/ROW]
[ROW][C]R Server[/C][C]'Gwilym Jenkins' @ 72.249.127.135[/C][/ROW]
[/TABLE]
Source: https://freestatistics.org/blog/index.php?pk=59826&T=0

Globally Unique Identifier (entire table): ba.freestatistics.org/blog/index.php?pk=59826&T=0

As an alternative you can also use a QR Code:  

The GUIDs for individual cells are displayed in the table below:

Summary of computational transaction
Raw Inputview raw input (R code)
Raw Outputview raw output of R engine
Computing time2 seconds
R Server'Gwilym Jenkins' @ 72.249.127.135


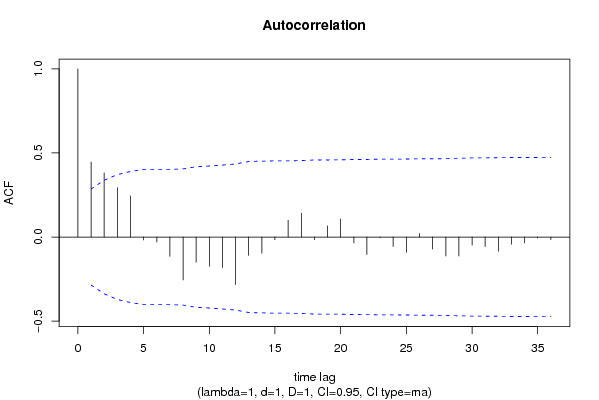
Autocorrelation Function
Time lag kACF(k)T-STATP-value
10.4459733.05740.001838
20.381392.61470.005982
30.2933392.0110.025039
40.2445951.67690.050105
5-0.017565-0.12040.452331
6-0.029679-0.20350.419824
7-0.114652-0.7860.217903
8-0.255645-1.75260.043095
9-0.149663-1.0260.155063
10-0.173318-1.18820.12036
11-0.181871-1.24680.109316
12-0.283159-1.94120.029119
13-0.108582-0.74440.230169
14-0.096255-0.65990.256272
15-0.015627-0.10710.457571
160.0992940.68070.249693
170.1420640.97390.167536
18-0.015974-0.10950.456631
190.0657680.45090.327073
200.1066840.73140.234087
21-0.035089-0.24060.405472
22-0.104464-0.71620.238715
23-0.003834-0.02630.489571
24-0.05637-0.38650.350452
25-0.090697-0.62180.268542
260.0213050.14610.442248
27-0.072035-0.49380.311857
28-0.112917-0.77410.221368
29-0.112356-0.77030.222497
30-0.047548-0.3260.372945
31-0.056306-0.3860.350614
32-0.084912-0.58210.281632
33-0.04235-0.29030.386419
34-0.034511-0.23660.407
35-0.005678-0.03890.484556
36-0.015189-0.10410.458754

\begin{tabular}{lllllllll}
\hline
Autocorrelation Function \tabularnewline
Time lag k & ACF(k) & T-STAT & P-value \tabularnewline
1 & 0.445973 & 3.0574 & 0.001838 \tabularnewline
2 & 0.38139 & 2.6147 & 0.005982 \tabularnewline
3 & 0.293339 & 2.011 & 0.025039 \tabularnewline
4 & 0.244595 & 1.6769 & 0.050105 \tabularnewline
5 & -0.017565 & -0.1204 & 0.452331 \tabularnewline
6 & -0.029679 & -0.2035 & 0.419824 \tabularnewline
7 & -0.114652 & -0.786 & 0.217903 \tabularnewline
8 & -0.255645 & -1.7526 & 0.043095 \tabularnewline
9 & -0.149663 & -1.026 & 0.155063 \tabularnewline
10 & -0.173318 & -1.1882 & 0.12036 \tabularnewline
11 & -0.181871 & -1.2468 & 0.109316 \tabularnewline
12 & -0.283159 & -1.9412 & 0.029119 \tabularnewline
13 & -0.108582 & -0.7444 & 0.230169 \tabularnewline
14 & -0.096255 & -0.6599 & 0.256272 \tabularnewline
15 & -0.015627 & -0.1071 & 0.457571 \tabularnewline
16 & 0.099294 & 0.6807 & 0.249693 \tabularnewline
17 & 0.142064 & 0.9739 & 0.167536 \tabularnewline
18 & -0.015974 & -0.1095 & 0.456631 \tabularnewline
19 & 0.065768 & 0.4509 & 0.327073 \tabularnewline
20 & 0.106684 & 0.7314 & 0.234087 \tabularnewline
21 & -0.035089 & -0.2406 & 0.405472 \tabularnewline
22 & -0.104464 & -0.7162 & 0.238715 \tabularnewline
23 & -0.003834 & -0.0263 & 0.489571 \tabularnewline
24 & -0.05637 & -0.3865 & 0.350452 \tabularnewline
25 & -0.090697 & -0.6218 & 0.268542 \tabularnewline
26 & 0.021305 & 0.1461 & 0.442248 \tabularnewline
27 & -0.072035 & -0.4938 & 0.311857 \tabularnewline
28 & -0.112917 & -0.7741 & 0.221368 \tabularnewline
29 & -0.112356 & -0.7703 & 0.222497 \tabularnewline
30 & -0.047548 & -0.326 & 0.372945 \tabularnewline
31 & -0.056306 & -0.386 & 0.350614 \tabularnewline
32 & -0.084912 & -0.5821 & 0.281632 \tabularnewline
33 & -0.04235 & -0.2903 & 0.386419 \tabularnewline
34 & -0.034511 & -0.2366 & 0.407 \tabularnewline
35 & -0.005678 & -0.0389 & 0.484556 \tabularnewline
36 & -0.015189 & -0.1041 & 0.458754 \tabularnewline
\hline
\end{tabular}
%Source: https://freestatistics.org/blog/index.php?pk=59826&T=1

[TABLE]
[ROW][C]Autocorrelation Function[/C][/ROW]
[ROW][C]Time lag k[/C][C]ACF(k)[/C][C]T-STAT[/C][C]P-value[/C][/ROW]
[ROW][C]1[/C][C]0.445973[/C][C]3.0574[/C][C]0.001838[/C][/ROW]
[ROW][C]2[/C][C]0.38139[/C][C]2.6147[/C][C]0.005982[/C][/ROW]
[ROW][C]3[/C][C]0.293339[/C][C]2.011[/C][C]0.025039[/C][/ROW]
[ROW][C]4[/C][C]0.244595[/C][C]1.6769[/C][C]0.050105[/C][/ROW]
[ROW][C]5[/C][C]-0.017565[/C][C]-0.1204[/C][C]0.452331[/C][/ROW]
[ROW][C]6[/C][C]-0.029679[/C][C]-0.2035[/C][C]0.419824[/C][/ROW]
[ROW][C]7[/C][C]-0.114652[/C][C]-0.786[/C][C]0.217903[/C][/ROW]
[ROW][C]8[/C][C]-0.255645[/C][C]-1.7526[/C][C]0.043095[/C][/ROW]
[ROW][C]9[/C][C]-0.149663[/C][C]-1.026[/C][C]0.155063[/C][/ROW]
[ROW][C]10[/C][C]-0.173318[/C][C]-1.1882[/C][C]0.12036[/C][/ROW]
[ROW][C]11[/C][C]-0.181871[/C][C]-1.2468[/C][C]0.109316[/C][/ROW]
[ROW][C]12[/C][C]-0.283159[/C][C]-1.9412[/C][C]0.029119[/C][/ROW]
[ROW][C]13[/C][C]-0.108582[/C][C]-0.7444[/C][C]0.230169[/C][/ROW]
[ROW][C]14[/C][C]-0.096255[/C][C]-0.6599[/C][C]0.256272[/C][/ROW]
[ROW][C]15[/C][C]-0.015627[/C][C]-0.1071[/C][C]0.457571[/C][/ROW]
[ROW][C]16[/C][C]0.099294[/C][C]0.6807[/C][C]0.249693[/C][/ROW]
[ROW][C]17[/C][C]0.142064[/C][C]0.9739[/C][C]0.167536[/C][/ROW]
[ROW][C]18[/C][C]-0.015974[/C][C]-0.1095[/C][C]0.456631[/C][/ROW]
[ROW][C]19[/C][C]0.065768[/C][C]0.4509[/C][C]0.327073[/C][/ROW]
[ROW][C]20[/C][C]0.106684[/C][C]0.7314[/C][C]0.234087[/C][/ROW]
[ROW][C]21[/C][C]-0.035089[/C][C]-0.2406[/C][C]0.405472[/C][/ROW]
[ROW][C]22[/C][C]-0.104464[/C][C]-0.7162[/C][C]0.238715[/C][/ROW]
[ROW][C]23[/C][C]-0.003834[/C][C]-0.0263[/C][C]0.489571[/C][/ROW]
[ROW][C]24[/C][C]-0.05637[/C][C]-0.3865[/C][C]0.350452[/C][/ROW]
[ROW][C]25[/C][C]-0.090697[/C][C]-0.6218[/C][C]0.268542[/C][/ROW]
[ROW][C]26[/C][C]0.021305[/C][C]0.1461[/C][C]0.442248[/C][/ROW]
[ROW][C]27[/C][C]-0.072035[/C][C]-0.4938[/C][C]0.311857[/C][/ROW]
[ROW][C]28[/C][C]-0.112917[/C][C]-0.7741[/C][C]0.221368[/C][/ROW]
[ROW][C]29[/C][C]-0.112356[/C][C]-0.7703[/C][C]0.222497[/C][/ROW]
[ROW][C]30[/C][C]-0.047548[/C][C]-0.326[/C][C]0.372945[/C][/ROW]
[ROW][C]31[/C][C]-0.056306[/C][C]-0.386[/C][C]0.350614[/C][/ROW]
[ROW][C]32[/C][C]-0.084912[/C][C]-0.5821[/C][C]0.281632[/C][/ROW]
[ROW][C]33[/C][C]-0.04235[/C][C]-0.2903[/C][C]0.386419[/C][/ROW]
[ROW][C]34[/C][C]-0.034511[/C][C]-0.2366[/C][C]0.407[/C][/ROW]
[ROW][C]35[/C][C]-0.005678[/C][C]-0.0389[/C][C]0.484556[/C][/ROW]
[ROW][C]36[/C][C]-0.015189[/C][C]-0.1041[/C][C]0.458754[/C][/ROW]
[/TABLE]
Source: https://freestatistics.org/blog/index.php?pk=59826&T=1

Globally Unique Identifier (entire table): ba.freestatistics.org/blog/index.php?pk=59826&T=1

As an alternative you can also use a QR Code:  

The GUIDs for individual cells are displayed in the table below:

Autocorrelation Function
Time lag kACF(k)T-STATP-value
10.4459733.05740.001838
20.381392.61470.005982
30.2933392.0110.025039
40.2445951.67690.050105
5-0.017565-0.12040.452331
6-0.029679-0.20350.419824
7-0.114652-0.7860.217903
8-0.255645-1.75260.043095
9-0.149663-1.0260.155063
10-0.173318-1.18820.12036
11-0.181871-1.24680.109316
12-0.283159-1.94120.029119
13-0.108582-0.74440.230169
14-0.096255-0.65990.256272
15-0.015627-0.10710.457571
160.0992940.68070.249693
170.1420640.97390.167536
18-0.015974-0.10950.456631
190.0657680.45090.327073
200.1066840.73140.234087
21-0.035089-0.24060.405472
22-0.104464-0.71620.238715
23-0.003834-0.02630.489571
24-0.05637-0.38650.350452
25-0.090697-0.62180.268542
260.0213050.14610.442248
27-0.072035-0.49380.311857
28-0.112917-0.77410.221368
29-0.112356-0.77030.222497
30-0.047548-0.3260.372945
31-0.056306-0.3860.350614
32-0.084912-0.58210.281632
33-0.04235-0.29030.386419
34-0.034511-0.23660.407
35-0.005678-0.03890.484556
36-0.015189-0.10410.458754


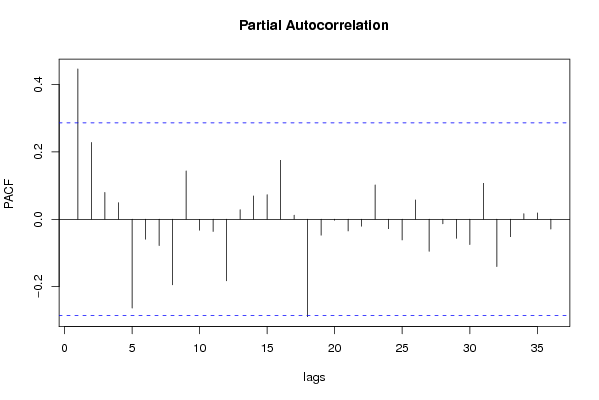
Partial Autocorrelation Function
Time lag kPACF(k)T-STATP-value
10.4459733.05740.001838
20.2278071.56180.062526
30.0795250.54520.2941
40.0490060.3360.369196
5-0.263523-1.80660.038613
6-0.059148-0.40550.343477
7-0.077954-0.53440.297783
8-0.194629-1.33430.094266
90.1435090.98380.165114
10-0.032415-0.22220.412551
11-0.036085-0.24740.402844
12-0.182812-1.25330.108148
130.0283460.19430.423377
140.0689740.47290.31925
150.0728810.49960.309827
160.1749261.19920.118225
170.01190.08160.467662
18-0.289007-1.98130.02671
19-0.047449-0.32530.3732
20-0.002671-0.01830.492734
21-0.034604-0.23720.406754
22-0.02059-0.14120.444173
230.1017110.69730.244527
24-0.027907-0.19130.42455
25-0.061279-0.42010.338162
260.0573370.39310.348017
27-0.095034-0.65150.258942
28-0.013466-0.09230.463418
29-0.05663-0.38820.349797
30-0.075208-0.51560.304275
310.1066680.73130.23412
32-0.140533-0.96340.170127
33-0.051578-0.35360.362611
340.0165510.11350.455072
350.0185840.12740.449583
36-0.02905-0.19920.421501

\begin{tabular}{lllllllll}
\hline
Partial Autocorrelation Function \tabularnewline
Time lag k & PACF(k) & T-STAT & P-value \tabularnewline
1 & 0.445973 & 3.0574 & 0.001838 \tabularnewline
2 & 0.227807 & 1.5618 & 0.062526 \tabularnewline
3 & 0.079525 & 0.5452 & 0.2941 \tabularnewline
4 & 0.049006 & 0.336 & 0.369196 \tabularnewline
5 & -0.263523 & -1.8066 & 0.038613 \tabularnewline
6 & -0.059148 & -0.4055 & 0.343477 \tabularnewline
7 & -0.077954 & -0.5344 & 0.297783 \tabularnewline
8 & -0.194629 & -1.3343 & 0.094266 \tabularnewline
9 & 0.143509 & 0.9838 & 0.165114 \tabularnewline
10 & -0.032415 & -0.2222 & 0.412551 \tabularnewline
11 & -0.036085 & -0.2474 & 0.402844 \tabularnewline
12 & -0.182812 & -1.2533 & 0.108148 \tabularnewline
13 & 0.028346 & 0.1943 & 0.423377 \tabularnewline
14 & 0.068974 & 0.4729 & 0.31925 \tabularnewline
15 & 0.072881 & 0.4996 & 0.309827 \tabularnewline
16 & 0.174926 & 1.1992 & 0.118225 \tabularnewline
17 & 0.0119 & 0.0816 & 0.467662 \tabularnewline
18 & -0.289007 & -1.9813 & 0.02671 \tabularnewline
19 & -0.047449 & -0.3253 & 0.3732 \tabularnewline
20 & -0.002671 & -0.0183 & 0.492734 \tabularnewline
21 & -0.034604 & -0.2372 & 0.406754 \tabularnewline
22 & -0.02059 & -0.1412 & 0.444173 \tabularnewline
23 & 0.101711 & 0.6973 & 0.244527 \tabularnewline
24 & -0.027907 & -0.1913 & 0.42455 \tabularnewline
25 & -0.061279 & -0.4201 & 0.338162 \tabularnewline
26 & 0.057337 & 0.3931 & 0.348017 \tabularnewline
27 & -0.095034 & -0.6515 & 0.258942 \tabularnewline
28 & -0.013466 & -0.0923 & 0.463418 \tabularnewline
29 & -0.05663 & -0.3882 & 0.349797 \tabularnewline
30 & -0.075208 & -0.5156 & 0.304275 \tabularnewline
31 & 0.106668 & 0.7313 & 0.23412 \tabularnewline
32 & -0.140533 & -0.9634 & 0.170127 \tabularnewline
33 & -0.051578 & -0.3536 & 0.362611 \tabularnewline
34 & 0.016551 & 0.1135 & 0.455072 \tabularnewline
35 & 0.018584 & 0.1274 & 0.449583 \tabularnewline
36 & -0.02905 & -0.1992 & 0.421501 \tabularnewline
\hline
\end{tabular}
%Source: https://freestatistics.org/blog/index.php?pk=59826&T=2

[TABLE]
[ROW][C]Partial Autocorrelation Function[/C][/ROW]
[ROW][C]Time lag k[/C][C]PACF(k)[/C][C]T-STAT[/C][C]P-value[/C][/ROW]
[ROW][C]1[/C][C]0.445973[/C][C]3.0574[/C][C]0.001838[/C][/ROW]
[ROW][C]2[/C][C]0.227807[/C][C]1.5618[/C][C]0.062526[/C][/ROW]
[ROW][C]3[/C][C]0.079525[/C][C]0.5452[/C][C]0.2941[/C][/ROW]
[ROW][C]4[/C][C]0.049006[/C][C]0.336[/C][C]0.369196[/C][/ROW]
[ROW][C]5[/C][C]-0.263523[/C][C]-1.8066[/C][C]0.038613[/C][/ROW]
[ROW][C]6[/C][C]-0.059148[/C][C]-0.4055[/C][C]0.343477[/C][/ROW]
[ROW][C]7[/C][C]-0.077954[/C][C]-0.5344[/C][C]0.297783[/C][/ROW]
[ROW][C]8[/C][C]-0.194629[/C][C]-1.3343[/C][C]0.094266[/C][/ROW]
[ROW][C]9[/C][C]0.143509[/C][C]0.9838[/C][C]0.165114[/C][/ROW]
[ROW][C]10[/C][C]-0.032415[/C][C]-0.2222[/C][C]0.412551[/C][/ROW]
[ROW][C]11[/C][C]-0.036085[/C][C]-0.2474[/C][C]0.402844[/C][/ROW]
[ROW][C]12[/C][C]-0.182812[/C][C]-1.2533[/C][C]0.108148[/C][/ROW]
[ROW][C]13[/C][C]0.028346[/C][C]0.1943[/C][C]0.423377[/C][/ROW]
[ROW][C]14[/C][C]0.068974[/C][C]0.4729[/C][C]0.31925[/C][/ROW]
[ROW][C]15[/C][C]0.072881[/C][C]0.4996[/C][C]0.309827[/C][/ROW]
[ROW][C]16[/C][C]0.174926[/C][C]1.1992[/C][C]0.118225[/C][/ROW]
[ROW][C]17[/C][C]0.0119[/C][C]0.0816[/C][C]0.467662[/C][/ROW]
[ROW][C]18[/C][C]-0.289007[/C][C]-1.9813[/C][C]0.02671[/C][/ROW]
[ROW][C]19[/C][C]-0.047449[/C][C]-0.3253[/C][C]0.3732[/C][/ROW]
[ROW][C]20[/C][C]-0.002671[/C][C]-0.0183[/C][C]0.492734[/C][/ROW]
[ROW][C]21[/C][C]-0.034604[/C][C]-0.2372[/C][C]0.406754[/C][/ROW]
[ROW][C]22[/C][C]-0.02059[/C][C]-0.1412[/C][C]0.444173[/C][/ROW]
[ROW][C]23[/C][C]0.101711[/C][C]0.6973[/C][C]0.244527[/C][/ROW]
[ROW][C]24[/C][C]-0.027907[/C][C]-0.1913[/C][C]0.42455[/C][/ROW]
[ROW][C]25[/C][C]-0.061279[/C][C]-0.4201[/C][C]0.338162[/C][/ROW]
[ROW][C]26[/C][C]0.057337[/C][C]0.3931[/C][C]0.348017[/C][/ROW]
[ROW][C]27[/C][C]-0.095034[/C][C]-0.6515[/C][C]0.258942[/C][/ROW]
[ROW][C]28[/C][C]-0.013466[/C][C]-0.0923[/C][C]0.463418[/C][/ROW]
[ROW][C]29[/C][C]-0.05663[/C][C]-0.3882[/C][C]0.349797[/C][/ROW]
[ROW][C]30[/C][C]-0.075208[/C][C]-0.5156[/C][C]0.304275[/C][/ROW]
[ROW][C]31[/C][C]0.106668[/C][C]0.7313[/C][C]0.23412[/C][/ROW]
[ROW][C]32[/C][C]-0.140533[/C][C]-0.9634[/C][C]0.170127[/C][/ROW]
[ROW][C]33[/C][C]-0.051578[/C][C]-0.3536[/C][C]0.362611[/C][/ROW]
[ROW][C]34[/C][C]0.016551[/C][C]0.1135[/C][C]0.455072[/C][/ROW]
[ROW][C]35[/C][C]0.018584[/C][C]0.1274[/C][C]0.449583[/C][/ROW]
[ROW][C]36[/C][C]-0.02905[/C][C]-0.1992[/C][C]0.421501[/C][/ROW]
[/TABLE]
Source: https://freestatistics.org/blog/index.php?pk=59826&T=2

Globally Unique Identifier (entire table): ba.freestatistics.org/blog/index.php?pk=59826&T=2

As an alternative you can also use a QR Code:  

The GUIDs for individual cells are displayed in the table below:

Partial Autocorrelation Function
Time lag kPACF(k)T-STATP-value
10.4459733.05740.001838
20.2278071.56180.062526
30.0795250.54520.2941
40.0490060.3360.369196
5-0.263523-1.80660.038613
6-0.059148-0.40550.343477
7-0.077954-0.53440.297783
8-0.194629-1.33430.094266
90.1435090.98380.165114
10-0.032415-0.22220.412551
11-0.036085-0.24740.402844
12-0.182812-1.25330.108148
130.0283460.19430.423377
140.0689740.47290.31925
150.0728810.49960.309827
160.1749261.19920.118225
170.01190.08160.467662
18-0.289007-1.98130.02671
19-0.047449-0.32530.3732
20-0.002671-0.01830.492734
21-0.034604-0.23720.406754
22-0.02059-0.14120.444173
230.1017110.69730.244527
24-0.027907-0.19130.42455
25-0.061279-0.42010.338162
260.0573370.39310.348017
27-0.095034-0.65150.258942
28-0.013466-0.09230.463418
29-0.05663-0.38820.349797
30-0.075208-0.51560.304275
310.1066680.73130.23412
32-0.140533-0.96340.170127
33-0.051578-0.35360.362611
340.0165510.11350.455072
350.0185840.12740.449583
36-0.02905-0.19920.421501


Parameters (Session):
par1 = 36 ; par2 = 1 ; par3 = 1 ; par4 = 1 ; par5 = 12 ; par6 = MA ; par7 = 0.95 ;
Parameters (R input):
par1 = 36 ; par2 = 1 ; par3 = 1 ; par4 = 1 ; par5 = 12 ; par6 = MA ; par7 = 0.95 ;
R code (references can be found in the software module):
if (par1 == 'Default') {
par1 = 10*log10(length(x))
} else {
par1 <- as.numeric(par1)
}
par2 <- as.numeric(par2)
par3 <- as.numeric(par3)
par4 <- as.numeric(par4)
par5 <- as.numeric(par5)
if (par6 == 'White Noise') par6 <- 'white' else par6 <- 'ma'
par7 <- as.numeric(par7)
if (par2 == 0) {
x <- log(x)
} else {
x <- (x ^ par2 - 1) / par2
}
if (par3 > 0) x <- diff(x,lag=1,difference=par3)
if (par4 > 0) x <- diff(x,lag=par5,difference=par4)
bitmap(file='pic1.png')
racf <- acf(x, par1, main='Autocorrelation', xlab='time lag', ylab='ACF', ci.type=par6, ci=par7, sub=paste('(lambda=',par2,', d=',par3,', D=',par4,', CI=', par7, ', CI type=',par6,')',sep=''))
dev.off()
bitmap(file='pic2.png')
rpacf <- pacf(x,par1,main='Partial Autocorrelation',xlab='lags',ylab='PACF')
dev.off()
(myacf <- c(racf$acf))
(mypacf <- c(rpacf$acf))
lengthx <- length(x)
sqrtn <- sqrt(lengthx)
load(file='createtable')
a<-table.start()
a<-table.row.start(a)
a<-table.element(a,'Autocorrelation Function',4,TRUE)
a<-table.row.end(a)
a<-table.row.start(a)
a<-table.element(a,'Time lag k',header=TRUE)
a<-table.element(a,hyperlink('basics.htm','ACF(k)','click here for more information about the Autocorrelation Function'),header=TRUE)
a<-table.element(a,'T-STAT',header=TRUE)
a<-table.element(a,'P-value',header=TRUE)
a<-table.row.end(a)
for (i in 2:(par1+1)) {
a<-table.row.start(a)
a<-table.element(a,i-1,header=TRUE)
a<-table.element(a,round(myacf[i],6))
mytstat <- myacf[i]*sqrtn
a<-table.element(a,round(mytstat,4))
a<-table.element(a,round(1-pt(abs(mytstat),lengthx),6))
a<-table.row.end(a)
}
a<-table.end(a)
table.save(a,file='mytable.tab')
a<-table.start()
a<-table.row.start(a)
a<-table.element(a,'Partial Autocorrelation Function',4,TRUE)
a<-table.row.end(a)
a<-table.row.start(a)
a<-table.element(a,'Time lag k',header=TRUE)
a<-table.element(a,hyperlink('basics.htm','PACF(k)','click here for more information about the Partial Autocorrelation Function'),header=TRUE)
a<-table.element(a,'T-STAT',header=TRUE)
a<-table.element(a,'P-value',header=TRUE)
a<-table.row.end(a)
for (i in 1:par1) {
a<-table.row.start(a)
a<-table.element(a,i,header=TRUE)
a<-table.element(a,round(mypacf[i],6))
mytstat <- mypacf[i]*sqrtn
a<-table.element(a,round(mytstat,4))
a<-table.element(a,round(1-pt(abs(mytstat),lengthx),6))
a<-table.row.end(a)
}
a<-table.end(a)
table.save(a,file='mytable1.tab')