Free Statistics

of Irreproducible Research!

Author's title

Author*The author of this computation has been verified*
R Software Modulerwasp_autocorrelation.wasp
Title produced by software(Partial) Autocorrelation Function
Date of computationThu, 26 Nov 2009 08:05:01 -0700
Cite this page as followsStatistical Computations at FreeStatistics.org, Office for Research Development and Education, URL https://freestatistics.org/blog/index.php?v=date/2009/Nov/26/t1259248500s4tzqr31bpvr3fk.htm/, Retrieved Mon, 29 Apr 2024 05:56:30 +0000
Statistical Computations at FreeStatistics.org, Office for Research Development and Education, URL https://freestatistics.org/blog/index.php?pk=60075, Retrieved Mon, 29 Apr 2024 05:56:30 +0000
QR Codes:

Original text written by user:
IsPrivate?No (this computation is public)
User-defined keywords
Estimated Impact120
Family? (F = Feedback message, R = changed R code, M = changed R Module, P = changed Parameters, D = changed Data)
-     [Univariate Explorative Data Analysis] [Run Sequence gebo...] [2008-12-12 13:32:37] [76963dc1903f0f612b6153510a3818cf]
- R  D  [Univariate Explorative Data Analysis] [Run Sequence gebo...] [2008-12-17 12:14:40] [76963dc1903f0f612b6153510a3818cf]
-         [Univariate Explorative Data Analysis] [Run Sequence Plot...] [2008-12-22 18:19:51] [1ce0d16c8f4225c977b42c8fa93bc163]
- RMP       [(Partial) Autocorrelation Function] [Identifying Integ...] [2009-11-22 12:19:56] [b98453cac15ba1066b407e146608df68]
F    D          [(Partial) Autocorrelation Function] [Method 1] [2009-11-26 15:05:01] [cf272a759dc2b193d9a85354803ede7b] [Current]
Feedback Forum
2009-12-01 15:32:36 [a188887590c4678b1377f46ca2c7883d] [reply
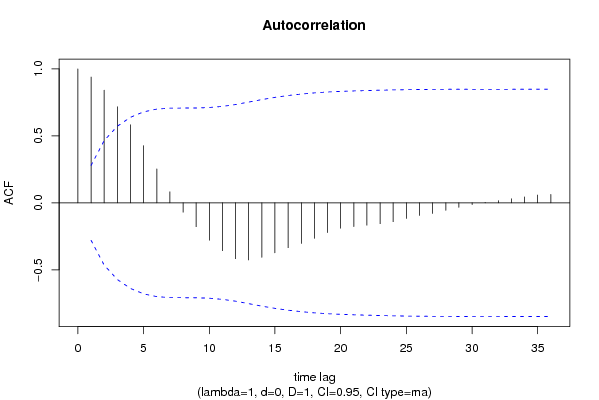
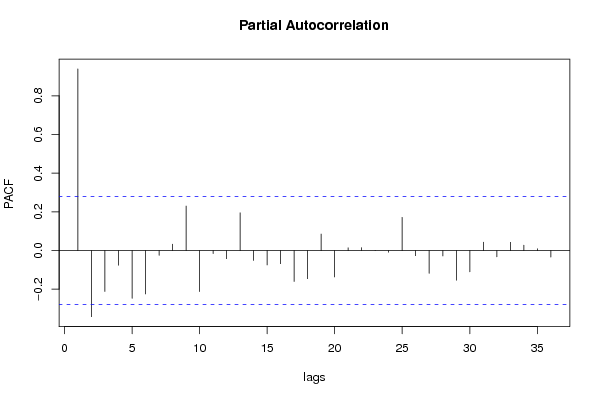
Nadat je dan D=1 hebt gedaan, wat seizonale trend moet verwijderen, zeg je dat deze er plots wel is. Deze valt ook helemaal niet te zien op ACF. Het verwijderen van LT-trend is voldoende.

Post a new message
Dataseries X:
108.5
112.3
116.6
115.5
120.1
132.9
128.1
129.3
132.5
131
124.9
120.8
122
122.1
127.4
135.2
137.3
135
136
138.4
134.7
138.4
133.9
133.6
141.2
151.8
155.4
156.6
161.6
160.7
156
159.5
168.7
169.9
169.9
185.9
190.8
195.8
211.9
227.1
251.3
256.7
251.9
251.2
270.3
267.2
243
229.9
187.2
178.2
175.2
192.4
187
184
194.1
212.7
217.5
200.5
205.9
196.5
206.3


Summary of computational transaction
Raw Inputview raw input (R code)
Raw Outputview raw output of R engine
Computing time1 seconds
R Server'Gwilym Jenkins' @ 72.249.127.135

\begin{tabular}{lllllllll}
\hline
Summary of computational transaction \tabularnewline
Raw Input & view raw input (R code)  \tabularnewline
Raw Output & view raw output of R engine  \tabularnewline
Computing time & 1 seconds \tabularnewline
R Server & 'Gwilym Jenkins' @ 72.249.127.135 \tabularnewline
\hline
\end{tabular}
%Source: https://freestatistics.org/blog/index.php?pk=60075&T=0

[TABLE]
[ROW][C]Summary of computational transaction[/C][/ROW]
[ROW][C]Raw Input[/C][C]view raw input (R code) [/C][/ROW]
[ROW][C]Raw Output[/C][C]view raw output of R engine [/C][/ROW]
[ROW][C]Computing time[/C][C]1 seconds[/C][/ROW]
[ROW][C]R Server[/C][C]'Gwilym Jenkins' @ 72.249.127.135[/C][/ROW]
[/TABLE]
Source: https://freestatistics.org/blog/index.php?pk=60075&T=0

Globally Unique Identifier (entire table): ba.freestatistics.org/blog/index.php?pk=60075&T=0

As an alternative you can also use a QR Code:  

The GUIDs for individual cells are displayed in the table below:

Summary of computational transaction
Raw Inputview raw input (R code)
Raw Outputview raw output of R engine
Computing time1 seconds
R Server'Gwilym Jenkins' @ 72.249.127.135


Autocorrelation Function
Time lag kACF(k)T-STATP-value
10.9391676.57420
20.841695.89180
30.7175935.02324e-06
40.582834.07988.3e-05
50.4269412.98860.002186
60.2530361.77130.041369
70.0821930.57530.283844
8-0.069728-0.48810.313829
9-0.178327-1.24830.108928
10-0.278444-1.94910.028509
11-0.35726-2.50080.007892
12-0.416491-2.91540.002671
13-0.425964-2.98170.002227
14-0.406504-2.84550.003228
15-0.3729-2.61030.005984
16-0.335079-2.34560.011546
17-0.302759-2.11930.019578
18-0.265033-1.85520.034792
19-0.22154-1.55080.063695
20-0.189317-1.32520.095622
21-0.176743-1.23720.110955
22-0.166327-1.16430.124972
23-0.155237-1.08670.141252
24-0.140231-0.98160.165555
25-0.116027-0.81220.210305
26-0.093938-0.65760.256946
27-0.078982-0.55290.291431
28-0.056036-0.39230.348287
29-0.032849-0.22990.409548
30-0.012525-0.08770.465245
310.0030960.02170.491398
320.0165030.11550.454253
330.0298360.20890.417714
340.0438530.3070.380083
350.0584110.40890.342206
360.0628820.44020.330873

\begin{tabular}{lllllllll}
\hline
Autocorrelation Function \tabularnewline
Time lag k & ACF(k) & T-STAT & P-value \tabularnewline
1 & 0.939167 & 6.5742 & 0 \tabularnewline
2 & 0.84169 & 5.8918 & 0 \tabularnewline
3 & 0.717593 & 5.0232 & 4e-06 \tabularnewline
4 & 0.58283 & 4.0798 & 8.3e-05 \tabularnewline
5 & 0.426941 & 2.9886 & 0.002186 \tabularnewline
6 & 0.253036 & 1.7713 & 0.041369 \tabularnewline
7 & 0.082193 & 0.5753 & 0.283844 \tabularnewline
8 & -0.069728 & -0.4881 & 0.313829 \tabularnewline
9 & -0.178327 & -1.2483 & 0.108928 \tabularnewline
10 & -0.278444 & -1.9491 & 0.028509 \tabularnewline
11 & -0.35726 & -2.5008 & 0.007892 \tabularnewline
12 & -0.416491 & -2.9154 & 0.002671 \tabularnewline
13 & -0.425964 & -2.9817 & 0.002227 \tabularnewline
14 & -0.406504 & -2.8455 & 0.003228 \tabularnewline
15 & -0.3729 & -2.6103 & 0.005984 \tabularnewline
16 & -0.335079 & -2.3456 & 0.011546 \tabularnewline
17 & -0.302759 & -2.1193 & 0.019578 \tabularnewline
18 & -0.265033 & -1.8552 & 0.034792 \tabularnewline
19 & -0.22154 & -1.5508 & 0.063695 \tabularnewline
20 & -0.189317 & -1.3252 & 0.095622 \tabularnewline
21 & -0.176743 & -1.2372 & 0.110955 \tabularnewline
22 & -0.166327 & -1.1643 & 0.124972 \tabularnewline
23 & -0.155237 & -1.0867 & 0.141252 \tabularnewline
24 & -0.140231 & -0.9816 & 0.165555 \tabularnewline
25 & -0.116027 & -0.8122 & 0.210305 \tabularnewline
26 & -0.093938 & -0.6576 & 0.256946 \tabularnewline
27 & -0.078982 & -0.5529 & 0.291431 \tabularnewline
28 & -0.056036 & -0.3923 & 0.348287 \tabularnewline
29 & -0.032849 & -0.2299 & 0.409548 \tabularnewline
30 & -0.012525 & -0.0877 & 0.465245 \tabularnewline
31 & 0.003096 & 0.0217 & 0.491398 \tabularnewline
32 & 0.016503 & 0.1155 & 0.454253 \tabularnewline
33 & 0.029836 & 0.2089 & 0.417714 \tabularnewline
34 & 0.043853 & 0.307 & 0.380083 \tabularnewline
35 & 0.058411 & 0.4089 & 0.342206 \tabularnewline
36 & 0.062882 & 0.4402 & 0.330873 \tabularnewline
\hline
\end{tabular}
%Source: https://freestatistics.org/blog/index.php?pk=60075&T=1

[TABLE]
[ROW][C]Autocorrelation Function[/C][/ROW]
[ROW][C]Time lag k[/C][C]ACF(k)[/C][C]T-STAT[/C][C]P-value[/C][/ROW]
[ROW][C]1[/C][C]0.939167[/C][C]6.5742[/C][C]0[/C][/ROW]
[ROW][C]2[/C][C]0.84169[/C][C]5.8918[/C][C]0[/C][/ROW]
[ROW][C]3[/C][C]0.717593[/C][C]5.0232[/C][C]4e-06[/C][/ROW]
[ROW][C]4[/C][C]0.58283[/C][C]4.0798[/C][C]8.3e-05[/C][/ROW]
[ROW][C]5[/C][C]0.426941[/C][C]2.9886[/C][C]0.002186[/C][/ROW]
[ROW][C]6[/C][C]0.253036[/C][C]1.7713[/C][C]0.041369[/C][/ROW]
[ROW][C]7[/C][C]0.082193[/C][C]0.5753[/C][C]0.283844[/C][/ROW]
[ROW][C]8[/C][C]-0.069728[/C][C]-0.4881[/C][C]0.313829[/C][/ROW]
[ROW][C]9[/C][C]-0.178327[/C][C]-1.2483[/C][C]0.108928[/C][/ROW]
[ROW][C]10[/C][C]-0.278444[/C][C]-1.9491[/C][C]0.028509[/C][/ROW]
[ROW][C]11[/C][C]-0.35726[/C][C]-2.5008[/C][C]0.007892[/C][/ROW]
[ROW][C]12[/C][C]-0.416491[/C][C]-2.9154[/C][C]0.002671[/C][/ROW]
[ROW][C]13[/C][C]-0.425964[/C][C]-2.9817[/C][C]0.002227[/C][/ROW]
[ROW][C]14[/C][C]-0.406504[/C][C]-2.8455[/C][C]0.003228[/C][/ROW]
[ROW][C]15[/C][C]-0.3729[/C][C]-2.6103[/C][C]0.005984[/C][/ROW]
[ROW][C]16[/C][C]-0.335079[/C][C]-2.3456[/C][C]0.011546[/C][/ROW]
[ROW][C]17[/C][C]-0.302759[/C][C]-2.1193[/C][C]0.019578[/C][/ROW]
[ROW][C]18[/C][C]-0.265033[/C][C]-1.8552[/C][C]0.034792[/C][/ROW]
[ROW][C]19[/C][C]-0.22154[/C][C]-1.5508[/C][C]0.063695[/C][/ROW]
[ROW][C]20[/C][C]-0.189317[/C][C]-1.3252[/C][C]0.095622[/C][/ROW]
[ROW][C]21[/C][C]-0.176743[/C][C]-1.2372[/C][C]0.110955[/C][/ROW]
[ROW][C]22[/C][C]-0.166327[/C][C]-1.1643[/C][C]0.124972[/C][/ROW]
[ROW][C]23[/C][C]-0.155237[/C][C]-1.0867[/C][C]0.141252[/C][/ROW]
[ROW][C]24[/C][C]-0.140231[/C][C]-0.9816[/C][C]0.165555[/C][/ROW]
[ROW][C]25[/C][C]-0.116027[/C][C]-0.8122[/C][C]0.210305[/C][/ROW]
[ROW][C]26[/C][C]-0.093938[/C][C]-0.6576[/C][C]0.256946[/C][/ROW]
[ROW][C]27[/C][C]-0.078982[/C][C]-0.5529[/C][C]0.291431[/C][/ROW]
[ROW][C]28[/C][C]-0.056036[/C][C]-0.3923[/C][C]0.348287[/C][/ROW]
[ROW][C]29[/C][C]-0.032849[/C][C]-0.2299[/C][C]0.409548[/C][/ROW]
[ROW][C]30[/C][C]-0.012525[/C][C]-0.0877[/C][C]0.465245[/C][/ROW]
[ROW][C]31[/C][C]0.003096[/C][C]0.0217[/C][C]0.491398[/C][/ROW]
[ROW][C]32[/C][C]0.016503[/C][C]0.1155[/C][C]0.454253[/C][/ROW]
[ROW][C]33[/C][C]0.029836[/C][C]0.2089[/C][C]0.417714[/C][/ROW]
[ROW][C]34[/C][C]0.043853[/C][C]0.307[/C][C]0.380083[/C][/ROW]
[ROW][C]35[/C][C]0.058411[/C][C]0.4089[/C][C]0.342206[/C][/ROW]
[ROW][C]36[/C][C]0.062882[/C][C]0.4402[/C][C]0.330873[/C][/ROW]
[/TABLE]
Source: https://freestatistics.org/blog/index.php?pk=60075&T=1

Globally Unique Identifier (entire table): ba.freestatistics.org/blog/index.php?pk=60075&T=1

As an alternative you can also use a QR Code:  

The GUIDs for individual cells are displayed in the table below:

Autocorrelation Function
Time lag kACF(k)T-STATP-value
10.9391676.57420
20.841695.89180
30.7175935.02324e-06
40.582834.07988.3e-05
50.4269412.98860.002186
60.2530361.77130.041369
70.0821930.57530.283844
8-0.069728-0.48810.313829
9-0.178327-1.24830.108928
10-0.278444-1.94910.028509
11-0.35726-2.50080.007892
12-0.416491-2.91540.002671
13-0.425964-2.98170.002227
14-0.406504-2.84550.003228
15-0.3729-2.61030.005984
16-0.335079-2.34560.011546
17-0.302759-2.11930.019578
18-0.265033-1.85520.034792
19-0.22154-1.55080.063695
20-0.189317-1.32520.095622
21-0.176743-1.23720.110955
22-0.166327-1.16430.124972
23-0.155237-1.08670.141252
24-0.140231-0.98160.165555
25-0.116027-0.81220.210305
26-0.093938-0.65760.256946
27-0.078982-0.55290.291431
28-0.056036-0.39230.348287
29-0.032849-0.22990.409548
30-0.012525-0.08770.465245
310.0030960.02170.491398
320.0165030.11550.454253
330.0298360.20890.417714
340.0438530.3070.380083
350.0584110.40890.342206
360.0628820.44020.330873


Partial Autocorrelation Function
Time lag kPACF(k)T-STATP-value
10.9391676.57420
2-0.342011-2.39410.010267
3-0.211627-1.48140.072453
4-0.075872-0.53110.298872
5-0.247296-1.73110.044866
6-0.224507-1.57160.061245
7-0.024971-0.17480.430979
80.0324980.22750.410497
90.2300841.61060.056847
10-0.212315-1.48620.071816
11-0.015695-0.10990.456483
12-0.042043-0.29430.384886
130.1949261.36450.089325
14-0.051283-0.3590.360575
15-0.074808-0.52370.301439
16-0.068263-0.47780.317444
17-0.160194-1.12140.133801
18-0.145821-1.02070.156194
190.0854750.59830.276189
20-0.136481-0.95540.172041
210.0139140.09740.461405
220.0144550.10120.459908
230.0002370.00170.499341
24-0.008815-0.06170.475525
250.1714971.20050.117863
26-0.026926-0.18850.425638
27-0.118065-0.82650.206277
28-0.028315-0.19820.421852
29-0.153146-1.0720.14448
30-0.109799-0.76860.222912
310.0430710.30150.382155
32-0.032655-0.22860.410071
330.0425620.29790.383508
340.0275930.19320.423819
350.0087870.06150.475601
36-0.03368-0.23580.407301

\begin{tabular}{lllllllll}
\hline
Partial Autocorrelation Function \tabularnewline
Time lag k & PACF(k) & T-STAT & P-value \tabularnewline
1 & 0.939167 & 6.5742 & 0 \tabularnewline
2 & -0.342011 & -2.3941 & 0.010267 \tabularnewline
3 & -0.211627 & -1.4814 & 0.072453 \tabularnewline
4 & -0.075872 & -0.5311 & 0.298872 \tabularnewline
5 & -0.247296 & -1.7311 & 0.044866 \tabularnewline
6 & -0.224507 & -1.5716 & 0.061245 \tabularnewline
7 & -0.024971 & -0.1748 & 0.430979 \tabularnewline
8 & 0.032498 & 0.2275 & 0.410497 \tabularnewline
9 & 0.230084 & 1.6106 & 0.056847 \tabularnewline
10 & -0.212315 & -1.4862 & 0.071816 \tabularnewline
11 & -0.015695 & -0.1099 & 0.456483 \tabularnewline
12 & -0.042043 & -0.2943 & 0.384886 \tabularnewline
13 & 0.194926 & 1.3645 & 0.089325 \tabularnewline
14 & -0.051283 & -0.359 & 0.360575 \tabularnewline
15 & -0.074808 & -0.5237 & 0.301439 \tabularnewline
16 & -0.068263 & -0.4778 & 0.317444 \tabularnewline
17 & -0.160194 & -1.1214 & 0.133801 \tabularnewline
18 & -0.145821 & -1.0207 & 0.156194 \tabularnewline
19 & 0.085475 & 0.5983 & 0.276189 \tabularnewline
20 & -0.136481 & -0.9554 & 0.172041 \tabularnewline
21 & 0.013914 & 0.0974 & 0.461405 \tabularnewline
22 & 0.014455 & 0.1012 & 0.459908 \tabularnewline
23 & 0.000237 & 0.0017 & 0.499341 \tabularnewline
24 & -0.008815 & -0.0617 & 0.475525 \tabularnewline
25 & 0.171497 & 1.2005 & 0.117863 \tabularnewline
26 & -0.026926 & -0.1885 & 0.425638 \tabularnewline
27 & -0.118065 & -0.8265 & 0.206277 \tabularnewline
28 & -0.028315 & -0.1982 & 0.421852 \tabularnewline
29 & -0.153146 & -1.072 & 0.14448 \tabularnewline
30 & -0.109799 & -0.7686 & 0.222912 \tabularnewline
31 & 0.043071 & 0.3015 & 0.382155 \tabularnewline
32 & -0.032655 & -0.2286 & 0.410071 \tabularnewline
33 & 0.042562 & 0.2979 & 0.383508 \tabularnewline
34 & 0.027593 & 0.1932 & 0.423819 \tabularnewline
35 & 0.008787 & 0.0615 & 0.475601 \tabularnewline
36 & -0.03368 & -0.2358 & 0.407301 \tabularnewline
\hline
\end{tabular}
%Source: https://freestatistics.org/blog/index.php?pk=60075&T=2

[TABLE]
[ROW][C]Partial Autocorrelation Function[/C][/ROW]
[ROW][C]Time lag k[/C][C]PACF(k)[/C][C]T-STAT[/C][C]P-value[/C][/ROW]
[ROW][C]1[/C][C]0.939167[/C][C]6.5742[/C][C]0[/C][/ROW]
[ROW][C]2[/C][C]-0.342011[/C][C]-2.3941[/C][C]0.010267[/C][/ROW]
[ROW][C]3[/C][C]-0.211627[/C][C]-1.4814[/C][C]0.072453[/C][/ROW]
[ROW][C]4[/C][C]-0.075872[/C][C]-0.5311[/C][C]0.298872[/C][/ROW]
[ROW][C]5[/C][C]-0.247296[/C][C]-1.7311[/C][C]0.044866[/C][/ROW]
[ROW][C]6[/C][C]-0.224507[/C][C]-1.5716[/C][C]0.061245[/C][/ROW]
[ROW][C]7[/C][C]-0.024971[/C][C]-0.1748[/C][C]0.430979[/C][/ROW]
[ROW][C]8[/C][C]0.032498[/C][C]0.2275[/C][C]0.410497[/C][/ROW]
[ROW][C]9[/C][C]0.230084[/C][C]1.6106[/C][C]0.056847[/C][/ROW]
[ROW][C]10[/C][C]-0.212315[/C][C]-1.4862[/C][C]0.071816[/C][/ROW]
[ROW][C]11[/C][C]-0.015695[/C][C]-0.1099[/C][C]0.456483[/C][/ROW]
[ROW][C]12[/C][C]-0.042043[/C][C]-0.2943[/C][C]0.384886[/C][/ROW]
[ROW][C]13[/C][C]0.194926[/C][C]1.3645[/C][C]0.089325[/C][/ROW]
[ROW][C]14[/C][C]-0.051283[/C][C]-0.359[/C][C]0.360575[/C][/ROW]
[ROW][C]15[/C][C]-0.074808[/C][C]-0.5237[/C][C]0.301439[/C][/ROW]
[ROW][C]16[/C][C]-0.068263[/C][C]-0.4778[/C][C]0.317444[/C][/ROW]
[ROW][C]17[/C][C]-0.160194[/C][C]-1.1214[/C][C]0.133801[/C][/ROW]
[ROW][C]18[/C][C]-0.145821[/C][C]-1.0207[/C][C]0.156194[/C][/ROW]
[ROW][C]19[/C][C]0.085475[/C][C]0.5983[/C][C]0.276189[/C][/ROW]
[ROW][C]20[/C][C]-0.136481[/C][C]-0.9554[/C][C]0.172041[/C][/ROW]
[ROW][C]21[/C][C]0.013914[/C][C]0.0974[/C][C]0.461405[/C][/ROW]
[ROW][C]22[/C][C]0.014455[/C][C]0.1012[/C][C]0.459908[/C][/ROW]
[ROW][C]23[/C][C]0.000237[/C][C]0.0017[/C][C]0.499341[/C][/ROW]
[ROW][C]24[/C][C]-0.008815[/C][C]-0.0617[/C][C]0.475525[/C][/ROW]
[ROW][C]25[/C][C]0.171497[/C][C]1.2005[/C][C]0.117863[/C][/ROW]
[ROW][C]26[/C][C]-0.026926[/C][C]-0.1885[/C][C]0.425638[/C][/ROW]
[ROW][C]27[/C][C]-0.118065[/C][C]-0.8265[/C][C]0.206277[/C][/ROW]
[ROW][C]28[/C][C]-0.028315[/C][C]-0.1982[/C][C]0.421852[/C][/ROW]
[ROW][C]29[/C][C]-0.153146[/C][C]-1.072[/C][C]0.14448[/C][/ROW]
[ROW][C]30[/C][C]-0.109799[/C][C]-0.7686[/C][C]0.222912[/C][/ROW]
[ROW][C]31[/C][C]0.043071[/C][C]0.3015[/C][C]0.382155[/C][/ROW]
[ROW][C]32[/C][C]-0.032655[/C][C]-0.2286[/C][C]0.410071[/C][/ROW]
[ROW][C]33[/C][C]0.042562[/C][C]0.2979[/C][C]0.383508[/C][/ROW]
[ROW][C]34[/C][C]0.027593[/C][C]0.1932[/C][C]0.423819[/C][/ROW]
[ROW][C]35[/C][C]0.008787[/C][C]0.0615[/C][C]0.475601[/C][/ROW]
[ROW][C]36[/C][C]-0.03368[/C][C]-0.2358[/C][C]0.407301[/C][/ROW]
[/TABLE]
Source: https://freestatistics.org/blog/index.php?pk=60075&T=2

Globally Unique Identifier (entire table): ba.freestatistics.org/blog/index.php?pk=60075&T=2

As an alternative you can also use a QR Code:  

The GUIDs for individual cells are displayed in the table below:

Partial Autocorrelation Function
Time lag kPACF(k)T-STATP-value
10.9391676.57420
2-0.342011-2.39410.010267
3-0.211627-1.48140.072453
4-0.075872-0.53110.298872
5-0.247296-1.73110.044866
6-0.224507-1.57160.061245
7-0.024971-0.17480.430979
80.0324980.22750.410497
90.2300841.61060.056847
10-0.212315-1.48620.071816
11-0.015695-0.10990.456483
12-0.042043-0.29430.384886
130.1949261.36450.089325
14-0.051283-0.3590.360575
15-0.074808-0.52370.301439
16-0.068263-0.47780.317444
17-0.160194-1.12140.133801
18-0.145821-1.02070.156194
190.0854750.59830.276189
20-0.136481-0.95540.172041
210.0139140.09740.461405
220.0144550.10120.459908
230.0002370.00170.499341
24-0.008815-0.06170.475525
250.1714971.20050.117863
26-0.026926-0.18850.425638
27-0.118065-0.82650.206277
28-0.028315-0.19820.421852
29-0.153146-1.0720.14448
30-0.109799-0.76860.222912
310.0430710.30150.382155
32-0.032655-0.22860.410071
330.0425620.29790.383508
340.0275930.19320.423819
350.0087870.06150.475601
36-0.03368-0.23580.407301


Parameters (Session):
par1 = 36 ; par2 = 1 ; par3 = 0 ; par4 = 1 ; par5 = 12 ; par6 = MA ; par7 = 0.95 ;
Parameters (R input):
par1 = 36 ; par2 = 1 ; par3 = 0 ; par4 = 1 ; par5 = 12 ; par6 = MA ; par7 = 0.95 ;
R code (references can be found in the software module):
if (par1 == 'Default') {
par1 = 10*log10(length(x))
} else {
par1 <- as.numeric(par1)
}
par2 <- as.numeric(par2)
par3 <- as.numeric(par3)
par4 <- as.numeric(par4)
par5 <- as.numeric(par5)
if (par6 == 'White Noise') par6 <- 'white' else par6 <- 'ma'
par7 <- as.numeric(par7)
if (par2 == 0) {
x <- log(x)
} else {
x <- (x ^ par2 - 1) / par2
}
if (par3 > 0) x <- diff(x,lag=1,difference=par3)
if (par4 > 0) x <- diff(x,lag=par5,difference=par4)
bitmap(file='pic1.png')
racf <- acf(x, par1, main='Autocorrelation', xlab='time lag', ylab='ACF', ci.type=par6, ci=par7, sub=paste('(lambda=',par2,', d=',par3,', D=',par4,', CI=', par7, ', CI type=',par6,')',sep=''))
dev.off()
bitmap(file='pic2.png')
rpacf <- pacf(x,par1,main='Partial Autocorrelation',xlab='lags',ylab='PACF')
dev.off()
(myacf <- c(racf$acf))
(mypacf <- c(rpacf$acf))
lengthx <- length(x)
sqrtn <- sqrt(lengthx)
load(file='createtable')
a<-table.start()
a<-table.row.start(a)
a<-table.element(a,'Autocorrelation Function',4,TRUE)
a<-table.row.end(a)
a<-table.row.start(a)
a<-table.element(a,'Time lag k',header=TRUE)
a<-table.element(a,hyperlink('basics.htm','ACF(k)','click here for more information about the Autocorrelation Function'),header=TRUE)
a<-table.element(a,'T-STAT',header=TRUE)
a<-table.element(a,'P-value',header=TRUE)
a<-table.row.end(a)
for (i in 2:(par1+1)) {
a<-table.row.start(a)
a<-table.element(a,i-1,header=TRUE)
a<-table.element(a,round(myacf[i],6))
mytstat <- myacf[i]*sqrtn
a<-table.element(a,round(mytstat,4))
a<-table.element(a,round(1-pt(abs(mytstat),lengthx),6))
a<-table.row.end(a)
}
a<-table.end(a)
table.save(a,file='mytable.tab')
a<-table.start()
a<-table.row.start(a)
a<-table.element(a,'Partial Autocorrelation Function',4,TRUE)
a<-table.row.end(a)
a<-table.row.start(a)
a<-table.element(a,'Time lag k',header=TRUE)
a<-table.element(a,hyperlink('basics.htm','PACF(k)','click here for more information about the Partial Autocorrelation Function'),header=TRUE)
a<-table.element(a,'T-STAT',header=TRUE)
a<-table.element(a,'P-value',header=TRUE)
a<-table.row.end(a)
for (i in 1:par1) {
a<-table.row.start(a)
a<-table.element(a,i,header=TRUE)
a<-table.element(a,round(mypacf[i],6))
mytstat <- mypacf[i]*sqrtn
a<-table.element(a,round(mytstat,4))
a<-table.element(a,round(1-pt(abs(mytstat),lengthx),6))
a<-table.row.end(a)
}
a<-table.end(a)
table.save(a,file='mytable1.tab')