Free Statistics

of Irreproducible Research!

Author's title

Author*Unverified author*
R Software Modulerwasp_autocorrelation.wasp
Title produced by software(Partial) Autocorrelation Function
Date of computationThu, 26 Nov 2009 10:00:53 -0700
Cite this page as followsStatistical Computations at FreeStatistics.org, Office for Research Development and Education, URL https://freestatistics.org/blog/index.php?v=date/2009/Nov/26/t1259254945e8i1yo70mwo1fq6.htm/, Retrieved Sun, 28 Apr 2024 20:26:02 +0000
Statistical Computations at FreeStatistics.org, Office for Research Development and Education, URL https://freestatistics.org/blog/index.php?pk=60174, Retrieved Sun, 28 Apr 2024 20:26:02 +0000
QR Codes:

Original text written by user:
IsPrivate?No (this computation is public)
User-defined keywords
Estimated Impact103
Family? (F = Feedback message, R = changed R code, M = changed R Module, P = changed Parameters, D = changed Data)
-     [Univariate Explorative Data Analysis] [Run Sequence gebo...] [2008-12-12 13:32:37] [76963dc1903f0f612b6153510a3818cf]
- R  D  [Univariate Explorative Data Analysis] [Run Sequence gebo...] [2008-12-17 12:14:40] [76963dc1903f0f612b6153510a3818cf]
-         [Univariate Explorative Data Analysis] [Run Sequence Plot...] [2008-12-22 18:19:51] [1ce0d16c8f4225c977b42c8fa93bc163]
- RMP       [(Partial) Autocorrelation Function] [Identifying Integ...] [2009-11-22 12:26:39] [b98453cac15ba1066b407e146608df68]
-    D          [(Partial) Autocorrelation Function] [Workshop 8: Metho...] [2009-11-26 17:00:53] [376758ffc0b468a3da03e7187c03d703] [Current]
Feedback Forum

Post a new message
Dataseries X:
0.7461
0.7775
0.7790
0.7744
0.7905
0.7719
0.7811
0.7557
0.7637
0.7595
0.7471
0.7615
0.7487
0.7389
0.7337
0.7510
0.7382
0.7159
0.7542
0.7636
0.7433
0.7658
0.7627
0.7480
0.7692
0.7850
0.7913
0.7720
0.7880
0.8070
0.8268
0.8244
0.8487
0.8572
0.8214
0.8827
0.9216
0.8865
0.8816
0.8884
0.9466
0.9180
0.9337
0.9559
0.9626
0.9434
0.8639
0.7996
0.6680
0.6572
0.6928
0.6438
0.6454
0.6873
0.7265
0.7912
0.8114
0.8281
0.8393


Summary of computational transaction
Raw Inputview raw input (R code)
Raw Outputview raw output of R engine
Computing time1 seconds
R Server'Gwilym Jenkins' @ 72.249.127.135

\begin{tabular}{lllllllll}
\hline
Summary of computational transaction \tabularnewline
Raw Input & view raw input (R code)  \tabularnewline
Raw Output & view raw output of R engine  \tabularnewline
Computing time & 1 seconds \tabularnewline
R Server & 'Gwilym Jenkins' @ 72.249.127.135 \tabularnewline
\hline
\end{tabular}
%Source: https://freestatistics.org/blog/index.php?pk=60174&T=0

[TABLE]
[ROW][C]Summary of computational transaction[/C][/ROW]
[ROW][C]Raw Input[/C][C]view raw input (R code) [/C][/ROW]
[ROW][C]Raw Output[/C][C]view raw output of R engine [/C][/ROW]
[ROW][C]Computing time[/C][C]1 seconds[/C][/ROW]
[ROW][C]R Server[/C][C]'Gwilym Jenkins' @ 72.249.127.135[/C][/ROW]
[/TABLE]
Source: https://freestatistics.org/blog/index.php?pk=60174&T=0

Globally Unique Identifier (entire table): ba.freestatistics.org/blog/index.php?pk=60174&T=0

As an alternative you can also use a QR Code:  

The GUIDs for individual cells are displayed in the table below:

Summary of computational transaction
Raw Inputview raw input (R code)
Raw Outputview raw output of R engine
Computing time1 seconds
R Server'Gwilym Jenkins' @ 72.249.127.135


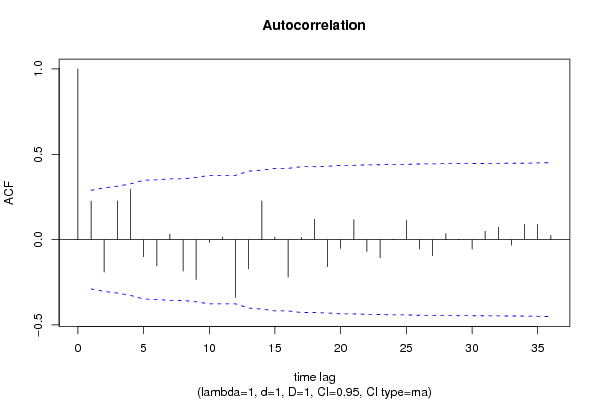
Autocorrelation Function
Time lag kACF(k)T-STATP-value
10.2260561.53320.06604
2-0.189765-1.2870.102258
30.2265651.53660.065617
40.2956762.00540.025413
5-0.099793-0.67680.250952
6-0.154488-1.04780.150105
70.0326720.22160.412807
8-0.183982-1.24780.109204
9-0.233503-1.58370.060057
10-0.01721-0.11670.453795
110.0142270.09650.461775
12-0.338472-2.29560.013153
13-0.171172-1.16090.125826
140.2270351.53980.065227
150.015260.10350.459009
16-0.219075-1.48580.072072
170.0137120.0930.463155
180.1195130.81060.210891
19-0.158649-1.0760.143767
20-0.0514-0.34860.364485
210.1167580.79190.216244
22-0.069086-0.46860.320796
23-0.106713-0.72380.236438
240.0018370.01250.495056
250.1125420.76330.224592
26-0.054814-0.37180.355887
27-0.093845-0.63650.263807
280.0353310.23960.405842
290.0025360.01720.493175
30-0.055488-0.37630.354199
310.049470.33550.369379
320.0726070.49240.312374
33-0.032439-0.220.413417
340.0888560.60260.274851
350.0890490.6040.274419
360.0249320.16910.43323

\begin{tabular}{lllllllll}
\hline
Autocorrelation Function \tabularnewline
Time lag k & ACF(k) & T-STAT & P-value \tabularnewline
1 & 0.226056 & 1.5332 & 0.06604 \tabularnewline
2 & -0.189765 & -1.287 & 0.102258 \tabularnewline
3 & 0.226565 & 1.5366 & 0.065617 \tabularnewline
4 & 0.295676 & 2.0054 & 0.025413 \tabularnewline
5 & -0.099793 & -0.6768 & 0.250952 \tabularnewline
6 & -0.154488 & -1.0478 & 0.150105 \tabularnewline
7 & 0.032672 & 0.2216 & 0.412807 \tabularnewline
8 & -0.183982 & -1.2478 & 0.109204 \tabularnewline
9 & -0.233503 & -1.5837 & 0.060057 \tabularnewline
10 & -0.01721 & -0.1167 & 0.453795 \tabularnewline
11 & 0.014227 & 0.0965 & 0.461775 \tabularnewline
12 & -0.338472 & -2.2956 & 0.013153 \tabularnewline
13 & -0.171172 & -1.1609 & 0.125826 \tabularnewline
14 & 0.227035 & 1.5398 & 0.065227 \tabularnewline
15 & 0.01526 & 0.1035 & 0.459009 \tabularnewline
16 & -0.219075 & -1.4858 & 0.072072 \tabularnewline
17 & 0.013712 & 0.093 & 0.463155 \tabularnewline
18 & 0.119513 & 0.8106 & 0.210891 \tabularnewline
19 & -0.158649 & -1.076 & 0.143767 \tabularnewline
20 & -0.0514 & -0.3486 & 0.364485 \tabularnewline
21 & 0.116758 & 0.7919 & 0.216244 \tabularnewline
22 & -0.069086 & -0.4686 & 0.320796 \tabularnewline
23 & -0.106713 & -0.7238 & 0.236438 \tabularnewline
24 & 0.001837 & 0.0125 & 0.495056 \tabularnewline
25 & 0.112542 & 0.7633 & 0.224592 \tabularnewline
26 & -0.054814 & -0.3718 & 0.355887 \tabularnewline
27 & -0.093845 & -0.6365 & 0.263807 \tabularnewline
28 & 0.035331 & 0.2396 & 0.405842 \tabularnewline
29 & 0.002536 & 0.0172 & 0.493175 \tabularnewline
30 & -0.055488 & -0.3763 & 0.354199 \tabularnewline
31 & 0.04947 & 0.3355 & 0.369379 \tabularnewline
32 & 0.072607 & 0.4924 & 0.312374 \tabularnewline
33 & -0.032439 & -0.22 & 0.413417 \tabularnewline
34 & 0.088856 & 0.6026 & 0.274851 \tabularnewline
35 & 0.089049 & 0.604 & 0.274419 \tabularnewline
36 & 0.024932 & 0.1691 & 0.43323 \tabularnewline
\hline
\end{tabular}
%Source: https://freestatistics.org/blog/index.php?pk=60174&T=1

[TABLE]
[ROW][C]Autocorrelation Function[/C][/ROW]
[ROW][C]Time lag k[/C][C]ACF(k)[/C][C]T-STAT[/C][C]P-value[/C][/ROW]
[ROW][C]1[/C][C]0.226056[/C][C]1.5332[/C][C]0.06604[/C][/ROW]
[ROW][C]2[/C][C]-0.189765[/C][C]-1.287[/C][C]0.102258[/C][/ROW]
[ROW][C]3[/C][C]0.226565[/C][C]1.5366[/C][C]0.065617[/C][/ROW]
[ROW][C]4[/C][C]0.295676[/C][C]2.0054[/C][C]0.025413[/C][/ROW]
[ROW][C]5[/C][C]-0.099793[/C][C]-0.6768[/C][C]0.250952[/C][/ROW]
[ROW][C]6[/C][C]-0.154488[/C][C]-1.0478[/C][C]0.150105[/C][/ROW]
[ROW][C]7[/C][C]0.032672[/C][C]0.2216[/C][C]0.412807[/C][/ROW]
[ROW][C]8[/C][C]-0.183982[/C][C]-1.2478[/C][C]0.109204[/C][/ROW]
[ROW][C]9[/C][C]-0.233503[/C][C]-1.5837[/C][C]0.060057[/C][/ROW]
[ROW][C]10[/C][C]-0.01721[/C][C]-0.1167[/C][C]0.453795[/C][/ROW]
[ROW][C]11[/C][C]0.014227[/C][C]0.0965[/C][C]0.461775[/C][/ROW]
[ROW][C]12[/C][C]-0.338472[/C][C]-2.2956[/C][C]0.013153[/C][/ROW]
[ROW][C]13[/C][C]-0.171172[/C][C]-1.1609[/C][C]0.125826[/C][/ROW]
[ROW][C]14[/C][C]0.227035[/C][C]1.5398[/C][C]0.065227[/C][/ROW]
[ROW][C]15[/C][C]0.01526[/C][C]0.1035[/C][C]0.459009[/C][/ROW]
[ROW][C]16[/C][C]-0.219075[/C][C]-1.4858[/C][C]0.072072[/C][/ROW]
[ROW][C]17[/C][C]0.013712[/C][C]0.093[/C][C]0.463155[/C][/ROW]
[ROW][C]18[/C][C]0.119513[/C][C]0.8106[/C][C]0.210891[/C][/ROW]
[ROW][C]19[/C][C]-0.158649[/C][C]-1.076[/C][C]0.143767[/C][/ROW]
[ROW][C]20[/C][C]-0.0514[/C][C]-0.3486[/C][C]0.364485[/C][/ROW]
[ROW][C]21[/C][C]0.116758[/C][C]0.7919[/C][C]0.216244[/C][/ROW]
[ROW][C]22[/C][C]-0.069086[/C][C]-0.4686[/C][C]0.320796[/C][/ROW]
[ROW][C]23[/C][C]-0.106713[/C][C]-0.7238[/C][C]0.236438[/C][/ROW]
[ROW][C]24[/C][C]0.001837[/C][C]0.0125[/C][C]0.495056[/C][/ROW]
[ROW][C]25[/C][C]0.112542[/C][C]0.7633[/C][C]0.224592[/C][/ROW]
[ROW][C]26[/C][C]-0.054814[/C][C]-0.3718[/C][C]0.355887[/C][/ROW]
[ROW][C]27[/C][C]-0.093845[/C][C]-0.6365[/C][C]0.263807[/C][/ROW]
[ROW][C]28[/C][C]0.035331[/C][C]0.2396[/C][C]0.405842[/C][/ROW]
[ROW][C]29[/C][C]0.002536[/C][C]0.0172[/C][C]0.493175[/C][/ROW]
[ROW][C]30[/C][C]-0.055488[/C][C]-0.3763[/C][C]0.354199[/C][/ROW]
[ROW][C]31[/C][C]0.04947[/C][C]0.3355[/C][C]0.369379[/C][/ROW]
[ROW][C]32[/C][C]0.072607[/C][C]0.4924[/C][C]0.312374[/C][/ROW]
[ROW][C]33[/C][C]-0.032439[/C][C]-0.22[/C][C]0.413417[/C][/ROW]
[ROW][C]34[/C][C]0.088856[/C][C]0.6026[/C][C]0.274851[/C][/ROW]
[ROW][C]35[/C][C]0.089049[/C][C]0.604[/C][C]0.274419[/C][/ROW]
[ROW][C]36[/C][C]0.024932[/C][C]0.1691[/C][C]0.43323[/C][/ROW]
[/TABLE]
Source: https://freestatistics.org/blog/index.php?pk=60174&T=1

Globally Unique Identifier (entire table): ba.freestatistics.org/blog/index.php?pk=60174&T=1

As an alternative you can also use a QR Code:  

The GUIDs for individual cells are displayed in the table below:

Autocorrelation Function
Time lag kACF(k)T-STATP-value
10.2260561.53320.06604
2-0.189765-1.2870.102258
30.2265651.53660.065617
40.2956762.00540.025413
5-0.099793-0.67680.250952
6-0.154488-1.04780.150105
70.0326720.22160.412807
8-0.183982-1.24780.109204
9-0.233503-1.58370.060057
10-0.01721-0.11670.453795
110.0142270.09650.461775
12-0.338472-2.29560.013153
13-0.171172-1.16090.125826
140.2270351.53980.065227
150.015260.10350.459009
16-0.219075-1.48580.072072
170.0137120.0930.463155
180.1195130.81060.210891
19-0.158649-1.0760.143767
20-0.0514-0.34860.364485
210.1167580.79190.216244
22-0.069086-0.46860.320796
23-0.106713-0.72380.236438
240.0018370.01250.495056
250.1125420.76330.224592
26-0.054814-0.37180.355887
27-0.093845-0.63650.263807
280.0353310.23960.405842
290.0025360.01720.493175
30-0.055488-0.37630.354199
310.049470.33550.369379
320.0726070.49240.312374
33-0.032439-0.220.413417
340.0888560.60260.274851
350.0890490.6040.274419
360.0249320.16910.43323


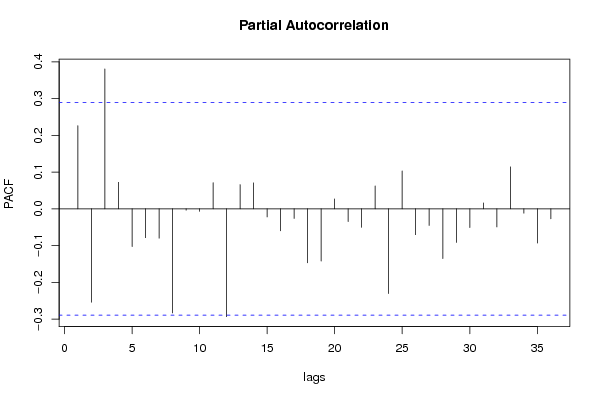
Partial Autocorrelation Function
Time lag kPACF(k)T-STATP-value
10.2260561.53320.06604
2-0.253837-1.72160.04593
30.3804332.58020.006566
40.0723710.49080.312934
5-0.102458-0.69490.245305
6-0.078267-0.53080.299044
7-0.079741-0.54080.295618
8-0.282942-1.9190.0306
9-0.003463-0.02350.490683
10-0.006527-0.04430.48244
110.0712790.48340.31554
12-0.293079-1.98780.026405
130.0659240.44710.328444
140.0706670.47930.317002
15-0.02189-0.14850.441312
16-0.059646-0.40450.343846
17-0.026183-0.17760.429916
18-0.146554-0.9940.162717
19-0.142046-0.96340.170192
200.0270530.18350.427614
21-0.034682-0.23520.407538
22-0.050274-0.3410.367337
230.0624420.42350.33695
24-0.230459-1.5630.062448
250.103030.69880.244104
26-0.070104-0.47550.318351
27-0.045174-0.30640.380347
28-0.134986-0.91550.182347
29-0.091355-0.61960.269289
30-0.050878-0.34510.365808
310.0161510.10950.456626
32-0.049224-0.33390.370005
330.1141740.77440.221338
34-0.011912-0.08080.46798
35-0.092867-0.62990.265953
36-0.026966-0.18290.427843

\begin{tabular}{lllllllll}
\hline
Partial Autocorrelation Function \tabularnewline
Time lag k & PACF(k) & T-STAT & P-value \tabularnewline
1 & 0.226056 & 1.5332 & 0.06604 \tabularnewline
2 & -0.253837 & -1.7216 & 0.04593 \tabularnewline
3 & 0.380433 & 2.5802 & 0.006566 \tabularnewline
4 & 0.072371 & 0.4908 & 0.312934 \tabularnewline
5 & -0.102458 & -0.6949 & 0.245305 \tabularnewline
6 & -0.078267 & -0.5308 & 0.299044 \tabularnewline
7 & -0.079741 & -0.5408 & 0.295618 \tabularnewline
8 & -0.282942 & -1.919 & 0.0306 \tabularnewline
9 & -0.003463 & -0.0235 & 0.490683 \tabularnewline
10 & -0.006527 & -0.0443 & 0.48244 \tabularnewline
11 & 0.071279 & 0.4834 & 0.31554 \tabularnewline
12 & -0.293079 & -1.9878 & 0.026405 \tabularnewline
13 & 0.065924 & 0.4471 & 0.328444 \tabularnewline
14 & 0.070667 & 0.4793 & 0.317002 \tabularnewline
15 & -0.02189 & -0.1485 & 0.441312 \tabularnewline
16 & -0.059646 & -0.4045 & 0.343846 \tabularnewline
17 & -0.026183 & -0.1776 & 0.429916 \tabularnewline
18 & -0.146554 & -0.994 & 0.162717 \tabularnewline
19 & -0.142046 & -0.9634 & 0.170192 \tabularnewline
20 & 0.027053 & 0.1835 & 0.427614 \tabularnewline
21 & -0.034682 & -0.2352 & 0.407538 \tabularnewline
22 & -0.050274 & -0.341 & 0.367337 \tabularnewline
23 & 0.062442 & 0.4235 & 0.33695 \tabularnewline
24 & -0.230459 & -1.563 & 0.062448 \tabularnewline
25 & 0.10303 & 0.6988 & 0.244104 \tabularnewline
26 & -0.070104 & -0.4755 & 0.318351 \tabularnewline
27 & -0.045174 & -0.3064 & 0.380347 \tabularnewline
28 & -0.134986 & -0.9155 & 0.182347 \tabularnewline
29 & -0.091355 & -0.6196 & 0.269289 \tabularnewline
30 & -0.050878 & -0.3451 & 0.365808 \tabularnewline
31 & 0.016151 & 0.1095 & 0.456626 \tabularnewline
32 & -0.049224 & -0.3339 & 0.370005 \tabularnewline
33 & 0.114174 & 0.7744 & 0.221338 \tabularnewline
34 & -0.011912 & -0.0808 & 0.46798 \tabularnewline
35 & -0.092867 & -0.6299 & 0.265953 \tabularnewline
36 & -0.026966 & -0.1829 & 0.427843 \tabularnewline
\hline
\end{tabular}
%Source: https://freestatistics.org/blog/index.php?pk=60174&T=2

[TABLE]
[ROW][C]Partial Autocorrelation Function[/C][/ROW]
[ROW][C]Time lag k[/C][C]PACF(k)[/C][C]T-STAT[/C][C]P-value[/C][/ROW]
[ROW][C]1[/C][C]0.226056[/C][C]1.5332[/C][C]0.06604[/C][/ROW]
[ROW][C]2[/C][C]-0.253837[/C][C]-1.7216[/C][C]0.04593[/C][/ROW]
[ROW][C]3[/C][C]0.380433[/C][C]2.5802[/C][C]0.006566[/C][/ROW]
[ROW][C]4[/C][C]0.072371[/C][C]0.4908[/C][C]0.312934[/C][/ROW]
[ROW][C]5[/C][C]-0.102458[/C][C]-0.6949[/C][C]0.245305[/C][/ROW]
[ROW][C]6[/C][C]-0.078267[/C][C]-0.5308[/C][C]0.299044[/C][/ROW]
[ROW][C]7[/C][C]-0.079741[/C][C]-0.5408[/C][C]0.295618[/C][/ROW]
[ROW][C]8[/C][C]-0.282942[/C][C]-1.919[/C][C]0.0306[/C][/ROW]
[ROW][C]9[/C][C]-0.003463[/C][C]-0.0235[/C][C]0.490683[/C][/ROW]
[ROW][C]10[/C][C]-0.006527[/C][C]-0.0443[/C][C]0.48244[/C][/ROW]
[ROW][C]11[/C][C]0.071279[/C][C]0.4834[/C][C]0.31554[/C][/ROW]
[ROW][C]12[/C][C]-0.293079[/C][C]-1.9878[/C][C]0.026405[/C][/ROW]
[ROW][C]13[/C][C]0.065924[/C][C]0.4471[/C][C]0.328444[/C][/ROW]
[ROW][C]14[/C][C]0.070667[/C][C]0.4793[/C][C]0.317002[/C][/ROW]
[ROW][C]15[/C][C]-0.02189[/C][C]-0.1485[/C][C]0.441312[/C][/ROW]
[ROW][C]16[/C][C]-0.059646[/C][C]-0.4045[/C][C]0.343846[/C][/ROW]
[ROW][C]17[/C][C]-0.026183[/C][C]-0.1776[/C][C]0.429916[/C][/ROW]
[ROW][C]18[/C][C]-0.146554[/C][C]-0.994[/C][C]0.162717[/C][/ROW]
[ROW][C]19[/C][C]-0.142046[/C][C]-0.9634[/C][C]0.170192[/C][/ROW]
[ROW][C]20[/C][C]0.027053[/C][C]0.1835[/C][C]0.427614[/C][/ROW]
[ROW][C]21[/C][C]-0.034682[/C][C]-0.2352[/C][C]0.407538[/C][/ROW]
[ROW][C]22[/C][C]-0.050274[/C][C]-0.341[/C][C]0.367337[/C][/ROW]
[ROW][C]23[/C][C]0.062442[/C][C]0.4235[/C][C]0.33695[/C][/ROW]
[ROW][C]24[/C][C]-0.230459[/C][C]-1.563[/C][C]0.062448[/C][/ROW]
[ROW][C]25[/C][C]0.10303[/C][C]0.6988[/C][C]0.244104[/C][/ROW]
[ROW][C]26[/C][C]-0.070104[/C][C]-0.4755[/C][C]0.318351[/C][/ROW]
[ROW][C]27[/C][C]-0.045174[/C][C]-0.3064[/C][C]0.380347[/C][/ROW]
[ROW][C]28[/C][C]-0.134986[/C][C]-0.9155[/C][C]0.182347[/C][/ROW]
[ROW][C]29[/C][C]-0.091355[/C][C]-0.6196[/C][C]0.269289[/C][/ROW]
[ROW][C]30[/C][C]-0.050878[/C][C]-0.3451[/C][C]0.365808[/C][/ROW]
[ROW][C]31[/C][C]0.016151[/C][C]0.1095[/C][C]0.456626[/C][/ROW]
[ROW][C]32[/C][C]-0.049224[/C][C]-0.3339[/C][C]0.370005[/C][/ROW]
[ROW][C]33[/C][C]0.114174[/C][C]0.7744[/C][C]0.221338[/C][/ROW]
[ROW][C]34[/C][C]-0.011912[/C][C]-0.0808[/C][C]0.46798[/C][/ROW]
[ROW][C]35[/C][C]-0.092867[/C][C]-0.6299[/C][C]0.265953[/C][/ROW]
[ROW][C]36[/C][C]-0.026966[/C][C]-0.1829[/C][C]0.427843[/C][/ROW]
[/TABLE]
Source: https://freestatistics.org/blog/index.php?pk=60174&T=2

Globally Unique Identifier (entire table): ba.freestatistics.org/blog/index.php?pk=60174&T=2

As an alternative you can also use a QR Code:  

The GUIDs for individual cells are displayed in the table below:

Partial Autocorrelation Function
Time lag kPACF(k)T-STATP-value
10.2260561.53320.06604
2-0.253837-1.72160.04593
30.3804332.58020.006566
40.0723710.49080.312934
5-0.102458-0.69490.245305
6-0.078267-0.53080.299044
7-0.079741-0.54080.295618
8-0.282942-1.9190.0306
9-0.003463-0.02350.490683
10-0.006527-0.04430.48244
110.0712790.48340.31554
12-0.293079-1.98780.026405
130.0659240.44710.328444
140.0706670.47930.317002
15-0.02189-0.14850.441312
16-0.059646-0.40450.343846
17-0.026183-0.17760.429916
18-0.146554-0.9940.162717
19-0.142046-0.96340.170192
200.0270530.18350.427614
21-0.034682-0.23520.407538
22-0.050274-0.3410.367337
230.0624420.42350.33695
24-0.230459-1.5630.062448
250.103030.69880.244104
26-0.070104-0.47550.318351
27-0.045174-0.30640.380347
28-0.134986-0.91550.182347
29-0.091355-0.61960.269289
30-0.050878-0.34510.365808
310.0161510.10950.456626
32-0.049224-0.33390.370005
330.1141740.77440.221338
34-0.011912-0.08080.46798
35-0.092867-0.62990.265953
36-0.026966-0.18290.427843


Parameters (Session):
par1 = 36 ; par2 = 1 ; par3 = 1 ; par4 = 1 ; par5 = 12 ; par6 = MA ; par7 = 0.95 ;
Parameters (R input):
par1 = 36 ; par2 = 1 ; par3 = 1 ; par4 = 1 ; par5 = 12 ; par6 = MA ; par7 = 0.95 ;
R code (references can be found in the software module):
if (par1 == 'Default') {
par1 = 10*log10(length(x))
} else {
par1 <- as.numeric(par1)
}
par2 <- as.numeric(par2)
par3 <- as.numeric(par3)
par4 <- as.numeric(par4)
par5 <- as.numeric(par5)
if (par6 == 'White Noise') par6 <- 'white' else par6 <- 'ma'
par7 <- as.numeric(par7)
if (par2 == 0) {
x <- log(x)
} else {
x <- (x ^ par2 - 1) / par2
}
if (par3 > 0) x <- diff(x,lag=1,difference=par3)
if (par4 > 0) x <- diff(x,lag=par5,difference=par4)
bitmap(file='pic1.png')
racf <- acf(x, par1, main='Autocorrelation', xlab='time lag', ylab='ACF', ci.type=par6, ci=par7, sub=paste('(lambda=',par2,', d=',par3,', D=',par4,', CI=', par7, ', CI type=',par6,')',sep=''))
dev.off()
bitmap(file='pic2.png')
rpacf <- pacf(x,par1,main='Partial Autocorrelation',xlab='lags',ylab='PACF')
dev.off()
(myacf <- c(racf$acf))
(mypacf <- c(rpacf$acf))
lengthx <- length(x)
sqrtn <- sqrt(lengthx)
load(file='createtable')
a<-table.start()
a<-table.row.start(a)
a<-table.element(a,'Autocorrelation Function',4,TRUE)
a<-table.row.end(a)
a<-table.row.start(a)
a<-table.element(a,'Time lag k',header=TRUE)
a<-table.element(a,hyperlink('basics.htm','ACF(k)','click here for more information about the Autocorrelation Function'),header=TRUE)
a<-table.element(a,'T-STAT',header=TRUE)
a<-table.element(a,'P-value',header=TRUE)
a<-table.row.end(a)
for (i in 2:(par1+1)) {
a<-table.row.start(a)
a<-table.element(a,i-1,header=TRUE)
a<-table.element(a,round(myacf[i],6))
mytstat <- myacf[i]*sqrtn
a<-table.element(a,round(mytstat,4))
a<-table.element(a,round(1-pt(abs(mytstat),lengthx),6))
a<-table.row.end(a)
}
a<-table.end(a)
table.save(a,file='mytable.tab')
a<-table.start()
a<-table.row.start(a)
a<-table.element(a,'Partial Autocorrelation Function',4,TRUE)
a<-table.row.end(a)
a<-table.row.start(a)
a<-table.element(a,'Time lag k',header=TRUE)
a<-table.element(a,hyperlink('basics.htm','PACF(k)','click here for more information about the Partial Autocorrelation Function'),header=TRUE)
a<-table.element(a,'T-STAT',header=TRUE)
a<-table.element(a,'P-value',header=TRUE)
a<-table.row.end(a)
for (i in 1:par1) {
a<-table.row.start(a)
a<-table.element(a,i,header=TRUE)
a<-table.element(a,round(mypacf[i],6))
mytstat <- mypacf[i]*sqrtn
a<-table.element(a,round(mytstat,4))
a<-table.element(a,round(1-pt(abs(mytstat),lengthx),6))
a<-table.row.end(a)
}
a<-table.end(a)
table.save(a,file='mytable1.tab')