Free Statistics

of Irreproducible Research!

Author's title

Author*The author of this computation has been verified*
R Software Modulerwasp_autocorrelation.wasp
Title produced by software(Partial) Autocorrelation Function
Date of computationThu, 26 Nov 2009 11:20:15 -0700
Cite this page as followsStatistical Computations at FreeStatistics.org, Office for Research Development and Education, URL https://freestatistics.org/blog/index.php?v=date/2009/Nov/26/t1259259836kz90fuubrwftafu.htm/, Retrieved Mon, 29 Apr 2024 01:48:07 +0000
Statistical Computations at FreeStatistics.org, Office for Research Development and Education, URL https://freestatistics.org/blog/index.php?pk=60227, Retrieved Mon, 29 Apr 2024 01:48:07 +0000
QR Codes:

Original text written by user:
IsPrivate?No (this computation is public)
User-defined keywords
Estimated Impact116
Family? (F = Feedback message, R = changed R code, M = changed R Module, P = changed Parameters, D = changed Data)
-     [Univariate Explorative Data Analysis] [Run Sequence gebo...] [2008-12-12 13:32:37] [76963dc1903f0f612b6153510a3818cf]
- R  D  [Univariate Explorative Data Analysis] [Run Sequence gebo...] [2008-12-17 12:14:40] [76963dc1903f0f612b6153510a3818cf]
-         [Univariate Explorative Data Analysis] [Run Sequence Plot...] [2008-12-22 18:19:51] [1ce0d16c8f4225c977b42c8fa93bc163]
- RMP       [(Partial) Autocorrelation Function] [Identifying Integ...] [2009-11-22 12:16:10] [b98453cac15ba1066b407e146608df68]
-   PD          [(Partial) Autocorrelation Function] [cs.shw.ws8.v1.2] [2009-11-26 18:20:15] [47f146dd9fb230449e079c6cbc92f5f5] [Current]
Feedback Forum

Post a new message
Dataseries X:
10570
10297
10635
10872
10296
10383
10431
10574
10653
10805
10872
10625
10407
10463
10556
10646
10702
11353
11346
11451
11964
12574
13031
13812
14544
14931
14886
16005
17064
15168
16050
15839
15137
14954
15648
15305
15579
16348
15928
16171
15937
15713
15594
15683
16438
17032
17696
17745
19394
20148
20108
18584
18441
18391
19178
18079
18483
19644
19195
19650


Summary of computational transaction
Raw Inputview raw input (R code)
Raw Outputview raw output of R engine
Computing time1 seconds
R Server'Gwilym Jenkins' @ 72.249.127.135

\begin{tabular}{lllllllll}
\hline
Summary of computational transaction \tabularnewline
Raw Input & view raw input (R code)  \tabularnewline
Raw Output & view raw output of R engine  \tabularnewline
Computing time & 1 seconds \tabularnewline
R Server & 'Gwilym Jenkins' @ 72.249.127.135 \tabularnewline
\hline
\end{tabular}
%Source: https://freestatistics.org/blog/index.php?pk=60227&T=0

[TABLE]
[ROW][C]Summary of computational transaction[/C][/ROW]
[ROW][C]Raw Input[/C][C]view raw input (R code) [/C][/ROW]
[ROW][C]Raw Output[/C][C]view raw output of R engine [/C][/ROW]
[ROW][C]Computing time[/C][C]1 seconds[/C][/ROW]
[ROW][C]R Server[/C][C]'Gwilym Jenkins' @ 72.249.127.135[/C][/ROW]
[/TABLE]
Source: https://freestatistics.org/blog/index.php?pk=60227&T=0

Globally Unique Identifier (entire table): ba.freestatistics.org/blog/index.php?pk=60227&T=0

As an alternative you can also use a QR Code:  

The GUIDs for individual cells are displayed in the table below:

Summary of computational transaction
Raw Inputview raw input (R code)
Raw Outputview raw output of R engine
Computing time1 seconds
R Server'Gwilym Jenkins' @ 72.249.127.135


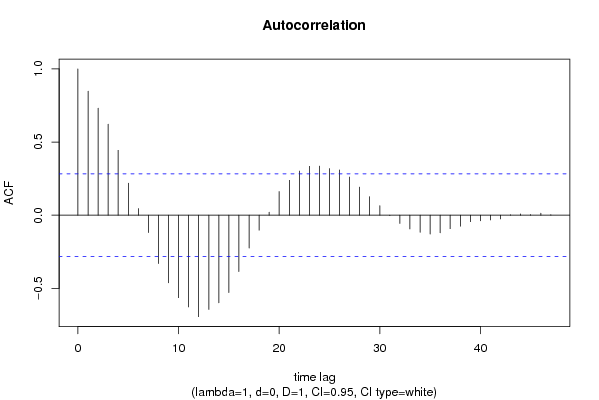
Autocorrelation Function
Time lag kACF(k)T-STATP-value
10.8477025.87310
20.7314225.06743e-06
30.6224.30934e-05
40.4439483.07580.001731
50.2192841.51920.067631
60.0455050.31530.376962
7-0.118714-0.82250.207436
8-0.330596-2.29040.013216
9-0.462258-3.20260.001209
10-0.563724-3.90560.000147
11-0.627341-4.34633.6e-05
12-0.693689-4.8068e-06
13-0.644805-4.46732.4e-05
14-0.599227-4.15166.7e-05
15-0.52884-3.66390.00031
16-0.385506-2.67090.005149
17-0.224572-1.55590.063153
18-0.102492-0.71010.240544
190.0209570.14520.442584
200.1618431.12130.133873
210.2387831.65430.052292
220.3014812.08870.02103
230.3342982.31610.012435
240.3355822.3250.012174
250.3192192.21160.015894
260.3094252.14380.018573
270.2605221.8050.038679
280.1920061.33030.09486
290.1265360.87670.192518
300.0649490.450.327374
31-0.002402-0.01660.493397
32-0.056678-0.39270.348149
33-0.093547-0.64810.260001
34-0.117106-0.81130.21059
35-0.128964-0.89350.188028
36-0.120266-0.83320.204423
37-0.092592-0.64150.262126
38-0.075434-0.52260.30182
39-0.044737-0.30990.378971
40-0.038352-0.26570.3958
41-0.032288-0.22370.411971
42-0.025785-0.17860.429485
430.0028150.01950.492261
440.0088310.06120.475733
450.0047670.0330.486896
460.0141650.09810.461115
470.0038770.02690.489342
48NANANA
49NANANA
50NANANA
51NANANA
52NANANA
53NANANA
54NANANA
55NANANA
56NANANA
57NANANA
58NANANA
59NANANA
60NANANA

\begin{tabular}{lllllllll}
\hline
Autocorrelation Function \tabularnewline
Time lag k & ACF(k) & T-STAT & P-value \tabularnewline
1 & 0.847702 & 5.8731 & 0 \tabularnewline
2 & 0.731422 & 5.0674 & 3e-06 \tabularnewline
3 & 0.622 & 4.3093 & 4e-05 \tabularnewline
4 & 0.443948 & 3.0758 & 0.001731 \tabularnewline
5 & 0.219284 & 1.5192 & 0.067631 \tabularnewline
6 & 0.045505 & 0.3153 & 0.376962 \tabularnewline
7 & -0.118714 & -0.8225 & 0.207436 \tabularnewline
8 & -0.330596 & -2.2904 & 0.013216 \tabularnewline
9 & -0.462258 & -3.2026 & 0.001209 \tabularnewline
10 & -0.563724 & -3.9056 & 0.000147 \tabularnewline
11 & -0.627341 & -4.3463 & 3.6e-05 \tabularnewline
12 & -0.693689 & -4.806 & 8e-06 \tabularnewline
13 & -0.644805 & -4.4673 & 2.4e-05 \tabularnewline
14 & -0.599227 & -4.1516 & 6.7e-05 \tabularnewline
15 & -0.52884 & -3.6639 & 0.00031 \tabularnewline
16 & -0.385506 & -2.6709 & 0.005149 \tabularnewline
17 & -0.224572 & -1.5559 & 0.063153 \tabularnewline
18 & -0.102492 & -0.7101 & 0.240544 \tabularnewline
19 & 0.020957 & 0.1452 & 0.442584 \tabularnewline
20 & 0.161843 & 1.1213 & 0.133873 \tabularnewline
21 & 0.238783 & 1.6543 & 0.052292 \tabularnewline
22 & 0.301481 & 2.0887 & 0.02103 \tabularnewline
23 & 0.334298 & 2.3161 & 0.012435 \tabularnewline
24 & 0.335582 & 2.325 & 0.012174 \tabularnewline
25 & 0.319219 & 2.2116 & 0.015894 \tabularnewline
26 & 0.309425 & 2.1438 & 0.018573 \tabularnewline
27 & 0.260522 & 1.805 & 0.038679 \tabularnewline
28 & 0.192006 & 1.3303 & 0.09486 \tabularnewline
29 & 0.126536 & 0.8767 & 0.192518 \tabularnewline
30 & 0.064949 & 0.45 & 0.327374 \tabularnewline
31 & -0.002402 & -0.0166 & 0.493397 \tabularnewline
32 & -0.056678 & -0.3927 & 0.348149 \tabularnewline
33 & -0.093547 & -0.6481 & 0.260001 \tabularnewline
34 & -0.117106 & -0.8113 & 0.21059 \tabularnewline
35 & -0.128964 & -0.8935 & 0.188028 \tabularnewline
36 & -0.120266 & -0.8332 & 0.204423 \tabularnewline
37 & -0.092592 & -0.6415 & 0.262126 \tabularnewline
38 & -0.075434 & -0.5226 & 0.30182 \tabularnewline
39 & -0.044737 & -0.3099 & 0.378971 \tabularnewline
40 & -0.038352 & -0.2657 & 0.3958 \tabularnewline
41 & -0.032288 & -0.2237 & 0.411971 \tabularnewline
42 & -0.025785 & -0.1786 & 0.429485 \tabularnewline
43 & 0.002815 & 0.0195 & 0.492261 \tabularnewline
44 & 0.008831 & 0.0612 & 0.475733 \tabularnewline
45 & 0.004767 & 0.033 & 0.486896 \tabularnewline
46 & 0.014165 & 0.0981 & 0.461115 \tabularnewline
47 & 0.003877 & 0.0269 & 0.489342 \tabularnewline
48 & NA & NA & NA \tabularnewline
49 & NA & NA & NA \tabularnewline
50 & NA & NA & NA \tabularnewline
51 & NA & NA & NA \tabularnewline
52 & NA & NA & NA \tabularnewline
53 & NA & NA & NA \tabularnewline
54 & NA & NA & NA \tabularnewline
55 & NA & NA & NA \tabularnewline
56 & NA & NA & NA \tabularnewline
57 & NA & NA & NA \tabularnewline
58 & NA & NA & NA \tabularnewline
59 & NA & NA & NA \tabularnewline
60 & NA & NA & NA \tabularnewline
\hline
\end{tabular}
%Source: https://freestatistics.org/blog/index.php?pk=60227&T=1

[TABLE]
[ROW][C]Autocorrelation Function[/C][/ROW]
[ROW][C]Time lag k[/C][C]ACF(k)[/C][C]T-STAT[/C][C]P-value[/C][/ROW]
[ROW][C]1[/C][C]0.847702[/C][C]5.8731[/C][C]0[/C][/ROW]
[ROW][C]2[/C][C]0.731422[/C][C]5.0674[/C][C]3e-06[/C][/ROW]
[ROW][C]3[/C][C]0.622[/C][C]4.3093[/C][C]4e-05[/C][/ROW]
[ROW][C]4[/C][C]0.443948[/C][C]3.0758[/C][C]0.001731[/C][/ROW]
[ROW][C]5[/C][C]0.219284[/C][C]1.5192[/C][C]0.067631[/C][/ROW]
[ROW][C]6[/C][C]0.045505[/C][C]0.3153[/C][C]0.376962[/C][/ROW]
[ROW][C]7[/C][C]-0.118714[/C][C]-0.8225[/C][C]0.207436[/C][/ROW]
[ROW][C]8[/C][C]-0.330596[/C][C]-2.2904[/C][C]0.013216[/C][/ROW]
[ROW][C]9[/C][C]-0.462258[/C][C]-3.2026[/C][C]0.001209[/C][/ROW]
[ROW][C]10[/C][C]-0.563724[/C][C]-3.9056[/C][C]0.000147[/C][/ROW]
[ROW][C]11[/C][C]-0.627341[/C][C]-4.3463[/C][C]3.6e-05[/C][/ROW]
[ROW][C]12[/C][C]-0.693689[/C][C]-4.806[/C][C]8e-06[/C][/ROW]
[ROW][C]13[/C][C]-0.644805[/C][C]-4.4673[/C][C]2.4e-05[/C][/ROW]
[ROW][C]14[/C][C]-0.599227[/C][C]-4.1516[/C][C]6.7e-05[/C][/ROW]
[ROW][C]15[/C][C]-0.52884[/C][C]-3.6639[/C][C]0.00031[/C][/ROW]
[ROW][C]16[/C][C]-0.385506[/C][C]-2.6709[/C][C]0.005149[/C][/ROW]
[ROW][C]17[/C][C]-0.224572[/C][C]-1.5559[/C][C]0.063153[/C][/ROW]
[ROW][C]18[/C][C]-0.102492[/C][C]-0.7101[/C][C]0.240544[/C][/ROW]
[ROW][C]19[/C][C]0.020957[/C][C]0.1452[/C][C]0.442584[/C][/ROW]
[ROW][C]20[/C][C]0.161843[/C][C]1.1213[/C][C]0.133873[/C][/ROW]
[ROW][C]21[/C][C]0.238783[/C][C]1.6543[/C][C]0.052292[/C][/ROW]
[ROW][C]22[/C][C]0.301481[/C][C]2.0887[/C][C]0.02103[/C][/ROW]
[ROW][C]23[/C][C]0.334298[/C][C]2.3161[/C][C]0.012435[/C][/ROW]
[ROW][C]24[/C][C]0.335582[/C][C]2.325[/C][C]0.012174[/C][/ROW]
[ROW][C]25[/C][C]0.319219[/C][C]2.2116[/C][C]0.015894[/C][/ROW]
[ROW][C]26[/C][C]0.309425[/C][C]2.1438[/C][C]0.018573[/C][/ROW]
[ROW][C]27[/C][C]0.260522[/C][C]1.805[/C][C]0.038679[/C][/ROW]
[ROW][C]28[/C][C]0.192006[/C][C]1.3303[/C][C]0.09486[/C][/ROW]
[ROW][C]29[/C][C]0.126536[/C][C]0.8767[/C][C]0.192518[/C][/ROW]
[ROW][C]30[/C][C]0.064949[/C][C]0.45[/C][C]0.327374[/C][/ROW]
[ROW][C]31[/C][C]-0.002402[/C][C]-0.0166[/C][C]0.493397[/C][/ROW]
[ROW][C]32[/C][C]-0.056678[/C][C]-0.3927[/C][C]0.348149[/C][/ROW]
[ROW][C]33[/C][C]-0.093547[/C][C]-0.6481[/C][C]0.260001[/C][/ROW]
[ROW][C]34[/C][C]-0.117106[/C][C]-0.8113[/C][C]0.21059[/C][/ROW]
[ROW][C]35[/C][C]-0.128964[/C][C]-0.8935[/C][C]0.188028[/C][/ROW]
[ROW][C]36[/C][C]-0.120266[/C][C]-0.8332[/C][C]0.204423[/C][/ROW]
[ROW][C]37[/C][C]-0.092592[/C][C]-0.6415[/C][C]0.262126[/C][/ROW]
[ROW][C]38[/C][C]-0.075434[/C][C]-0.5226[/C][C]0.30182[/C][/ROW]
[ROW][C]39[/C][C]-0.044737[/C][C]-0.3099[/C][C]0.378971[/C][/ROW]
[ROW][C]40[/C][C]-0.038352[/C][C]-0.2657[/C][C]0.3958[/C][/ROW]
[ROW][C]41[/C][C]-0.032288[/C][C]-0.2237[/C][C]0.411971[/C][/ROW]
[ROW][C]42[/C][C]-0.025785[/C][C]-0.1786[/C][C]0.429485[/C][/ROW]
[ROW][C]43[/C][C]0.002815[/C][C]0.0195[/C][C]0.492261[/C][/ROW]
[ROW][C]44[/C][C]0.008831[/C][C]0.0612[/C][C]0.475733[/C][/ROW]
[ROW][C]45[/C][C]0.004767[/C][C]0.033[/C][C]0.486896[/C][/ROW]
[ROW][C]46[/C][C]0.014165[/C][C]0.0981[/C][C]0.461115[/C][/ROW]
[ROW][C]47[/C][C]0.003877[/C][C]0.0269[/C][C]0.489342[/C][/ROW]
[ROW][C]48[/C][C]NA[/C][C]NA[/C][C]NA[/C][/ROW]
[ROW][C]49[/C][C]NA[/C][C]NA[/C][C]NA[/C][/ROW]
[ROW][C]50[/C][C]NA[/C][C]NA[/C][C]NA[/C][/ROW]
[ROW][C]51[/C][C]NA[/C][C]NA[/C][C]NA[/C][/ROW]
[ROW][C]52[/C][C]NA[/C][C]NA[/C][C]NA[/C][/ROW]
[ROW][C]53[/C][C]NA[/C][C]NA[/C][C]NA[/C][/ROW]
[ROW][C]54[/C][C]NA[/C][C]NA[/C][C]NA[/C][/ROW]
[ROW][C]55[/C][C]NA[/C][C]NA[/C][C]NA[/C][/ROW]
[ROW][C]56[/C][C]NA[/C][C]NA[/C][C]NA[/C][/ROW]
[ROW][C]57[/C][C]NA[/C][C]NA[/C][C]NA[/C][/ROW]
[ROW][C]58[/C][C]NA[/C][C]NA[/C][C]NA[/C][/ROW]
[ROW][C]59[/C][C]NA[/C][C]NA[/C][C]NA[/C][/ROW]
[ROW][C]60[/C][C]NA[/C][C]NA[/C][C]NA[/C][/ROW]
[/TABLE]
Source: https://freestatistics.org/blog/index.php?pk=60227&T=1

Globally Unique Identifier (entire table): ba.freestatistics.org/blog/index.php?pk=60227&T=1

As an alternative you can also use a QR Code:  

The GUIDs for individual cells are displayed in the table below:

Autocorrelation Function
Time lag kACF(k)T-STATP-value
10.8477025.87310
20.7314225.06743e-06
30.6224.30934e-05
40.4439483.07580.001731
50.2192841.51920.067631
60.0455050.31530.376962
7-0.118714-0.82250.207436
8-0.330596-2.29040.013216
9-0.462258-3.20260.001209
10-0.563724-3.90560.000147
11-0.627341-4.34633.6e-05
12-0.693689-4.8068e-06
13-0.644805-4.46732.4e-05
14-0.599227-4.15166.7e-05
15-0.52884-3.66390.00031
16-0.385506-2.67090.005149
17-0.224572-1.55590.063153
18-0.102492-0.71010.240544
190.0209570.14520.442584
200.1618431.12130.133873
210.2387831.65430.052292
220.3014812.08870.02103
230.3342982.31610.012435
240.3355822.3250.012174
250.3192192.21160.015894
260.3094252.14380.018573
270.2605221.8050.038679
280.1920061.33030.09486
290.1265360.87670.192518
300.0649490.450.327374
31-0.002402-0.01660.493397
32-0.056678-0.39270.348149
33-0.093547-0.64810.260001
34-0.117106-0.81130.21059
35-0.128964-0.89350.188028
36-0.120266-0.83320.204423
37-0.092592-0.64150.262126
38-0.075434-0.52260.30182
39-0.044737-0.30990.378971
40-0.038352-0.26570.3958
41-0.032288-0.22370.411971
42-0.025785-0.17860.429485
430.0028150.01950.492261
440.0088310.06120.475733
450.0047670.0330.486896
460.0141650.09810.461115
470.0038770.02690.489342
48NANANA
49NANANA
50NANANA
51NANANA
52NANANA
53NANANA
54NANANA
55NANANA
56NANANA
57NANANA
58NANANA
59NANANA
60NANANA


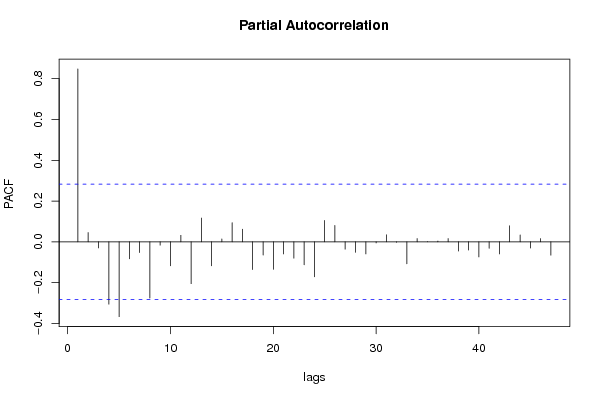
Partial Autocorrelation Function
Time lag kPACF(k)T-STATP-value
10.8477025.87310
20.0455660.31570.376803
3-0.02992-0.20730.418328
4-0.305869-2.11910.01964
5-0.36671-2.54060.007177
6-0.082882-0.57420.284248
7-0.052429-0.36320.35901
8-0.275637-1.90970.031081
9-0.016365-0.11340.455101
10-0.117644-0.81510.209532
110.0321510.22270.412338
12-0.204821-1.4190.081174
130.1167890.80910.211215
14-0.117586-0.81470.209646
150.0144520.10010.460329
160.0938450.65020.259339
170.0622790.43150.334024
18-0.13568-0.940.175957
19-0.065009-0.45040.327226
20-0.134664-0.9330.177749
21-0.059523-0.41240.340946
22-0.08003-0.55450.290918
23-0.112485-0.77930.219809
24-0.171349-1.18710.120507
250.1050510.72780.235131
260.0807430.55940.289243
27-0.036057-0.24980.401901
28-0.051035-0.35360.362599
29-0.059336-0.41110.341417
30-0.005373-0.03720.485229
310.0346870.24030.405555
32-0.002285-0.01580.493718
33-0.107475-0.74460.230069
340.0163920.11360.455027
350.0010540.00730.497101
360.003860.02670.489388
370.0162260.11240.455482
38-0.044922-0.31120.378488
39-0.040336-0.27950.390548
40-0.073888-0.51190.305531
41-0.031388-0.21750.414385
42-0.059404-0.41160.341245
430.0787350.54550.29397
440.0342080.2370.406833
45-0.030484-0.21120.416814
460.0164150.11370.454965
47-0.065285-0.45230.326543
48NANANA
49NANANA
50NANANA
51NANANA
52NANANA
53NANANA
54NANANA
55NANANA
56NANANA
57NANANA
58NANANA
59NANANA
60NANANA

\begin{tabular}{lllllllll}
\hline
Partial Autocorrelation Function \tabularnewline
Time lag k & PACF(k) & T-STAT & P-value \tabularnewline
1 & 0.847702 & 5.8731 & 0 \tabularnewline
2 & 0.045566 & 0.3157 & 0.376803 \tabularnewline
3 & -0.02992 & -0.2073 & 0.418328 \tabularnewline
4 & -0.305869 & -2.1191 & 0.01964 \tabularnewline
5 & -0.36671 & -2.5406 & 0.007177 \tabularnewline
6 & -0.082882 & -0.5742 & 0.284248 \tabularnewline
7 & -0.052429 & -0.3632 & 0.35901 \tabularnewline
8 & -0.275637 & -1.9097 & 0.031081 \tabularnewline
9 & -0.016365 & -0.1134 & 0.455101 \tabularnewline
10 & -0.117644 & -0.8151 & 0.209532 \tabularnewline
11 & 0.032151 & 0.2227 & 0.412338 \tabularnewline
12 & -0.204821 & -1.419 & 0.081174 \tabularnewline
13 & 0.116789 & 0.8091 & 0.211215 \tabularnewline
14 & -0.117586 & -0.8147 & 0.209646 \tabularnewline
15 & 0.014452 & 0.1001 & 0.460329 \tabularnewline
16 & 0.093845 & 0.6502 & 0.259339 \tabularnewline
17 & 0.062279 & 0.4315 & 0.334024 \tabularnewline
18 & -0.13568 & -0.94 & 0.175957 \tabularnewline
19 & -0.065009 & -0.4504 & 0.327226 \tabularnewline
20 & -0.134664 & -0.933 & 0.177749 \tabularnewline
21 & -0.059523 & -0.4124 & 0.340946 \tabularnewline
22 & -0.08003 & -0.5545 & 0.290918 \tabularnewline
23 & -0.112485 & -0.7793 & 0.219809 \tabularnewline
24 & -0.171349 & -1.1871 & 0.120507 \tabularnewline
25 & 0.105051 & 0.7278 & 0.235131 \tabularnewline
26 & 0.080743 & 0.5594 & 0.289243 \tabularnewline
27 & -0.036057 & -0.2498 & 0.401901 \tabularnewline
28 & -0.051035 & -0.3536 & 0.362599 \tabularnewline
29 & -0.059336 & -0.4111 & 0.341417 \tabularnewline
30 & -0.005373 & -0.0372 & 0.485229 \tabularnewline
31 & 0.034687 & 0.2403 & 0.405555 \tabularnewline
32 & -0.002285 & -0.0158 & 0.493718 \tabularnewline
33 & -0.107475 & -0.7446 & 0.230069 \tabularnewline
34 & 0.016392 & 0.1136 & 0.455027 \tabularnewline
35 & 0.001054 & 0.0073 & 0.497101 \tabularnewline
36 & 0.00386 & 0.0267 & 0.489388 \tabularnewline
37 & 0.016226 & 0.1124 & 0.455482 \tabularnewline
38 & -0.044922 & -0.3112 & 0.378488 \tabularnewline
39 & -0.040336 & -0.2795 & 0.390548 \tabularnewline
40 & -0.073888 & -0.5119 & 0.305531 \tabularnewline
41 & -0.031388 & -0.2175 & 0.414385 \tabularnewline
42 & -0.059404 & -0.4116 & 0.341245 \tabularnewline
43 & 0.078735 & 0.5455 & 0.29397 \tabularnewline
44 & 0.034208 & 0.237 & 0.406833 \tabularnewline
45 & -0.030484 & -0.2112 & 0.416814 \tabularnewline
46 & 0.016415 & 0.1137 & 0.454965 \tabularnewline
47 & -0.065285 & -0.4523 & 0.326543 \tabularnewline
48 & NA & NA & NA \tabularnewline
49 & NA & NA & NA \tabularnewline
50 & NA & NA & NA \tabularnewline
51 & NA & NA & NA \tabularnewline
52 & NA & NA & NA \tabularnewline
53 & NA & NA & NA \tabularnewline
54 & NA & NA & NA \tabularnewline
55 & NA & NA & NA \tabularnewline
56 & NA & NA & NA \tabularnewline
57 & NA & NA & NA \tabularnewline
58 & NA & NA & NA \tabularnewline
59 & NA & NA & NA \tabularnewline
60 & NA & NA & NA \tabularnewline
\hline
\end{tabular}
%Source: https://freestatistics.org/blog/index.php?pk=60227&T=2

[TABLE]
[ROW][C]Partial Autocorrelation Function[/C][/ROW]
[ROW][C]Time lag k[/C][C]PACF(k)[/C][C]T-STAT[/C][C]P-value[/C][/ROW]
[ROW][C]1[/C][C]0.847702[/C][C]5.8731[/C][C]0[/C][/ROW]
[ROW][C]2[/C][C]0.045566[/C][C]0.3157[/C][C]0.376803[/C][/ROW]
[ROW][C]3[/C][C]-0.02992[/C][C]-0.2073[/C][C]0.418328[/C][/ROW]
[ROW][C]4[/C][C]-0.305869[/C][C]-2.1191[/C][C]0.01964[/C][/ROW]
[ROW][C]5[/C][C]-0.36671[/C][C]-2.5406[/C][C]0.007177[/C][/ROW]
[ROW][C]6[/C][C]-0.082882[/C][C]-0.5742[/C][C]0.284248[/C][/ROW]
[ROW][C]7[/C][C]-0.052429[/C][C]-0.3632[/C][C]0.35901[/C][/ROW]
[ROW][C]8[/C][C]-0.275637[/C][C]-1.9097[/C][C]0.031081[/C][/ROW]
[ROW][C]9[/C][C]-0.016365[/C][C]-0.1134[/C][C]0.455101[/C][/ROW]
[ROW][C]10[/C][C]-0.117644[/C][C]-0.8151[/C][C]0.209532[/C][/ROW]
[ROW][C]11[/C][C]0.032151[/C][C]0.2227[/C][C]0.412338[/C][/ROW]
[ROW][C]12[/C][C]-0.204821[/C][C]-1.419[/C][C]0.081174[/C][/ROW]
[ROW][C]13[/C][C]0.116789[/C][C]0.8091[/C][C]0.211215[/C][/ROW]
[ROW][C]14[/C][C]-0.117586[/C][C]-0.8147[/C][C]0.209646[/C][/ROW]
[ROW][C]15[/C][C]0.014452[/C][C]0.1001[/C][C]0.460329[/C][/ROW]
[ROW][C]16[/C][C]0.093845[/C][C]0.6502[/C][C]0.259339[/C][/ROW]
[ROW][C]17[/C][C]0.062279[/C][C]0.4315[/C][C]0.334024[/C][/ROW]
[ROW][C]18[/C][C]-0.13568[/C][C]-0.94[/C][C]0.175957[/C][/ROW]
[ROW][C]19[/C][C]-0.065009[/C][C]-0.4504[/C][C]0.327226[/C][/ROW]
[ROW][C]20[/C][C]-0.134664[/C][C]-0.933[/C][C]0.177749[/C][/ROW]
[ROW][C]21[/C][C]-0.059523[/C][C]-0.4124[/C][C]0.340946[/C][/ROW]
[ROW][C]22[/C][C]-0.08003[/C][C]-0.5545[/C][C]0.290918[/C][/ROW]
[ROW][C]23[/C][C]-0.112485[/C][C]-0.7793[/C][C]0.219809[/C][/ROW]
[ROW][C]24[/C][C]-0.171349[/C][C]-1.1871[/C][C]0.120507[/C][/ROW]
[ROW][C]25[/C][C]0.105051[/C][C]0.7278[/C][C]0.235131[/C][/ROW]
[ROW][C]26[/C][C]0.080743[/C][C]0.5594[/C][C]0.289243[/C][/ROW]
[ROW][C]27[/C][C]-0.036057[/C][C]-0.2498[/C][C]0.401901[/C][/ROW]
[ROW][C]28[/C][C]-0.051035[/C][C]-0.3536[/C][C]0.362599[/C][/ROW]
[ROW][C]29[/C][C]-0.059336[/C][C]-0.4111[/C][C]0.341417[/C][/ROW]
[ROW][C]30[/C][C]-0.005373[/C][C]-0.0372[/C][C]0.485229[/C][/ROW]
[ROW][C]31[/C][C]0.034687[/C][C]0.2403[/C][C]0.405555[/C][/ROW]
[ROW][C]32[/C][C]-0.002285[/C][C]-0.0158[/C][C]0.493718[/C][/ROW]
[ROW][C]33[/C][C]-0.107475[/C][C]-0.7446[/C][C]0.230069[/C][/ROW]
[ROW][C]34[/C][C]0.016392[/C][C]0.1136[/C][C]0.455027[/C][/ROW]
[ROW][C]35[/C][C]0.001054[/C][C]0.0073[/C][C]0.497101[/C][/ROW]
[ROW][C]36[/C][C]0.00386[/C][C]0.0267[/C][C]0.489388[/C][/ROW]
[ROW][C]37[/C][C]0.016226[/C][C]0.1124[/C][C]0.455482[/C][/ROW]
[ROW][C]38[/C][C]-0.044922[/C][C]-0.3112[/C][C]0.378488[/C][/ROW]
[ROW][C]39[/C][C]-0.040336[/C][C]-0.2795[/C][C]0.390548[/C][/ROW]
[ROW][C]40[/C][C]-0.073888[/C][C]-0.5119[/C][C]0.305531[/C][/ROW]
[ROW][C]41[/C][C]-0.031388[/C][C]-0.2175[/C][C]0.414385[/C][/ROW]
[ROW][C]42[/C][C]-0.059404[/C][C]-0.4116[/C][C]0.341245[/C][/ROW]
[ROW][C]43[/C][C]0.078735[/C][C]0.5455[/C][C]0.29397[/C][/ROW]
[ROW][C]44[/C][C]0.034208[/C][C]0.237[/C][C]0.406833[/C][/ROW]
[ROW][C]45[/C][C]-0.030484[/C][C]-0.2112[/C][C]0.416814[/C][/ROW]
[ROW][C]46[/C][C]0.016415[/C][C]0.1137[/C][C]0.454965[/C][/ROW]
[ROW][C]47[/C][C]-0.065285[/C][C]-0.4523[/C][C]0.326543[/C][/ROW]
[ROW][C]48[/C][C]NA[/C][C]NA[/C][C]NA[/C][/ROW]
[ROW][C]49[/C][C]NA[/C][C]NA[/C][C]NA[/C][/ROW]
[ROW][C]50[/C][C]NA[/C][C]NA[/C][C]NA[/C][/ROW]
[ROW][C]51[/C][C]NA[/C][C]NA[/C][C]NA[/C][/ROW]
[ROW][C]52[/C][C]NA[/C][C]NA[/C][C]NA[/C][/ROW]
[ROW][C]53[/C][C]NA[/C][C]NA[/C][C]NA[/C][/ROW]
[ROW][C]54[/C][C]NA[/C][C]NA[/C][C]NA[/C][/ROW]
[ROW][C]55[/C][C]NA[/C][C]NA[/C][C]NA[/C][/ROW]
[ROW][C]56[/C][C]NA[/C][C]NA[/C][C]NA[/C][/ROW]
[ROW][C]57[/C][C]NA[/C][C]NA[/C][C]NA[/C][/ROW]
[ROW][C]58[/C][C]NA[/C][C]NA[/C][C]NA[/C][/ROW]
[ROW][C]59[/C][C]NA[/C][C]NA[/C][C]NA[/C][/ROW]
[ROW][C]60[/C][C]NA[/C][C]NA[/C][C]NA[/C][/ROW]
[/TABLE]
Source: https://freestatistics.org/blog/index.php?pk=60227&T=2

Globally Unique Identifier (entire table): ba.freestatistics.org/blog/index.php?pk=60227&T=2

As an alternative you can also use a QR Code:  

The GUIDs for individual cells are displayed in the table below:

Partial Autocorrelation Function
Time lag kPACF(k)T-STATP-value
10.8477025.87310
20.0455660.31570.376803
3-0.02992-0.20730.418328
4-0.305869-2.11910.01964
5-0.36671-2.54060.007177
6-0.082882-0.57420.284248
7-0.052429-0.36320.35901
8-0.275637-1.90970.031081
9-0.016365-0.11340.455101
10-0.117644-0.81510.209532
110.0321510.22270.412338
12-0.204821-1.4190.081174
130.1167890.80910.211215
14-0.117586-0.81470.209646
150.0144520.10010.460329
160.0938450.65020.259339
170.0622790.43150.334024
18-0.13568-0.940.175957
19-0.065009-0.45040.327226
20-0.134664-0.9330.177749
21-0.059523-0.41240.340946
22-0.08003-0.55450.290918
23-0.112485-0.77930.219809
24-0.171349-1.18710.120507
250.1050510.72780.235131
260.0807430.55940.289243
27-0.036057-0.24980.401901
28-0.051035-0.35360.362599
29-0.059336-0.41110.341417
30-0.005373-0.03720.485229
310.0346870.24030.405555
32-0.002285-0.01580.493718
33-0.107475-0.74460.230069
340.0163920.11360.455027
350.0010540.00730.497101
360.003860.02670.489388
370.0162260.11240.455482
38-0.044922-0.31120.378488
39-0.040336-0.27950.390548
40-0.073888-0.51190.305531
41-0.031388-0.21750.414385
42-0.059404-0.41160.341245
430.0787350.54550.29397
440.0342080.2370.406833
45-0.030484-0.21120.416814
460.0164150.11370.454965
47-0.065285-0.45230.326543
48NANANA
49NANANA
50NANANA
51NANANA
52NANANA
53NANANA
54NANANA
55NANANA
56NANANA
57NANANA
58NANANA
59NANANA
60NANANA


Parameters (Session):
par1 = 60 ; par2 = 1 ; par3 = 0 ; par4 = 1 ; par5 = 12 ; par6 = White Noise ; par7 = 0.95 ;
Parameters (R input):
par1 = 60 ; par2 = 1 ; par3 = 0 ; par4 = 1 ; par5 = 12 ; par6 = White Noise ; par7 = 0.95 ;
R code (references can be found in the software module):
if (par1 == 'Default') {
par1 = 10*log10(length(x))
} else {
par1 <- as.numeric(par1)
}
par2 <- as.numeric(par2)
par3 <- as.numeric(par3)
par4 <- as.numeric(par4)
par5 <- as.numeric(par5)
if (par6 == 'White Noise') par6 <- 'white' else par6 <- 'ma'
par7 <- as.numeric(par7)
if (par2 == 0) {
x <- log(x)
} else {
x <- (x ^ par2 - 1) / par2
}
if (par3 > 0) x <- diff(x,lag=1,difference=par3)
if (par4 > 0) x <- diff(x,lag=par5,difference=par4)
bitmap(file='pic1.png')
racf <- acf(x, par1, main='Autocorrelation', xlab='time lag', ylab='ACF', ci.type=par6, ci=par7, sub=paste('(lambda=',par2,', d=',par3,', D=',par4,', CI=', par7, ', CI type=',par6,')',sep=''))
dev.off()
bitmap(file='pic2.png')
rpacf <- pacf(x,par1,main='Partial Autocorrelation',xlab='lags',ylab='PACF')
dev.off()
(myacf <- c(racf$acf))
(mypacf <- c(rpacf$acf))
lengthx <- length(x)
sqrtn <- sqrt(lengthx)
load(file='createtable')
a<-table.start()
a<-table.row.start(a)
a<-table.element(a,'Autocorrelation Function',4,TRUE)
a<-table.row.end(a)
a<-table.row.start(a)
a<-table.element(a,'Time lag k',header=TRUE)
a<-table.element(a,hyperlink('basics.htm','ACF(k)','click here for more information about the Autocorrelation Function'),header=TRUE)
a<-table.element(a,'T-STAT',header=TRUE)
a<-table.element(a,'P-value',header=TRUE)
a<-table.row.end(a)
for (i in 2:(par1+1)) {
a<-table.row.start(a)
a<-table.element(a,i-1,header=TRUE)
a<-table.element(a,round(myacf[i],6))
mytstat <- myacf[i]*sqrtn
a<-table.element(a,round(mytstat,4))
a<-table.element(a,round(1-pt(abs(mytstat),lengthx),6))
a<-table.row.end(a)
}
a<-table.end(a)
table.save(a,file='mytable.tab')
a<-table.start()
a<-table.row.start(a)
a<-table.element(a,'Partial Autocorrelation Function',4,TRUE)
a<-table.row.end(a)
a<-table.row.start(a)
a<-table.element(a,'Time lag k',header=TRUE)
a<-table.element(a,hyperlink('basics.htm','PACF(k)','click here for more information about the Partial Autocorrelation Function'),header=TRUE)
a<-table.element(a,'T-STAT',header=TRUE)
a<-table.element(a,'P-value',header=TRUE)
a<-table.row.end(a)
for (i in 1:par1) {
a<-table.row.start(a)
a<-table.element(a,i,header=TRUE)
a<-table.element(a,round(mypacf[i],6))
mytstat <- mypacf[i]*sqrtn
a<-table.element(a,round(mytstat,4))
a<-table.element(a,round(1-pt(abs(mytstat),lengthx),6))
a<-table.row.end(a)
}
a<-table.end(a)
table.save(a,file='mytable1.tab')