Free Statistics

of Irreproducible Research!

Author's title

Author*The author of this computation has been verified*
R Software Modulerwasp_autocorrelation.wasp
Title produced by software(Partial) Autocorrelation Function
Date of computationThu, 26 Nov 2009 11:24:00 -0700
Cite this page as followsStatistical Computations at FreeStatistics.org, Office for Research Development and Education, URL https://freestatistics.org/blog/index.php?v=date/2009/Nov/26/t1259259926j9qeocep5loxpcr.htm/, Retrieved Mon, 29 Apr 2024 01:22:02 +0000
Statistical Computations at FreeStatistics.org, Office for Research Development and Education, URL https://freestatistics.org/blog/index.php?pk=60232, Retrieved Mon, 29 Apr 2024 01:22:02 +0000
QR Codes:

Original text written by user:
IsPrivate?No (this computation is public)
User-defined keywordsd=0 D=0 tijdreeks: aantal bouwvergunningen
Estimated Impact99
Family? (F = Feedback message, R = changed R code, M = changed R Module, P = changed Parameters, D = changed Data)
-     [Univariate Explorative Data Analysis] [Run Sequence gebo...] [2008-12-12 13:32:37] [76963dc1903f0f612b6153510a3818cf]
- R  D  [Univariate Explorative Data Analysis] [Run Sequence gebo...] [2008-12-17 12:14:40] [76963dc1903f0f612b6153510a3818cf]
-         [Univariate Explorative Data Analysis] [Run Sequence Plot...] [2008-12-22 18:19:51] [1ce0d16c8f4225c977b42c8fa93bc163]
- RMP       [(Partial) Autocorrelation Function] [Identifying Integ...] [2009-11-22 12:16:10] [b98453cac15ba1066b407e146608df68]
- R  D          [(Partial) Autocorrelation Function] [autocorr. functie] [2009-11-26 18:24:00] [03368d751914a6c247d86aff8eac7cbf] [Current]
Feedback Forum

Post a new message
Dataseries X:
2465
1932
1993
2243
1758
1806
2063
1823
2137
2428
2139
2265
2615
2070
2794
2190
2434
2520
2063
2068
2537
1898
2139
2408
2725
2201
2311
2548
2276
2351
2280
2057
2479
2379
2295
2456
2546
2844
2260
2981
2678
3440
2842
2450
2669
2570
2540
2318
2930
2946
2799
2695
2498
2260
2160
2058
2533
2150
2172
2155
3016


Summary of computational transaction
Raw Inputview raw input (R code)
Raw Outputview raw output of R engine
Computing time1 seconds
R Server'Gwilym Jenkins' @ 72.249.127.135

\begin{tabular}{lllllllll}
\hline
Summary of computational transaction \tabularnewline
Raw Input & view raw input (R code)  \tabularnewline
Raw Output & view raw output of R engine  \tabularnewline
Computing time & 1 seconds \tabularnewline
R Server & 'Gwilym Jenkins' @ 72.249.127.135 \tabularnewline
\hline
\end{tabular}
%Source: https://freestatistics.org/blog/index.php?pk=60232&T=0

[TABLE]
[ROW][C]Summary of computational transaction[/C][/ROW]
[ROW][C]Raw Input[/C][C]view raw input (R code) [/C][/ROW]
[ROW][C]Raw Output[/C][C]view raw output of R engine [/C][/ROW]
[ROW][C]Computing time[/C][C]1 seconds[/C][/ROW]
[ROW][C]R Server[/C][C]'Gwilym Jenkins' @ 72.249.127.135[/C][/ROW]
[/TABLE]
Source: https://freestatistics.org/blog/index.php?pk=60232&T=0

Globally Unique Identifier (entire table): ba.freestatistics.org/blog/index.php?pk=60232&T=0

As an alternative you can also use a QR Code:  

The GUIDs for individual cells are displayed in the table below:

Summary of computational transaction
Raw Inputview raw input (R code)
Raw Outputview raw output of R engine
Computing time1 seconds
R Server'Gwilym Jenkins' @ 72.249.127.135


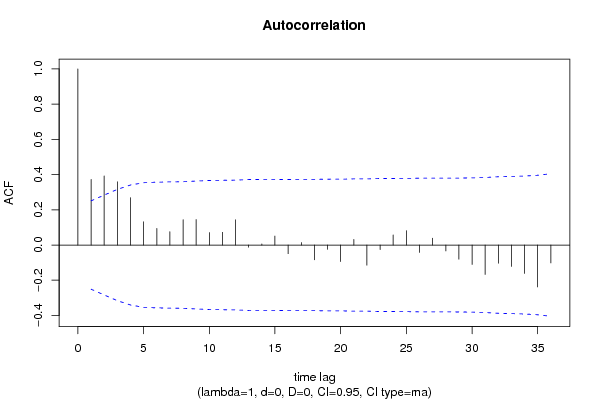
Autocorrelation Function
Time lag kACF(k)T-STATP-value
10.3724432.90890.002527
20.3925543.06590.001616
30.3591812.80530.003368
40.2689682.10070.019904
50.1315321.02730.154169
60.0944480.73770.231774
70.0754250.58910.278989
80.143851.12350.132813
90.1442781.12690.13211
100.070910.55380.29086
110.07230.56470.287179
120.1433251.11940.133678
13-0.012282-0.09590.461946
140.0063450.04960.480319
150.0509030.39760.34617
16-0.049201-0.38430.351056
170.0139870.10920.456684
18-0.08388-0.65510.257425
19-0.024666-0.19260.423937
20-0.093918-0.73350.233025
210.031420.24540.403486
22-0.114579-0.89490.187182
23-0.025559-0.19960.421221
240.0573350.44780.327942
250.0812150.63430.264125
26-0.041876-0.32710.37237
270.038640.30180.381921
28-0.033318-0.26020.397784
29-0.080661-0.630.265529
30-0.110539-0.86330.195668
31-0.167508-1.30830.097843
32-0.103072-0.8050.211967
33-0.121391-0.94810.173412
34-0.161416-1.26070.10611
35-0.238178-1.86020.033838
36-0.101706-0.79430.215036

\begin{tabular}{lllllllll}
\hline
Autocorrelation Function \tabularnewline
Time lag k & ACF(k) & T-STAT & P-value \tabularnewline
1 & 0.372443 & 2.9089 & 0.002527 \tabularnewline
2 & 0.392554 & 3.0659 & 0.001616 \tabularnewline
3 & 0.359181 & 2.8053 & 0.003368 \tabularnewline
4 & 0.268968 & 2.1007 & 0.019904 \tabularnewline
5 & 0.131532 & 1.0273 & 0.154169 \tabularnewline
6 & 0.094448 & 0.7377 & 0.231774 \tabularnewline
7 & 0.075425 & 0.5891 & 0.278989 \tabularnewline
8 & 0.14385 & 1.1235 & 0.132813 \tabularnewline
9 & 0.144278 & 1.1269 & 0.13211 \tabularnewline
10 & 0.07091 & 0.5538 & 0.29086 \tabularnewline
11 & 0.0723 & 0.5647 & 0.287179 \tabularnewline
12 & 0.143325 & 1.1194 & 0.133678 \tabularnewline
13 & -0.012282 & -0.0959 & 0.461946 \tabularnewline
14 & 0.006345 & 0.0496 & 0.480319 \tabularnewline
15 & 0.050903 & 0.3976 & 0.34617 \tabularnewline
16 & -0.049201 & -0.3843 & 0.351056 \tabularnewline
17 & 0.013987 & 0.1092 & 0.456684 \tabularnewline
18 & -0.08388 & -0.6551 & 0.257425 \tabularnewline
19 & -0.024666 & -0.1926 & 0.423937 \tabularnewline
20 & -0.093918 & -0.7335 & 0.233025 \tabularnewline
21 & 0.03142 & 0.2454 & 0.403486 \tabularnewline
22 & -0.114579 & -0.8949 & 0.187182 \tabularnewline
23 & -0.025559 & -0.1996 & 0.421221 \tabularnewline
24 & 0.057335 & 0.4478 & 0.327942 \tabularnewline
25 & 0.081215 & 0.6343 & 0.264125 \tabularnewline
26 & -0.041876 & -0.3271 & 0.37237 \tabularnewline
27 & 0.03864 & 0.3018 & 0.381921 \tabularnewline
28 & -0.033318 & -0.2602 & 0.397784 \tabularnewline
29 & -0.080661 & -0.63 & 0.265529 \tabularnewline
30 & -0.110539 & -0.8633 & 0.195668 \tabularnewline
31 & -0.167508 & -1.3083 & 0.097843 \tabularnewline
32 & -0.103072 & -0.805 & 0.211967 \tabularnewline
33 & -0.121391 & -0.9481 & 0.173412 \tabularnewline
34 & -0.161416 & -1.2607 & 0.10611 \tabularnewline
35 & -0.238178 & -1.8602 & 0.033838 \tabularnewline
36 & -0.101706 & -0.7943 & 0.215036 \tabularnewline
\hline
\end{tabular}
%Source: https://freestatistics.org/blog/index.php?pk=60232&T=1

[TABLE]
[ROW][C]Autocorrelation Function[/C][/ROW]
[ROW][C]Time lag k[/C][C]ACF(k)[/C][C]T-STAT[/C][C]P-value[/C][/ROW]
[ROW][C]1[/C][C]0.372443[/C][C]2.9089[/C][C]0.002527[/C][/ROW]
[ROW][C]2[/C][C]0.392554[/C][C]3.0659[/C][C]0.001616[/C][/ROW]
[ROW][C]3[/C][C]0.359181[/C][C]2.8053[/C][C]0.003368[/C][/ROW]
[ROW][C]4[/C][C]0.268968[/C][C]2.1007[/C][C]0.019904[/C][/ROW]
[ROW][C]5[/C][C]0.131532[/C][C]1.0273[/C][C]0.154169[/C][/ROW]
[ROW][C]6[/C][C]0.094448[/C][C]0.7377[/C][C]0.231774[/C][/ROW]
[ROW][C]7[/C][C]0.075425[/C][C]0.5891[/C][C]0.278989[/C][/ROW]
[ROW][C]8[/C][C]0.14385[/C][C]1.1235[/C][C]0.132813[/C][/ROW]
[ROW][C]9[/C][C]0.144278[/C][C]1.1269[/C][C]0.13211[/C][/ROW]
[ROW][C]10[/C][C]0.07091[/C][C]0.5538[/C][C]0.29086[/C][/ROW]
[ROW][C]11[/C][C]0.0723[/C][C]0.5647[/C][C]0.287179[/C][/ROW]
[ROW][C]12[/C][C]0.143325[/C][C]1.1194[/C][C]0.133678[/C][/ROW]
[ROW][C]13[/C][C]-0.012282[/C][C]-0.0959[/C][C]0.461946[/C][/ROW]
[ROW][C]14[/C][C]0.006345[/C][C]0.0496[/C][C]0.480319[/C][/ROW]
[ROW][C]15[/C][C]0.050903[/C][C]0.3976[/C][C]0.34617[/C][/ROW]
[ROW][C]16[/C][C]-0.049201[/C][C]-0.3843[/C][C]0.351056[/C][/ROW]
[ROW][C]17[/C][C]0.013987[/C][C]0.1092[/C][C]0.456684[/C][/ROW]
[ROW][C]18[/C][C]-0.08388[/C][C]-0.6551[/C][C]0.257425[/C][/ROW]
[ROW][C]19[/C][C]-0.024666[/C][C]-0.1926[/C][C]0.423937[/C][/ROW]
[ROW][C]20[/C][C]-0.093918[/C][C]-0.7335[/C][C]0.233025[/C][/ROW]
[ROW][C]21[/C][C]0.03142[/C][C]0.2454[/C][C]0.403486[/C][/ROW]
[ROW][C]22[/C][C]-0.114579[/C][C]-0.8949[/C][C]0.187182[/C][/ROW]
[ROW][C]23[/C][C]-0.025559[/C][C]-0.1996[/C][C]0.421221[/C][/ROW]
[ROW][C]24[/C][C]0.057335[/C][C]0.4478[/C][C]0.327942[/C][/ROW]
[ROW][C]25[/C][C]0.081215[/C][C]0.6343[/C][C]0.264125[/C][/ROW]
[ROW][C]26[/C][C]-0.041876[/C][C]-0.3271[/C][C]0.37237[/C][/ROW]
[ROW][C]27[/C][C]0.03864[/C][C]0.3018[/C][C]0.381921[/C][/ROW]
[ROW][C]28[/C][C]-0.033318[/C][C]-0.2602[/C][C]0.397784[/C][/ROW]
[ROW][C]29[/C][C]-0.080661[/C][C]-0.63[/C][C]0.265529[/C][/ROW]
[ROW][C]30[/C][C]-0.110539[/C][C]-0.8633[/C][C]0.195668[/C][/ROW]
[ROW][C]31[/C][C]-0.167508[/C][C]-1.3083[/C][C]0.097843[/C][/ROW]
[ROW][C]32[/C][C]-0.103072[/C][C]-0.805[/C][C]0.211967[/C][/ROW]
[ROW][C]33[/C][C]-0.121391[/C][C]-0.9481[/C][C]0.173412[/C][/ROW]
[ROW][C]34[/C][C]-0.161416[/C][C]-1.2607[/C][C]0.10611[/C][/ROW]
[ROW][C]35[/C][C]-0.238178[/C][C]-1.8602[/C][C]0.033838[/C][/ROW]
[ROW][C]36[/C][C]-0.101706[/C][C]-0.7943[/C][C]0.215036[/C][/ROW]
[/TABLE]
Source: https://freestatistics.org/blog/index.php?pk=60232&T=1

Globally Unique Identifier (entire table): ba.freestatistics.org/blog/index.php?pk=60232&T=1

As an alternative you can also use a QR Code:  

The GUIDs for individual cells are displayed in the table below:

Autocorrelation Function
Time lag kACF(k)T-STATP-value
10.3724432.90890.002527
20.3925543.06590.001616
30.3591812.80530.003368
40.2689682.10070.019904
50.1315321.02730.154169
60.0944480.73770.231774
70.0754250.58910.278989
80.143851.12350.132813
90.1442781.12690.13211
100.070910.55380.29086
110.07230.56470.287179
120.1433251.11940.133678
13-0.012282-0.09590.461946
140.0063450.04960.480319
150.0509030.39760.34617
16-0.049201-0.38430.351056
170.0139870.10920.456684
18-0.08388-0.65510.257425
19-0.024666-0.19260.423937
20-0.093918-0.73350.233025
210.031420.24540.403486
22-0.114579-0.89490.187182
23-0.025559-0.19960.421221
240.0573350.44780.327942
250.0812150.63430.264125
26-0.041876-0.32710.37237
270.038640.30180.381921
28-0.033318-0.26020.397784
29-0.080661-0.630.265529
30-0.110539-0.86330.195668
31-0.167508-1.30830.097843
32-0.103072-0.8050.211967
33-0.121391-0.94810.173412
34-0.161416-1.26070.10611
35-0.238178-1.86020.033838
36-0.101706-0.79430.215036


Partial Autocorrelation Function
Time lag kPACF(k)T-STATP-value
10.3724432.90890.002527
20.2947222.30190.012386
30.1860191.45290.075695
40.0375590.29330.385127
5-0.120593-0.94190.174989
6-0.074404-0.58110.281653
70.0034120.02660.489415
80.1611761.25880.106445
90.1317411.02890.153788
10-0.057463-0.44880.327583
11-0.091847-0.71740.237948
120.052840.41270.340638
13-0.102744-0.80250.212703
14-0.00144-0.01120.495533
150.0905320.70710.241106
16-0.080958-0.63230.264776
170.0239190.18680.426213
18-0.125664-0.98150.16512
190.0162160.12670.449816
20-0.072715-0.56790.286087
210.1557141.21620.114303
22-0.073729-0.57580.283419
23-0.002577-0.02010.492005
240.0991450.77430.220858
250.1277380.99770.161191
26-0.138148-1.0790.142424
27-0.036055-0.28160.389602
28-0.069646-0.5440.294229
29-0.114159-0.89160.188052
300.010460.08170.467577
31-0.055873-0.43640.332051
320.0513850.40130.34479
33-0.087006-0.67950.249685
34-0.062892-0.49120.312524
35-0.213735-1.66930.050089
360.0145250.11340.455025

\begin{tabular}{lllllllll}
\hline
Partial Autocorrelation Function \tabularnewline
Time lag k & PACF(k) & T-STAT & P-value \tabularnewline
1 & 0.372443 & 2.9089 & 0.002527 \tabularnewline
2 & 0.294722 & 2.3019 & 0.012386 \tabularnewline
3 & 0.186019 & 1.4529 & 0.075695 \tabularnewline
4 & 0.037559 & 0.2933 & 0.385127 \tabularnewline
5 & -0.120593 & -0.9419 & 0.174989 \tabularnewline
6 & -0.074404 & -0.5811 & 0.281653 \tabularnewline
7 & 0.003412 & 0.0266 & 0.489415 \tabularnewline
8 & 0.161176 & 1.2588 & 0.106445 \tabularnewline
9 & 0.131741 & 1.0289 & 0.153788 \tabularnewline
10 & -0.057463 & -0.4488 & 0.327583 \tabularnewline
11 & -0.091847 & -0.7174 & 0.237948 \tabularnewline
12 & 0.05284 & 0.4127 & 0.340638 \tabularnewline
13 & -0.102744 & -0.8025 & 0.212703 \tabularnewline
14 & -0.00144 & -0.0112 & 0.495533 \tabularnewline
15 & 0.090532 & 0.7071 & 0.241106 \tabularnewline
16 & -0.080958 & -0.6323 & 0.264776 \tabularnewline
17 & 0.023919 & 0.1868 & 0.426213 \tabularnewline
18 & -0.125664 & -0.9815 & 0.16512 \tabularnewline
19 & 0.016216 & 0.1267 & 0.449816 \tabularnewline
20 & -0.072715 & -0.5679 & 0.286087 \tabularnewline
21 & 0.155714 & 1.2162 & 0.114303 \tabularnewline
22 & -0.073729 & -0.5758 & 0.283419 \tabularnewline
23 & -0.002577 & -0.0201 & 0.492005 \tabularnewline
24 & 0.099145 & 0.7743 & 0.220858 \tabularnewline
25 & 0.127738 & 0.9977 & 0.161191 \tabularnewline
26 & -0.138148 & -1.079 & 0.142424 \tabularnewline
27 & -0.036055 & -0.2816 & 0.389602 \tabularnewline
28 & -0.069646 & -0.544 & 0.294229 \tabularnewline
29 & -0.114159 & -0.8916 & 0.188052 \tabularnewline
30 & 0.01046 & 0.0817 & 0.467577 \tabularnewline
31 & -0.055873 & -0.4364 & 0.332051 \tabularnewline
32 & 0.051385 & 0.4013 & 0.34479 \tabularnewline
33 & -0.087006 & -0.6795 & 0.249685 \tabularnewline
34 & -0.062892 & -0.4912 & 0.312524 \tabularnewline
35 & -0.213735 & -1.6693 & 0.050089 \tabularnewline
36 & 0.014525 & 0.1134 & 0.455025 \tabularnewline
\hline
\end{tabular}
%Source: https://freestatistics.org/blog/index.php?pk=60232&T=2

[TABLE]
[ROW][C]Partial Autocorrelation Function[/C][/ROW]
[ROW][C]Time lag k[/C][C]PACF(k)[/C][C]T-STAT[/C][C]P-value[/C][/ROW]
[ROW][C]1[/C][C]0.372443[/C][C]2.9089[/C][C]0.002527[/C][/ROW]
[ROW][C]2[/C][C]0.294722[/C][C]2.3019[/C][C]0.012386[/C][/ROW]
[ROW][C]3[/C][C]0.186019[/C][C]1.4529[/C][C]0.075695[/C][/ROW]
[ROW][C]4[/C][C]0.037559[/C][C]0.2933[/C][C]0.385127[/C][/ROW]
[ROW][C]5[/C][C]-0.120593[/C][C]-0.9419[/C][C]0.174989[/C][/ROW]
[ROW][C]6[/C][C]-0.074404[/C][C]-0.5811[/C][C]0.281653[/C][/ROW]
[ROW][C]7[/C][C]0.003412[/C][C]0.0266[/C][C]0.489415[/C][/ROW]
[ROW][C]8[/C][C]0.161176[/C][C]1.2588[/C][C]0.106445[/C][/ROW]
[ROW][C]9[/C][C]0.131741[/C][C]1.0289[/C][C]0.153788[/C][/ROW]
[ROW][C]10[/C][C]-0.057463[/C][C]-0.4488[/C][C]0.327583[/C][/ROW]
[ROW][C]11[/C][C]-0.091847[/C][C]-0.7174[/C][C]0.237948[/C][/ROW]
[ROW][C]12[/C][C]0.05284[/C][C]0.4127[/C][C]0.340638[/C][/ROW]
[ROW][C]13[/C][C]-0.102744[/C][C]-0.8025[/C][C]0.212703[/C][/ROW]
[ROW][C]14[/C][C]-0.00144[/C][C]-0.0112[/C][C]0.495533[/C][/ROW]
[ROW][C]15[/C][C]0.090532[/C][C]0.7071[/C][C]0.241106[/C][/ROW]
[ROW][C]16[/C][C]-0.080958[/C][C]-0.6323[/C][C]0.264776[/C][/ROW]
[ROW][C]17[/C][C]0.023919[/C][C]0.1868[/C][C]0.426213[/C][/ROW]
[ROW][C]18[/C][C]-0.125664[/C][C]-0.9815[/C][C]0.16512[/C][/ROW]
[ROW][C]19[/C][C]0.016216[/C][C]0.1267[/C][C]0.449816[/C][/ROW]
[ROW][C]20[/C][C]-0.072715[/C][C]-0.5679[/C][C]0.286087[/C][/ROW]
[ROW][C]21[/C][C]0.155714[/C][C]1.2162[/C][C]0.114303[/C][/ROW]
[ROW][C]22[/C][C]-0.073729[/C][C]-0.5758[/C][C]0.283419[/C][/ROW]
[ROW][C]23[/C][C]-0.002577[/C][C]-0.0201[/C][C]0.492005[/C][/ROW]
[ROW][C]24[/C][C]0.099145[/C][C]0.7743[/C][C]0.220858[/C][/ROW]
[ROW][C]25[/C][C]0.127738[/C][C]0.9977[/C][C]0.161191[/C][/ROW]
[ROW][C]26[/C][C]-0.138148[/C][C]-1.079[/C][C]0.142424[/C][/ROW]
[ROW][C]27[/C][C]-0.036055[/C][C]-0.2816[/C][C]0.389602[/C][/ROW]
[ROW][C]28[/C][C]-0.069646[/C][C]-0.544[/C][C]0.294229[/C][/ROW]
[ROW][C]29[/C][C]-0.114159[/C][C]-0.8916[/C][C]0.188052[/C][/ROW]
[ROW][C]30[/C][C]0.01046[/C][C]0.0817[/C][C]0.467577[/C][/ROW]
[ROW][C]31[/C][C]-0.055873[/C][C]-0.4364[/C][C]0.332051[/C][/ROW]
[ROW][C]32[/C][C]0.051385[/C][C]0.4013[/C][C]0.34479[/C][/ROW]
[ROW][C]33[/C][C]-0.087006[/C][C]-0.6795[/C][C]0.249685[/C][/ROW]
[ROW][C]34[/C][C]-0.062892[/C][C]-0.4912[/C][C]0.312524[/C][/ROW]
[ROW][C]35[/C][C]-0.213735[/C][C]-1.6693[/C][C]0.050089[/C][/ROW]
[ROW][C]36[/C][C]0.014525[/C][C]0.1134[/C][C]0.455025[/C][/ROW]
[/TABLE]
Source: https://freestatistics.org/blog/index.php?pk=60232&T=2

Globally Unique Identifier (entire table): ba.freestatistics.org/blog/index.php?pk=60232&T=2

As an alternative you can also use a QR Code:  

The GUIDs for individual cells are displayed in the table below:

Partial Autocorrelation Function
Time lag kPACF(k)T-STATP-value
10.3724432.90890.002527
20.2947222.30190.012386
30.1860191.45290.075695
40.0375590.29330.385127
5-0.120593-0.94190.174989
6-0.074404-0.58110.281653
70.0034120.02660.489415
80.1611761.25880.106445
90.1317411.02890.153788
10-0.057463-0.44880.327583
11-0.091847-0.71740.237948
120.052840.41270.340638
13-0.102744-0.80250.212703
14-0.00144-0.01120.495533
150.0905320.70710.241106
16-0.080958-0.63230.264776
170.0239190.18680.426213
18-0.125664-0.98150.16512
190.0162160.12670.449816
20-0.072715-0.56790.286087
210.1557141.21620.114303
22-0.073729-0.57580.283419
23-0.002577-0.02010.492005
240.0991450.77430.220858
250.1277380.99770.161191
26-0.138148-1.0790.142424
27-0.036055-0.28160.389602
28-0.069646-0.5440.294229
29-0.114159-0.89160.188052
300.010460.08170.467577
31-0.055873-0.43640.332051
320.0513850.40130.34479
33-0.087006-0.67950.249685
34-0.062892-0.49120.312524
35-0.213735-1.66930.050089
360.0145250.11340.455025


Parameters (Session):
par1 = 36 ; par2 = 1 ; par3 = 0 ; par4 = 0 ; par5 = 12 ; par6 = MA ; par7 = 0.95 ;
Parameters (R input):
par1 = 36 ; par2 = 1 ; par3 = 0 ; par4 = 0 ; par5 = 12 ; par6 = MA ; par7 = 0.95 ;
R code (references can be found in the software module):
if (par1 == 'Default') {
par1 = 10*log10(length(x))
} else {
par1 <- as.numeric(par1)
}
par2 <- as.numeric(par2)
par3 <- as.numeric(par3)
par4 <- as.numeric(par4)
par5 <- as.numeric(par5)
if (par6 == 'White Noise') par6 <- 'white' else par6 <- 'ma'
par7 <- as.numeric(par7)
if (par2 == 0) {
x <- log(x)
} else {
x <- (x ^ par2 - 1) / par2
}
if (par3 > 0) x <- diff(x,lag=1,difference=par3)
if (par4 > 0) x <- diff(x,lag=par5,difference=par4)
bitmap(file='pic1.png')
racf <- acf(x, par1, main='Autocorrelation', xlab='time lag', ylab='ACF', ci.type=par6, ci=par7, sub=paste('(lambda=',par2,', d=',par3,', D=',par4,', CI=', par7, ', CI type=',par6,')',sep=''))
dev.off()
bitmap(file='pic2.png')
rpacf <- pacf(x,par1,main='Partial Autocorrelation',xlab='lags',ylab='PACF')
dev.off()
(myacf <- c(racf$acf))
(mypacf <- c(rpacf$acf))
lengthx <- length(x)
sqrtn <- sqrt(lengthx)
load(file='createtable')
a<-table.start()
a<-table.row.start(a)
a<-table.element(a,'Autocorrelation Function',4,TRUE)
a<-table.row.end(a)
a<-table.row.start(a)
a<-table.element(a,'Time lag k',header=TRUE)
a<-table.element(a,hyperlink('basics.htm','ACF(k)','click here for more information about the Autocorrelation Function'),header=TRUE)
a<-table.element(a,'T-STAT',header=TRUE)
a<-table.element(a,'P-value',header=TRUE)
a<-table.row.end(a)
for (i in 2:(par1+1)) {
a<-table.row.start(a)
a<-table.element(a,i-1,header=TRUE)
a<-table.element(a,round(myacf[i],6))
mytstat <- myacf[i]*sqrtn
a<-table.element(a,round(mytstat,4))
a<-table.element(a,round(1-pt(abs(mytstat),lengthx),6))
a<-table.row.end(a)
}
a<-table.end(a)
table.save(a,file='mytable.tab')
a<-table.start()
a<-table.row.start(a)
a<-table.element(a,'Partial Autocorrelation Function',4,TRUE)
a<-table.row.end(a)
a<-table.row.start(a)
a<-table.element(a,'Time lag k',header=TRUE)
a<-table.element(a,hyperlink('basics.htm','PACF(k)','click here for more information about the Partial Autocorrelation Function'),header=TRUE)
a<-table.element(a,'T-STAT',header=TRUE)
a<-table.element(a,'P-value',header=TRUE)
a<-table.row.end(a)
for (i in 1:par1) {
a<-table.row.start(a)
a<-table.element(a,i,header=TRUE)
a<-table.element(a,round(mypacf[i],6))
mytstat <- mypacf[i]*sqrtn
a<-table.element(a,round(mytstat,4))
a<-table.element(a,round(1-pt(abs(mytstat),lengthx),6))
a<-table.row.end(a)
}
a<-table.end(a)
table.save(a,file='mytable1.tab')