Free Statistics

of Irreproducible Research!

Author's title

Author*The author of this computation has been verified*
R Software Modulerwasp_autocorrelation.wasp
Title produced by software(Partial) Autocorrelation Function
Date of computationThu, 26 Nov 2009 11:34:10 -0700
Cite this page as followsStatistical Computations at FreeStatistics.org, Office for Research Development and Education, URL https://freestatistics.org/blog/index.php?v=date/2009/Nov/26/t12592606197ofyyx4h4385ax9.htm/, Retrieved Sun, 28 Apr 2024 21:42:25 +0000
Statistical Computations at FreeStatistics.org, Office for Research Development and Education, URL https://freestatistics.org/blog/index.php?pk=60252, Retrieved Sun, 28 Apr 2024 21:42:25 +0000
QR Codes:

Original text written by user:
IsPrivate?No (this computation is public)
User-defined keywords
Estimated Impact119
Family? (F = Feedback message, R = changed R code, M = changed R Module, P = changed Parameters, D = changed Data)
-     [Univariate Explorative Data Analysis] [Run Sequence gebo...] [2008-12-12 13:32:37] [76963dc1903f0f612b6153510a3818cf]
- R  D  [Univariate Explorative Data Analysis] [Run Sequence gebo...] [2008-12-17 12:14:40] [76963dc1903f0f612b6153510a3818cf]
-         [Univariate Explorative Data Analysis] [Run Sequence Plot...] [2008-12-22 18:19:51] [1ce0d16c8f4225c977b42c8fa93bc163]
- RMP       [(Partial) Autocorrelation Function] [Identifying Integ...] [2009-11-22 12:16:10] [b98453cac15ba1066b407e146608df68]
-   PD          [(Partial) Autocorrelation Function] [cs.shw.ws8.v1.3] [2009-11-26 18:34:10] [47f146dd9fb230449e079c6cbc92f5f5] [Current]
Feedback Forum

Post a new message
Dataseries X:
10570
10297
10635
10872
10296
10383
10431
10574
10653
10805
10872
10625
10407
10463
10556
10646
10702
11353
11346
11451
11964
12574
13031
13812
14544
14931
14886
16005
17064
15168
16050
15839
15137
14954
15648
15305
15579
16348
15928
16171
15937
15713
15594
15683
16438
17032
17696
17745
19394
20148
20108
18584
18441
18391
19178
18079
18483
19644
19195
19650


Summary of computational transaction
Raw Inputview raw input (R code)
Raw Outputview raw output of R engine
Computing time1 seconds
R Server'Gwilym Jenkins' @ 72.249.127.135

\begin{tabular}{lllllllll}
\hline
Summary of computational transaction \tabularnewline
Raw Input & view raw input (R code)  \tabularnewline
Raw Output & view raw output of R engine  \tabularnewline
Computing time & 1 seconds \tabularnewline
R Server & 'Gwilym Jenkins' @ 72.249.127.135 \tabularnewline
\hline
\end{tabular}
%Source: https://freestatistics.org/blog/index.php?pk=60252&T=0

[TABLE]
[ROW][C]Summary of computational transaction[/C][/ROW]
[ROW][C]Raw Input[/C][C]view raw input (R code) [/C][/ROW]
[ROW][C]Raw Output[/C][C]view raw output of R engine [/C][/ROW]
[ROW][C]Computing time[/C][C]1 seconds[/C][/ROW]
[ROW][C]R Server[/C][C]'Gwilym Jenkins' @ 72.249.127.135[/C][/ROW]
[/TABLE]
Source: https://freestatistics.org/blog/index.php?pk=60252&T=0

Globally Unique Identifier (entire table): ba.freestatistics.org/blog/index.php?pk=60252&T=0

As an alternative you can also use a QR Code:  

The GUIDs for individual cells are displayed in the table below:

Summary of computational transaction
Raw Inputview raw input (R code)
Raw Outputview raw output of R engine
Computing time1 seconds
R Server'Gwilym Jenkins' @ 72.249.127.135


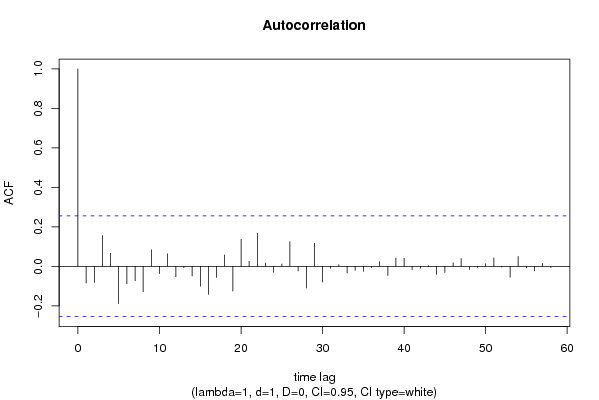
Autocorrelation Function
Time lag kACF(k)T-STATP-value
1-0.084606-0.64990.259148
2-0.081544-0.62630.266751
30.1564091.20140.117198
40.0663580.50970.306081
5-0.18876-1.44990.076191
6-0.088691-0.68120.24919
7-0.073622-0.56550.28694
8-0.128472-0.98680.163882
90.0837680.64340.261219
10-0.036623-0.28130.38973
110.0629450.48350.315268
12-0.052466-0.4030.344202
13-0.00718-0.05520.478102
14-0.048932-0.37590.354187
15-0.101087-0.77650.220289
16-0.142251-1.09270.139494
17-0.056263-0.43220.3336
180.0575630.44210.329999
19-0.12552-0.96410.169455
200.1364561.04810.149424
210.0251970.19350.423599
220.1679871.29030.100984
230.0172820.13270.447422
24-0.02986-0.22940.409692
250.011320.08690.465503
260.1246540.95750.171115
27-0.02383-0.1830.427697
28-0.109878-0.8440.201043
290.1164710.89460.187309
30-0.079953-0.61410.270745
31-0.01043-0.08010.468208
320.0084590.0650.474208
33-0.033882-0.26020.397789
34-0.020601-0.15820.437403
35-0.026262-0.20170.420415
36-0.005746-0.04410.482474
370.0239460.18390.42735
38-0.046212-0.3550.361942
390.0418820.32170.374409
400.041180.31630.376442
41-0.016556-0.12720.449619
42-0.009871-0.07580.469909
430.0028290.02170.491367
44-0.041558-0.31920.375346
45-0.030867-0.23710.406702
460.0176280.13540.446377
470.0393130.3020.381868
48-0.015862-0.12180.451722
49-0.005305-0.04070.483817
500.0126370.09710.461501
510.0423630.32540.373016
52-0.004152-0.03190.487332
53-0.055754-0.42830.335014
540.0501040.38490.350863
55-0.008835-0.06790.473062
56-0.023835-0.18310.427682
570.0144520.1110.455994
58-0.005939-0.04560.481886
59NANANA
60NANANA

\begin{tabular}{lllllllll}
\hline
Autocorrelation Function \tabularnewline
Time lag k & ACF(k) & T-STAT & P-value \tabularnewline
1 & -0.084606 & -0.6499 & 0.259148 \tabularnewline
2 & -0.081544 & -0.6263 & 0.266751 \tabularnewline
3 & 0.156409 & 1.2014 & 0.117198 \tabularnewline
4 & 0.066358 & 0.5097 & 0.306081 \tabularnewline
5 & -0.18876 & -1.4499 & 0.076191 \tabularnewline
6 & -0.088691 & -0.6812 & 0.24919 \tabularnewline
7 & -0.073622 & -0.5655 & 0.28694 \tabularnewline
8 & -0.128472 & -0.9868 & 0.163882 \tabularnewline
9 & 0.083768 & 0.6434 & 0.261219 \tabularnewline
10 & -0.036623 & -0.2813 & 0.38973 \tabularnewline
11 & 0.062945 & 0.4835 & 0.315268 \tabularnewline
12 & -0.052466 & -0.403 & 0.344202 \tabularnewline
13 & -0.00718 & -0.0552 & 0.478102 \tabularnewline
14 & -0.048932 & -0.3759 & 0.354187 \tabularnewline
15 & -0.101087 & -0.7765 & 0.220289 \tabularnewline
16 & -0.142251 & -1.0927 & 0.139494 \tabularnewline
17 & -0.056263 & -0.4322 & 0.3336 \tabularnewline
18 & 0.057563 & 0.4421 & 0.329999 \tabularnewline
19 & -0.12552 & -0.9641 & 0.169455 \tabularnewline
20 & 0.136456 & 1.0481 & 0.149424 \tabularnewline
21 & 0.025197 & 0.1935 & 0.423599 \tabularnewline
22 & 0.167987 & 1.2903 & 0.100984 \tabularnewline
23 & 0.017282 & 0.1327 & 0.447422 \tabularnewline
24 & -0.02986 & -0.2294 & 0.409692 \tabularnewline
25 & 0.01132 & 0.0869 & 0.465503 \tabularnewline
26 & 0.124654 & 0.9575 & 0.171115 \tabularnewline
27 & -0.02383 & -0.183 & 0.427697 \tabularnewline
28 & -0.109878 & -0.844 & 0.201043 \tabularnewline
29 & 0.116471 & 0.8946 & 0.187309 \tabularnewline
30 & -0.079953 & -0.6141 & 0.270745 \tabularnewline
31 & -0.01043 & -0.0801 & 0.468208 \tabularnewline
32 & 0.008459 & 0.065 & 0.474208 \tabularnewline
33 & -0.033882 & -0.2602 & 0.397789 \tabularnewline
34 & -0.020601 & -0.1582 & 0.437403 \tabularnewline
35 & -0.026262 & -0.2017 & 0.420415 \tabularnewline
36 & -0.005746 & -0.0441 & 0.482474 \tabularnewline
37 & 0.023946 & 0.1839 & 0.42735 \tabularnewline
38 & -0.046212 & -0.355 & 0.361942 \tabularnewline
39 & 0.041882 & 0.3217 & 0.374409 \tabularnewline
40 & 0.04118 & 0.3163 & 0.376442 \tabularnewline
41 & -0.016556 & -0.1272 & 0.449619 \tabularnewline
42 & -0.009871 & -0.0758 & 0.469909 \tabularnewline
43 & 0.002829 & 0.0217 & 0.491367 \tabularnewline
44 & -0.041558 & -0.3192 & 0.375346 \tabularnewline
45 & -0.030867 & -0.2371 & 0.406702 \tabularnewline
46 & 0.017628 & 0.1354 & 0.446377 \tabularnewline
47 & 0.039313 & 0.302 & 0.381868 \tabularnewline
48 & -0.015862 & -0.1218 & 0.451722 \tabularnewline
49 & -0.005305 & -0.0407 & 0.483817 \tabularnewline
50 & 0.012637 & 0.0971 & 0.461501 \tabularnewline
51 & 0.042363 & 0.3254 & 0.373016 \tabularnewline
52 & -0.004152 & -0.0319 & 0.487332 \tabularnewline
53 & -0.055754 & -0.4283 & 0.335014 \tabularnewline
54 & 0.050104 & 0.3849 & 0.350863 \tabularnewline
55 & -0.008835 & -0.0679 & 0.473062 \tabularnewline
56 & -0.023835 & -0.1831 & 0.427682 \tabularnewline
57 & 0.014452 & 0.111 & 0.455994 \tabularnewline
58 & -0.005939 & -0.0456 & 0.481886 \tabularnewline
59 & NA & NA & NA \tabularnewline
60 & NA & NA & NA \tabularnewline
\hline
\end{tabular}
%Source: https://freestatistics.org/blog/index.php?pk=60252&T=1

[TABLE]
[ROW][C]Autocorrelation Function[/C][/ROW]
[ROW][C]Time lag k[/C][C]ACF(k)[/C][C]T-STAT[/C][C]P-value[/C][/ROW]
[ROW][C]1[/C][C]-0.084606[/C][C]-0.6499[/C][C]0.259148[/C][/ROW]
[ROW][C]2[/C][C]-0.081544[/C][C]-0.6263[/C][C]0.266751[/C][/ROW]
[ROW][C]3[/C][C]0.156409[/C][C]1.2014[/C][C]0.117198[/C][/ROW]
[ROW][C]4[/C][C]0.066358[/C][C]0.5097[/C][C]0.306081[/C][/ROW]
[ROW][C]5[/C][C]-0.18876[/C][C]-1.4499[/C][C]0.076191[/C][/ROW]
[ROW][C]6[/C][C]-0.088691[/C][C]-0.6812[/C][C]0.24919[/C][/ROW]
[ROW][C]7[/C][C]-0.073622[/C][C]-0.5655[/C][C]0.28694[/C][/ROW]
[ROW][C]8[/C][C]-0.128472[/C][C]-0.9868[/C][C]0.163882[/C][/ROW]
[ROW][C]9[/C][C]0.083768[/C][C]0.6434[/C][C]0.261219[/C][/ROW]
[ROW][C]10[/C][C]-0.036623[/C][C]-0.2813[/C][C]0.38973[/C][/ROW]
[ROW][C]11[/C][C]0.062945[/C][C]0.4835[/C][C]0.315268[/C][/ROW]
[ROW][C]12[/C][C]-0.052466[/C][C]-0.403[/C][C]0.344202[/C][/ROW]
[ROW][C]13[/C][C]-0.00718[/C][C]-0.0552[/C][C]0.478102[/C][/ROW]
[ROW][C]14[/C][C]-0.048932[/C][C]-0.3759[/C][C]0.354187[/C][/ROW]
[ROW][C]15[/C][C]-0.101087[/C][C]-0.7765[/C][C]0.220289[/C][/ROW]
[ROW][C]16[/C][C]-0.142251[/C][C]-1.0927[/C][C]0.139494[/C][/ROW]
[ROW][C]17[/C][C]-0.056263[/C][C]-0.4322[/C][C]0.3336[/C][/ROW]
[ROW][C]18[/C][C]0.057563[/C][C]0.4421[/C][C]0.329999[/C][/ROW]
[ROW][C]19[/C][C]-0.12552[/C][C]-0.9641[/C][C]0.169455[/C][/ROW]
[ROW][C]20[/C][C]0.136456[/C][C]1.0481[/C][C]0.149424[/C][/ROW]
[ROW][C]21[/C][C]0.025197[/C][C]0.1935[/C][C]0.423599[/C][/ROW]
[ROW][C]22[/C][C]0.167987[/C][C]1.2903[/C][C]0.100984[/C][/ROW]
[ROW][C]23[/C][C]0.017282[/C][C]0.1327[/C][C]0.447422[/C][/ROW]
[ROW][C]24[/C][C]-0.02986[/C][C]-0.2294[/C][C]0.409692[/C][/ROW]
[ROW][C]25[/C][C]0.01132[/C][C]0.0869[/C][C]0.465503[/C][/ROW]
[ROW][C]26[/C][C]0.124654[/C][C]0.9575[/C][C]0.171115[/C][/ROW]
[ROW][C]27[/C][C]-0.02383[/C][C]-0.183[/C][C]0.427697[/C][/ROW]
[ROW][C]28[/C][C]-0.109878[/C][C]-0.844[/C][C]0.201043[/C][/ROW]
[ROW][C]29[/C][C]0.116471[/C][C]0.8946[/C][C]0.187309[/C][/ROW]
[ROW][C]30[/C][C]-0.079953[/C][C]-0.6141[/C][C]0.270745[/C][/ROW]
[ROW][C]31[/C][C]-0.01043[/C][C]-0.0801[/C][C]0.468208[/C][/ROW]
[ROW][C]32[/C][C]0.008459[/C][C]0.065[/C][C]0.474208[/C][/ROW]
[ROW][C]33[/C][C]-0.033882[/C][C]-0.2602[/C][C]0.397789[/C][/ROW]
[ROW][C]34[/C][C]-0.020601[/C][C]-0.1582[/C][C]0.437403[/C][/ROW]
[ROW][C]35[/C][C]-0.026262[/C][C]-0.2017[/C][C]0.420415[/C][/ROW]
[ROW][C]36[/C][C]-0.005746[/C][C]-0.0441[/C][C]0.482474[/C][/ROW]
[ROW][C]37[/C][C]0.023946[/C][C]0.1839[/C][C]0.42735[/C][/ROW]
[ROW][C]38[/C][C]-0.046212[/C][C]-0.355[/C][C]0.361942[/C][/ROW]
[ROW][C]39[/C][C]0.041882[/C][C]0.3217[/C][C]0.374409[/C][/ROW]
[ROW][C]40[/C][C]0.04118[/C][C]0.3163[/C][C]0.376442[/C][/ROW]
[ROW][C]41[/C][C]-0.016556[/C][C]-0.1272[/C][C]0.449619[/C][/ROW]
[ROW][C]42[/C][C]-0.009871[/C][C]-0.0758[/C][C]0.469909[/C][/ROW]
[ROW][C]43[/C][C]0.002829[/C][C]0.0217[/C][C]0.491367[/C][/ROW]
[ROW][C]44[/C][C]-0.041558[/C][C]-0.3192[/C][C]0.375346[/C][/ROW]
[ROW][C]45[/C][C]-0.030867[/C][C]-0.2371[/C][C]0.406702[/C][/ROW]
[ROW][C]46[/C][C]0.017628[/C][C]0.1354[/C][C]0.446377[/C][/ROW]
[ROW][C]47[/C][C]0.039313[/C][C]0.302[/C][C]0.381868[/C][/ROW]
[ROW][C]48[/C][C]-0.015862[/C][C]-0.1218[/C][C]0.451722[/C][/ROW]
[ROW][C]49[/C][C]-0.005305[/C][C]-0.0407[/C][C]0.483817[/C][/ROW]
[ROW][C]50[/C][C]0.012637[/C][C]0.0971[/C][C]0.461501[/C][/ROW]
[ROW][C]51[/C][C]0.042363[/C][C]0.3254[/C][C]0.373016[/C][/ROW]
[ROW][C]52[/C][C]-0.004152[/C][C]-0.0319[/C][C]0.487332[/C][/ROW]
[ROW][C]53[/C][C]-0.055754[/C][C]-0.4283[/C][C]0.335014[/C][/ROW]
[ROW][C]54[/C][C]0.050104[/C][C]0.3849[/C][C]0.350863[/C][/ROW]
[ROW][C]55[/C][C]-0.008835[/C][C]-0.0679[/C][C]0.473062[/C][/ROW]
[ROW][C]56[/C][C]-0.023835[/C][C]-0.1831[/C][C]0.427682[/C][/ROW]
[ROW][C]57[/C][C]0.014452[/C][C]0.111[/C][C]0.455994[/C][/ROW]
[ROW][C]58[/C][C]-0.005939[/C][C]-0.0456[/C][C]0.481886[/C][/ROW]
[ROW][C]59[/C][C]NA[/C][C]NA[/C][C]NA[/C][/ROW]
[ROW][C]60[/C][C]NA[/C][C]NA[/C][C]NA[/C][/ROW]
[/TABLE]
Source: https://freestatistics.org/blog/index.php?pk=60252&T=1

Globally Unique Identifier (entire table): ba.freestatistics.org/blog/index.php?pk=60252&T=1

As an alternative you can also use a QR Code:  

The GUIDs for individual cells are displayed in the table below:

Autocorrelation Function
Time lag kACF(k)T-STATP-value
1-0.084606-0.64990.259148
2-0.081544-0.62630.266751
30.1564091.20140.117198
40.0663580.50970.306081
5-0.18876-1.44990.076191
6-0.088691-0.68120.24919
7-0.073622-0.56550.28694
8-0.128472-0.98680.163882
90.0837680.64340.261219
10-0.036623-0.28130.38973
110.0629450.48350.315268
12-0.052466-0.4030.344202
13-0.00718-0.05520.478102
14-0.048932-0.37590.354187
15-0.101087-0.77650.220289
16-0.142251-1.09270.139494
17-0.056263-0.43220.3336
180.0575630.44210.329999
19-0.12552-0.96410.169455
200.1364561.04810.149424
210.0251970.19350.423599
220.1679871.29030.100984
230.0172820.13270.447422
24-0.02986-0.22940.409692
250.011320.08690.465503
260.1246540.95750.171115
27-0.02383-0.1830.427697
28-0.109878-0.8440.201043
290.1164710.89460.187309
30-0.079953-0.61410.270745
31-0.01043-0.08010.468208
320.0084590.0650.474208
33-0.033882-0.26020.397789
34-0.020601-0.15820.437403
35-0.026262-0.20170.420415
36-0.005746-0.04410.482474
370.0239460.18390.42735
38-0.046212-0.3550.361942
390.0418820.32170.374409
400.041180.31630.376442
41-0.016556-0.12720.449619
42-0.009871-0.07580.469909
430.0028290.02170.491367
44-0.041558-0.31920.375346
45-0.030867-0.23710.406702
460.0176280.13540.446377
470.0393130.3020.381868
48-0.015862-0.12180.451722
49-0.005305-0.04070.483817
500.0126370.09710.461501
510.0423630.32540.373016
52-0.004152-0.03190.487332
53-0.055754-0.42830.335014
540.0501040.38490.350863
55-0.008835-0.06790.473062
56-0.023835-0.18310.427682
570.0144520.1110.455994
58-0.005939-0.04560.481886
59NANANA
60NANANA


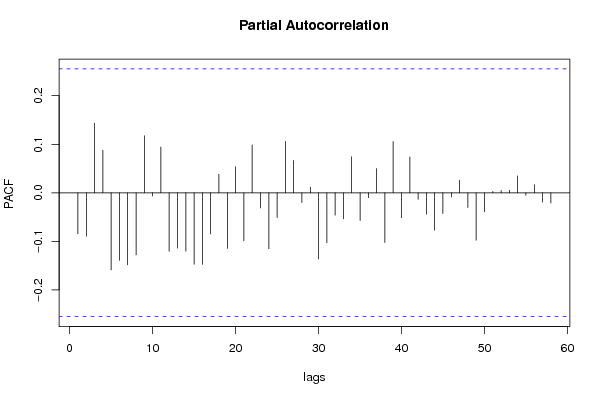
Partial Autocorrelation Function
Time lag kPACF(k)T-STATP-value
1-0.084606-0.64990.259148
2-0.089341-0.68620.247623
30.1434991.10220.137417
40.0878070.67450.251326
5-0.158902-1.22050.113556
6-0.138984-1.06760.145035
7-0.148379-1.13970.129504
8-0.128072-0.98370.164631
90.1174780.90240.185266
10-0.006411-0.04920.480446
110.0941850.72340.236131
12-0.120494-0.92550.17923
13-0.11389-0.87480.192613
14-0.120299-0.9240.179615
15-0.147338-1.13170.131165
16-0.147338-1.13170.131164
17-0.08472-0.65070.258868
180.0380160.2920.385653
19-0.114684-0.88090.190971
200.0535590.41140.341136
21-0.098885-0.75950.225275
220.0986050.75740.225911
23-0.031125-0.23910.405938
24-0.115378-0.88620.189545
25-0.050777-0.390.348961
260.1059320.81370.209551
270.0666330.51180.305344
28-0.020227-0.15540.438531
290.0115810.0890.464709
30-0.13617-1.04590.149927
31-0.103113-0.7920.215759
32-0.046022-0.35350.362486
33-0.053561-0.41140.341132
340.0742720.57050.285255
35-0.056945-0.43740.331709
36-0.009978-0.07660.469583
370.050050.38440.351018
38-0.102643-0.78840.216806
390.1057780.81250.209886
40-0.051483-0.39540.34697
410.0740020.56840.285954
42-0.013511-0.10380.458847
43-0.044095-0.33870.36802
44-0.076908-0.59070.278475
45-0.042432-0.32590.372816
46-0.00879-0.06750.473199
470.0260640.20020.421005
48-0.030032-0.23070.409181
49-0.097742-0.75080.227887
50-0.039149-0.30070.382346
510.0027790.02130.49152
520.0045690.03510.486061
530.0053540.04110.483667
540.0346350.2660.395568
55-0.005121-0.03930.484378
560.0167210.12840.44912
57-0.019173-0.14730.441711
58-0.020919-0.16070.436446
59NANANA
60NANANA

\begin{tabular}{lllllllll}
\hline
Partial Autocorrelation Function \tabularnewline
Time lag k & PACF(k) & T-STAT & P-value \tabularnewline
1 & -0.084606 & -0.6499 & 0.259148 \tabularnewline
2 & -0.089341 & -0.6862 & 0.247623 \tabularnewline
3 & 0.143499 & 1.1022 & 0.137417 \tabularnewline
4 & 0.087807 & 0.6745 & 0.251326 \tabularnewline
5 & -0.158902 & -1.2205 & 0.113556 \tabularnewline
6 & -0.138984 & -1.0676 & 0.145035 \tabularnewline
7 & -0.148379 & -1.1397 & 0.129504 \tabularnewline
8 & -0.128072 & -0.9837 & 0.164631 \tabularnewline
9 & 0.117478 & 0.9024 & 0.185266 \tabularnewline
10 & -0.006411 & -0.0492 & 0.480446 \tabularnewline
11 & 0.094185 & 0.7234 & 0.236131 \tabularnewline
12 & -0.120494 & -0.9255 & 0.17923 \tabularnewline
13 & -0.11389 & -0.8748 & 0.192613 \tabularnewline
14 & -0.120299 & -0.924 & 0.179615 \tabularnewline
15 & -0.147338 & -1.1317 & 0.131165 \tabularnewline
16 & -0.147338 & -1.1317 & 0.131164 \tabularnewline
17 & -0.08472 & -0.6507 & 0.258868 \tabularnewline
18 & 0.038016 & 0.292 & 0.385653 \tabularnewline
19 & -0.114684 & -0.8809 & 0.190971 \tabularnewline
20 & 0.053559 & 0.4114 & 0.341136 \tabularnewline
21 & -0.098885 & -0.7595 & 0.225275 \tabularnewline
22 & 0.098605 & 0.7574 & 0.225911 \tabularnewline
23 & -0.031125 & -0.2391 & 0.405938 \tabularnewline
24 & -0.115378 & -0.8862 & 0.189545 \tabularnewline
25 & -0.050777 & -0.39 & 0.348961 \tabularnewline
26 & 0.105932 & 0.8137 & 0.209551 \tabularnewline
27 & 0.066633 & 0.5118 & 0.305344 \tabularnewline
28 & -0.020227 & -0.1554 & 0.438531 \tabularnewline
29 & 0.011581 & 0.089 & 0.464709 \tabularnewline
30 & -0.13617 & -1.0459 & 0.149927 \tabularnewline
31 & -0.103113 & -0.792 & 0.215759 \tabularnewline
32 & -0.046022 & -0.3535 & 0.362486 \tabularnewline
33 & -0.053561 & -0.4114 & 0.341132 \tabularnewline
34 & 0.074272 & 0.5705 & 0.285255 \tabularnewline
35 & -0.056945 & -0.4374 & 0.331709 \tabularnewline
36 & -0.009978 & -0.0766 & 0.469583 \tabularnewline
37 & 0.05005 & 0.3844 & 0.351018 \tabularnewline
38 & -0.102643 & -0.7884 & 0.216806 \tabularnewline
39 & 0.105778 & 0.8125 & 0.209886 \tabularnewline
40 & -0.051483 & -0.3954 & 0.34697 \tabularnewline
41 & 0.074002 & 0.5684 & 0.285954 \tabularnewline
42 & -0.013511 & -0.1038 & 0.458847 \tabularnewline
43 & -0.044095 & -0.3387 & 0.36802 \tabularnewline
44 & -0.076908 & -0.5907 & 0.278475 \tabularnewline
45 & -0.042432 & -0.3259 & 0.372816 \tabularnewline
46 & -0.00879 & -0.0675 & 0.473199 \tabularnewline
47 & 0.026064 & 0.2002 & 0.421005 \tabularnewline
48 & -0.030032 & -0.2307 & 0.409181 \tabularnewline
49 & -0.097742 & -0.7508 & 0.227887 \tabularnewline
50 & -0.039149 & -0.3007 & 0.382346 \tabularnewline
51 & 0.002779 & 0.0213 & 0.49152 \tabularnewline
52 & 0.004569 & 0.0351 & 0.486061 \tabularnewline
53 & 0.005354 & 0.0411 & 0.483667 \tabularnewline
54 & 0.034635 & 0.266 & 0.395568 \tabularnewline
55 & -0.005121 & -0.0393 & 0.484378 \tabularnewline
56 & 0.016721 & 0.1284 & 0.44912 \tabularnewline
57 & -0.019173 & -0.1473 & 0.441711 \tabularnewline
58 & -0.020919 & -0.1607 & 0.436446 \tabularnewline
59 & NA & NA & NA \tabularnewline
60 & NA & NA & NA \tabularnewline
\hline
\end{tabular}
%Source: https://freestatistics.org/blog/index.php?pk=60252&T=2

[TABLE]
[ROW][C]Partial Autocorrelation Function[/C][/ROW]
[ROW][C]Time lag k[/C][C]PACF(k)[/C][C]T-STAT[/C][C]P-value[/C][/ROW]
[ROW][C]1[/C][C]-0.084606[/C][C]-0.6499[/C][C]0.259148[/C][/ROW]
[ROW][C]2[/C][C]-0.089341[/C][C]-0.6862[/C][C]0.247623[/C][/ROW]
[ROW][C]3[/C][C]0.143499[/C][C]1.1022[/C][C]0.137417[/C][/ROW]
[ROW][C]4[/C][C]0.087807[/C][C]0.6745[/C][C]0.251326[/C][/ROW]
[ROW][C]5[/C][C]-0.158902[/C][C]-1.2205[/C][C]0.113556[/C][/ROW]
[ROW][C]6[/C][C]-0.138984[/C][C]-1.0676[/C][C]0.145035[/C][/ROW]
[ROW][C]7[/C][C]-0.148379[/C][C]-1.1397[/C][C]0.129504[/C][/ROW]
[ROW][C]8[/C][C]-0.128072[/C][C]-0.9837[/C][C]0.164631[/C][/ROW]
[ROW][C]9[/C][C]0.117478[/C][C]0.9024[/C][C]0.185266[/C][/ROW]
[ROW][C]10[/C][C]-0.006411[/C][C]-0.0492[/C][C]0.480446[/C][/ROW]
[ROW][C]11[/C][C]0.094185[/C][C]0.7234[/C][C]0.236131[/C][/ROW]
[ROW][C]12[/C][C]-0.120494[/C][C]-0.9255[/C][C]0.17923[/C][/ROW]
[ROW][C]13[/C][C]-0.11389[/C][C]-0.8748[/C][C]0.192613[/C][/ROW]
[ROW][C]14[/C][C]-0.120299[/C][C]-0.924[/C][C]0.179615[/C][/ROW]
[ROW][C]15[/C][C]-0.147338[/C][C]-1.1317[/C][C]0.131165[/C][/ROW]
[ROW][C]16[/C][C]-0.147338[/C][C]-1.1317[/C][C]0.131164[/C][/ROW]
[ROW][C]17[/C][C]-0.08472[/C][C]-0.6507[/C][C]0.258868[/C][/ROW]
[ROW][C]18[/C][C]0.038016[/C][C]0.292[/C][C]0.385653[/C][/ROW]
[ROW][C]19[/C][C]-0.114684[/C][C]-0.8809[/C][C]0.190971[/C][/ROW]
[ROW][C]20[/C][C]0.053559[/C][C]0.4114[/C][C]0.341136[/C][/ROW]
[ROW][C]21[/C][C]-0.098885[/C][C]-0.7595[/C][C]0.225275[/C][/ROW]
[ROW][C]22[/C][C]0.098605[/C][C]0.7574[/C][C]0.225911[/C][/ROW]
[ROW][C]23[/C][C]-0.031125[/C][C]-0.2391[/C][C]0.405938[/C][/ROW]
[ROW][C]24[/C][C]-0.115378[/C][C]-0.8862[/C][C]0.189545[/C][/ROW]
[ROW][C]25[/C][C]-0.050777[/C][C]-0.39[/C][C]0.348961[/C][/ROW]
[ROW][C]26[/C][C]0.105932[/C][C]0.8137[/C][C]0.209551[/C][/ROW]
[ROW][C]27[/C][C]0.066633[/C][C]0.5118[/C][C]0.305344[/C][/ROW]
[ROW][C]28[/C][C]-0.020227[/C][C]-0.1554[/C][C]0.438531[/C][/ROW]
[ROW][C]29[/C][C]0.011581[/C][C]0.089[/C][C]0.464709[/C][/ROW]
[ROW][C]30[/C][C]-0.13617[/C][C]-1.0459[/C][C]0.149927[/C][/ROW]
[ROW][C]31[/C][C]-0.103113[/C][C]-0.792[/C][C]0.215759[/C][/ROW]
[ROW][C]32[/C][C]-0.046022[/C][C]-0.3535[/C][C]0.362486[/C][/ROW]
[ROW][C]33[/C][C]-0.053561[/C][C]-0.4114[/C][C]0.341132[/C][/ROW]
[ROW][C]34[/C][C]0.074272[/C][C]0.5705[/C][C]0.285255[/C][/ROW]
[ROW][C]35[/C][C]-0.056945[/C][C]-0.4374[/C][C]0.331709[/C][/ROW]
[ROW][C]36[/C][C]-0.009978[/C][C]-0.0766[/C][C]0.469583[/C][/ROW]
[ROW][C]37[/C][C]0.05005[/C][C]0.3844[/C][C]0.351018[/C][/ROW]
[ROW][C]38[/C][C]-0.102643[/C][C]-0.7884[/C][C]0.216806[/C][/ROW]
[ROW][C]39[/C][C]0.105778[/C][C]0.8125[/C][C]0.209886[/C][/ROW]
[ROW][C]40[/C][C]-0.051483[/C][C]-0.3954[/C][C]0.34697[/C][/ROW]
[ROW][C]41[/C][C]0.074002[/C][C]0.5684[/C][C]0.285954[/C][/ROW]
[ROW][C]42[/C][C]-0.013511[/C][C]-0.1038[/C][C]0.458847[/C][/ROW]
[ROW][C]43[/C][C]-0.044095[/C][C]-0.3387[/C][C]0.36802[/C][/ROW]
[ROW][C]44[/C][C]-0.076908[/C][C]-0.5907[/C][C]0.278475[/C][/ROW]
[ROW][C]45[/C][C]-0.042432[/C][C]-0.3259[/C][C]0.372816[/C][/ROW]
[ROW][C]46[/C][C]-0.00879[/C][C]-0.0675[/C][C]0.473199[/C][/ROW]
[ROW][C]47[/C][C]0.026064[/C][C]0.2002[/C][C]0.421005[/C][/ROW]
[ROW][C]48[/C][C]-0.030032[/C][C]-0.2307[/C][C]0.409181[/C][/ROW]
[ROW][C]49[/C][C]-0.097742[/C][C]-0.7508[/C][C]0.227887[/C][/ROW]
[ROW][C]50[/C][C]-0.039149[/C][C]-0.3007[/C][C]0.382346[/C][/ROW]
[ROW][C]51[/C][C]0.002779[/C][C]0.0213[/C][C]0.49152[/C][/ROW]
[ROW][C]52[/C][C]0.004569[/C][C]0.0351[/C][C]0.486061[/C][/ROW]
[ROW][C]53[/C][C]0.005354[/C][C]0.0411[/C][C]0.483667[/C][/ROW]
[ROW][C]54[/C][C]0.034635[/C][C]0.266[/C][C]0.395568[/C][/ROW]
[ROW][C]55[/C][C]-0.005121[/C][C]-0.0393[/C][C]0.484378[/C][/ROW]
[ROW][C]56[/C][C]0.016721[/C][C]0.1284[/C][C]0.44912[/C][/ROW]
[ROW][C]57[/C][C]-0.019173[/C][C]-0.1473[/C][C]0.441711[/C][/ROW]
[ROW][C]58[/C][C]-0.020919[/C][C]-0.1607[/C][C]0.436446[/C][/ROW]
[ROW][C]59[/C][C]NA[/C][C]NA[/C][C]NA[/C][/ROW]
[ROW][C]60[/C][C]NA[/C][C]NA[/C][C]NA[/C][/ROW]
[/TABLE]
Source: https://freestatistics.org/blog/index.php?pk=60252&T=2

Globally Unique Identifier (entire table): ba.freestatistics.org/blog/index.php?pk=60252&T=2

As an alternative you can also use a QR Code:  

The GUIDs for individual cells are displayed in the table below:

Partial Autocorrelation Function
Time lag kPACF(k)T-STATP-value
1-0.084606-0.64990.259148
2-0.089341-0.68620.247623
30.1434991.10220.137417
40.0878070.67450.251326
5-0.158902-1.22050.113556
6-0.138984-1.06760.145035
7-0.148379-1.13970.129504
8-0.128072-0.98370.164631
90.1174780.90240.185266
10-0.006411-0.04920.480446
110.0941850.72340.236131
12-0.120494-0.92550.17923
13-0.11389-0.87480.192613
14-0.120299-0.9240.179615
15-0.147338-1.13170.131165
16-0.147338-1.13170.131164
17-0.08472-0.65070.258868
180.0380160.2920.385653
19-0.114684-0.88090.190971
200.0535590.41140.341136
21-0.098885-0.75950.225275
220.0986050.75740.225911
23-0.031125-0.23910.405938
24-0.115378-0.88620.189545
25-0.050777-0.390.348961
260.1059320.81370.209551
270.0666330.51180.305344
28-0.020227-0.15540.438531
290.0115810.0890.464709
30-0.13617-1.04590.149927
31-0.103113-0.7920.215759
32-0.046022-0.35350.362486
33-0.053561-0.41140.341132
340.0742720.57050.285255
35-0.056945-0.43740.331709
36-0.009978-0.07660.469583
370.050050.38440.351018
38-0.102643-0.78840.216806
390.1057780.81250.209886
40-0.051483-0.39540.34697
410.0740020.56840.285954
42-0.013511-0.10380.458847
43-0.044095-0.33870.36802
44-0.076908-0.59070.278475
45-0.042432-0.32590.372816
46-0.00879-0.06750.473199
470.0260640.20020.421005
48-0.030032-0.23070.409181
49-0.097742-0.75080.227887
50-0.039149-0.30070.382346
510.0027790.02130.49152
520.0045690.03510.486061
530.0053540.04110.483667
540.0346350.2660.395568
55-0.005121-0.03930.484378
560.0167210.12840.44912
57-0.019173-0.14730.441711
58-0.020919-0.16070.436446
59NANANA
60NANANA


Parameters (Session):
par1 = 60 ; par2 = 1 ; par3 = 1 ; par4 = 0 ; par5 = 12 ; par6 = White Noise ; par7 = 0.95 ;
Parameters (R input):
par1 = 60 ; par2 = 1 ; par3 = 1 ; par4 = 0 ; par5 = 12 ; par6 = White Noise ; par7 = 0.95 ;
R code (references can be found in the software module):
if (par1 == 'Default') {
par1 = 10*log10(length(x))
} else {
par1 <- as.numeric(par1)
}
par2 <- as.numeric(par2)
par3 <- as.numeric(par3)
par4 <- as.numeric(par4)
par5 <- as.numeric(par5)
if (par6 == 'White Noise') par6 <- 'white' else par6 <- 'ma'
par7 <- as.numeric(par7)
if (par2 == 0) {
x <- log(x)
} else {
x <- (x ^ par2 - 1) / par2
}
if (par3 > 0) x <- diff(x,lag=1,difference=par3)
if (par4 > 0) x <- diff(x,lag=par5,difference=par4)
bitmap(file='pic1.png')
racf <- acf(x, par1, main='Autocorrelation', xlab='time lag', ylab='ACF', ci.type=par6, ci=par7, sub=paste('(lambda=',par2,', d=',par3,', D=',par4,', CI=', par7, ', CI type=',par6,')',sep=''))
dev.off()
bitmap(file='pic2.png')
rpacf <- pacf(x,par1,main='Partial Autocorrelation',xlab='lags',ylab='PACF')
dev.off()
(myacf <- c(racf$acf))
(mypacf <- c(rpacf$acf))
lengthx <- length(x)
sqrtn <- sqrt(lengthx)
load(file='createtable')
a<-table.start()
a<-table.row.start(a)
a<-table.element(a,'Autocorrelation Function',4,TRUE)
a<-table.row.end(a)
a<-table.row.start(a)
a<-table.element(a,'Time lag k',header=TRUE)
a<-table.element(a,hyperlink('basics.htm','ACF(k)','click here for more information about the Autocorrelation Function'),header=TRUE)
a<-table.element(a,'T-STAT',header=TRUE)
a<-table.element(a,'P-value',header=TRUE)
a<-table.row.end(a)
for (i in 2:(par1+1)) {
a<-table.row.start(a)
a<-table.element(a,i-1,header=TRUE)
a<-table.element(a,round(myacf[i],6))
mytstat <- myacf[i]*sqrtn
a<-table.element(a,round(mytstat,4))
a<-table.element(a,round(1-pt(abs(mytstat),lengthx),6))
a<-table.row.end(a)
}
a<-table.end(a)
table.save(a,file='mytable.tab')
a<-table.start()
a<-table.row.start(a)
a<-table.element(a,'Partial Autocorrelation Function',4,TRUE)
a<-table.row.end(a)
a<-table.row.start(a)
a<-table.element(a,'Time lag k',header=TRUE)
a<-table.element(a,hyperlink('basics.htm','PACF(k)','click here for more information about the Partial Autocorrelation Function'),header=TRUE)
a<-table.element(a,'T-STAT',header=TRUE)
a<-table.element(a,'P-value',header=TRUE)
a<-table.row.end(a)
for (i in 1:par1) {
a<-table.row.start(a)
a<-table.element(a,i,header=TRUE)
a<-table.element(a,round(mypacf[i],6))
mytstat <- mypacf[i]*sqrtn
a<-table.element(a,round(mytstat,4))
a<-table.element(a,round(1-pt(abs(mytstat),lengthx),6))
a<-table.row.end(a)
}
a<-table.end(a)
table.save(a,file='mytable1.tab')