Free Statistics

of Irreproducible Research!

Author's title

Author*The author of this computation has been verified*
R Software Modulerwasp_autocorrelation.wasp
Title produced by software(Partial) Autocorrelation Function
Date of computationThu, 26 Nov 2009 11:38:17 -0700
Cite this page as followsStatistical Computations at FreeStatistics.org, Office for Research Development and Education, URL https://freestatistics.org/blog/index.php?v=date/2009/Nov/26/t1259260760td68bjkn7kyaljr.htm/, Retrieved Sun, 28 Apr 2024 22:21:27 +0000
Statistical Computations at FreeStatistics.org, Office for Research Development and Education, URL https://freestatistics.org/blog/index.php?pk=60255, Retrieved Sun, 28 Apr 2024 22:21:27 +0000
QR Codes:

Original text written by user:
IsPrivate?No (this computation is public)
User-defined keywords
Estimated Impact114
Family? (F = Feedback message, R = changed R code, M = changed R Module, P = changed Parameters, D = changed Data)
-     [Univariate Explorative Data Analysis] [Run Sequence gebo...] [2008-12-12 13:32:37] [76963dc1903f0f612b6153510a3818cf]
- R  D  [Univariate Explorative Data Analysis] [Run Sequence gebo...] [2008-12-17 12:14:40] [76963dc1903f0f612b6153510a3818cf]
-         [Univariate Explorative Data Analysis] [Run Sequence Plot...] [2008-12-22 18:19:51] [1ce0d16c8f4225c977b42c8fa93bc163]
- RMP       [(Partial) Autocorrelation Function] [Identifying Integ...] [2009-11-22 12:19:56] [b98453cac15ba1066b407e146608df68]
-    D          [(Partial) Autocorrelation Function] [WS 8 ACF (0;1;1)] [2009-11-26 18:38:17] [eba9f01697e64705b70041e6f338cb22] [Current]
Feedback Forum

Post a new message
Dataseries X:
108,01
101,21
119,93
94,76
95,26
117,96
115,86
111,44
108,16
108,77
109,45
124,83
115,31
109,49
124,24
92,85
98,42
120,88
111,72
116,1
109,37
111,65
114,29
133,68
114,27
126,49
131
104
108,88
128,48
132,44
128,04
116,35
120,93
118,59
133,1
121,05
127,62
135,44
114,88
114,34
128,85
138,9
129,44
114,96
127,98
127,03
128,75
137,91
128,37
135,9
122,19
113,08
136,2
138
115,24
110,95
99,23
102,39
112,67


Summary of computational transaction
Raw Inputview raw input (R code)
Raw Outputview raw output of R engine
Computing time1 seconds
R Server'Gwilym Jenkins' @ 72.249.127.135

\begin{tabular}{lllllllll}
\hline
Summary of computational transaction \tabularnewline
Raw Input & view raw input (R code)  \tabularnewline
Raw Output & view raw output of R engine  \tabularnewline
Computing time & 1 seconds \tabularnewline
R Server & 'Gwilym Jenkins' @ 72.249.127.135 \tabularnewline
\hline
\end{tabular}
%Source: https://freestatistics.org/blog/index.php?pk=60255&T=0

[TABLE]
[ROW][C]Summary of computational transaction[/C][/ROW]
[ROW][C]Raw Input[/C][C]view raw input (R code) [/C][/ROW]
[ROW][C]Raw Output[/C][C]view raw output of R engine [/C][/ROW]
[ROW][C]Computing time[/C][C]1 seconds[/C][/ROW]
[ROW][C]R Server[/C][C]'Gwilym Jenkins' @ 72.249.127.135[/C][/ROW]
[/TABLE]
Source: https://freestatistics.org/blog/index.php?pk=60255&T=0

Globally Unique Identifier (entire table): ba.freestatistics.org/blog/index.php?pk=60255&T=0

As an alternative you can also use a QR Code:  

The GUIDs for individual cells are displayed in the table below:

Summary of computational transaction
Raw Inputview raw input (R code)
Raw Outputview raw output of R engine
Computing time1 seconds
R Server'Gwilym Jenkins' @ 72.249.127.135


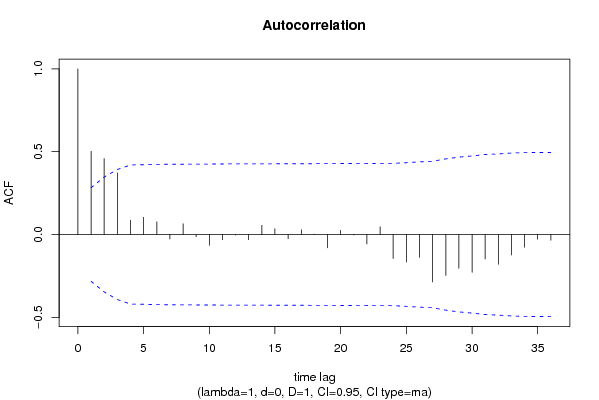
Autocorrelation Function
Time lag kACF(k)T-STATP-value
10.5028183.48360.000533
20.4588473.1790.001294
30.3722482.5790.006514
40.0867690.60120.275283
50.1039450.72020.237462
60.0769070.53280.298305
7-0.027196-0.18840.42567
80.0645030.44690.328483
9-0.013391-0.09280.463235
10-0.065399-0.45310.326261
11-0.031008-0.21480.415405
12-0.002475-0.01710.493196
13-0.030986-0.21470.415463
140.0559630.38770.349968
150.0350360.24270.404622
16-0.025211-0.17470.431039
170.0283010.19610.42269
180.0020220.0140.494439
19-0.080321-0.55650.290234
200.0250270.17340.431537
21-0.002756-0.01910.492422
22-0.057013-0.3950.347297
230.0464910.32210.374389
24-0.144319-0.99990.161194
25-0.166299-1.15220.127482
26-0.138198-0.95750.171566
27-0.286537-1.98520.026427
28-0.247563-1.71520.046382
29-0.20388-1.41250.082123
30-0.22866-1.58420.059858
31-0.147798-1.0240.155491
32-0.178999-1.24010.110476
33-0.123183-0.85340.198827
34-0.076907-0.53280.298306
35-0.028078-0.19450.423292
36-0.034621-0.23990.405731

\begin{tabular}{lllllllll}
\hline
Autocorrelation Function \tabularnewline
Time lag k & ACF(k) & T-STAT & P-value \tabularnewline
1 & 0.502818 & 3.4836 & 0.000533 \tabularnewline
2 & 0.458847 & 3.179 & 0.001294 \tabularnewline
3 & 0.372248 & 2.579 & 0.006514 \tabularnewline
4 & 0.086769 & 0.6012 & 0.275283 \tabularnewline
5 & 0.103945 & 0.7202 & 0.237462 \tabularnewline
6 & 0.076907 & 0.5328 & 0.298305 \tabularnewline
7 & -0.027196 & -0.1884 & 0.42567 \tabularnewline
8 & 0.064503 & 0.4469 & 0.328483 \tabularnewline
9 & -0.013391 & -0.0928 & 0.463235 \tabularnewline
10 & -0.065399 & -0.4531 & 0.326261 \tabularnewline
11 & -0.031008 & -0.2148 & 0.415405 \tabularnewline
12 & -0.002475 & -0.0171 & 0.493196 \tabularnewline
13 & -0.030986 & -0.2147 & 0.415463 \tabularnewline
14 & 0.055963 & 0.3877 & 0.349968 \tabularnewline
15 & 0.035036 & 0.2427 & 0.404622 \tabularnewline
16 & -0.025211 & -0.1747 & 0.431039 \tabularnewline
17 & 0.028301 & 0.1961 & 0.42269 \tabularnewline
18 & 0.002022 & 0.014 & 0.494439 \tabularnewline
19 & -0.080321 & -0.5565 & 0.290234 \tabularnewline
20 & 0.025027 & 0.1734 & 0.431537 \tabularnewline
21 & -0.002756 & -0.0191 & 0.492422 \tabularnewline
22 & -0.057013 & -0.395 & 0.347297 \tabularnewline
23 & 0.046491 & 0.3221 & 0.374389 \tabularnewline
24 & -0.144319 & -0.9999 & 0.161194 \tabularnewline
25 & -0.166299 & -1.1522 & 0.127482 \tabularnewline
26 & -0.138198 & -0.9575 & 0.171566 \tabularnewline
27 & -0.286537 & -1.9852 & 0.026427 \tabularnewline
28 & -0.247563 & -1.7152 & 0.046382 \tabularnewline
29 & -0.20388 & -1.4125 & 0.082123 \tabularnewline
30 & -0.22866 & -1.5842 & 0.059858 \tabularnewline
31 & -0.147798 & -1.024 & 0.155491 \tabularnewline
32 & -0.178999 & -1.2401 & 0.110476 \tabularnewline
33 & -0.123183 & -0.8534 & 0.198827 \tabularnewline
34 & -0.076907 & -0.5328 & 0.298306 \tabularnewline
35 & -0.028078 & -0.1945 & 0.423292 \tabularnewline
36 & -0.034621 & -0.2399 & 0.405731 \tabularnewline
\hline
\end{tabular}
%Source: https://freestatistics.org/blog/index.php?pk=60255&T=1

[TABLE]
[ROW][C]Autocorrelation Function[/C][/ROW]
[ROW][C]Time lag k[/C][C]ACF(k)[/C][C]T-STAT[/C][C]P-value[/C][/ROW]
[ROW][C]1[/C][C]0.502818[/C][C]3.4836[/C][C]0.000533[/C][/ROW]
[ROW][C]2[/C][C]0.458847[/C][C]3.179[/C][C]0.001294[/C][/ROW]
[ROW][C]3[/C][C]0.372248[/C][C]2.579[/C][C]0.006514[/C][/ROW]
[ROW][C]4[/C][C]0.086769[/C][C]0.6012[/C][C]0.275283[/C][/ROW]
[ROW][C]5[/C][C]0.103945[/C][C]0.7202[/C][C]0.237462[/C][/ROW]
[ROW][C]6[/C][C]0.076907[/C][C]0.5328[/C][C]0.298305[/C][/ROW]
[ROW][C]7[/C][C]-0.027196[/C][C]-0.1884[/C][C]0.42567[/C][/ROW]
[ROW][C]8[/C][C]0.064503[/C][C]0.4469[/C][C]0.328483[/C][/ROW]
[ROW][C]9[/C][C]-0.013391[/C][C]-0.0928[/C][C]0.463235[/C][/ROW]
[ROW][C]10[/C][C]-0.065399[/C][C]-0.4531[/C][C]0.326261[/C][/ROW]
[ROW][C]11[/C][C]-0.031008[/C][C]-0.2148[/C][C]0.415405[/C][/ROW]
[ROW][C]12[/C][C]-0.002475[/C][C]-0.0171[/C][C]0.493196[/C][/ROW]
[ROW][C]13[/C][C]-0.030986[/C][C]-0.2147[/C][C]0.415463[/C][/ROW]
[ROW][C]14[/C][C]0.055963[/C][C]0.3877[/C][C]0.349968[/C][/ROW]
[ROW][C]15[/C][C]0.035036[/C][C]0.2427[/C][C]0.404622[/C][/ROW]
[ROW][C]16[/C][C]-0.025211[/C][C]-0.1747[/C][C]0.431039[/C][/ROW]
[ROW][C]17[/C][C]0.028301[/C][C]0.1961[/C][C]0.42269[/C][/ROW]
[ROW][C]18[/C][C]0.002022[/C][C]0.014[/C][C]0.494439[/C][/ROW]
[ROW][C]19[/C][C]-0.080321[/C][C]-0.5565[/C][C]0.290234[/C][/ROW]
[ROW][C]20[/C][C]0.025027[/C][C]0.1734[/C][C]0.431537[/C][/ROW]
[ROW][C]21[/C][C]-0.002756[/C][C]-0.0191[/C][C]0.492422[/C][/ROW]
[ROW][C]22[/C][C]-0.057013[/C][C]-0.395[/C][C]0.347297[/C][/ROW]
[ROW][C]23[/C][C]0.046491[/C][C]0.3221[/C][C]0.374389[/C][/ROW]
[ROW][C]24[/C][C]-0.144319[/C][C]-0.9999[/C][C]0.161194[/C][/ROW]
[ROW][C]25[/C][C]-0.166299[/C][C]-1.1522[/C][C]0.127482[/C][/ROW]
[ROW][C]26[/C][C]-0.138198[/C][C]-0.9575[/C][C]0.171566[/C][/ROW]
[ROW][C]27[/C][C]-0.286537[/C][C]-1.9852[/C][C]0.026427[/C][/ROW]
[ROW][C]28[/C][C]-0.247563[/C][C]-1.7152[/C][C]0.046382[/C][/ROW]
[ROW][C]29[/C][C]-0.20388[/C][C]-1.4125[/C][C]0.082123[/C][/ROW]
[ROW][C]30[/C][C]-0.22866[/C][C]-1.5842[/C][C]0.059858[/C][/ROW]
[ROW][C]31[/C][C]-0.147798[/C][C]-1.024[/C][C]0.155491[/C][/ROW]
[ROW][C]32[/C][C]-0.178999[/C][C]-1.2401[/C][C]0.110476[/C][/ROW]
[ROW][C]33[/C][C]-0.123183[/C][C]-0.8534[/C][C]0.198827[/C][/ROW]
[ROW][C]34[/C][C]-0.076907[/C][C]-0.5328[/C][C]0.298306[/C][/ROW]
[ROW][C]35[/C][C]-0.028078[/C][C]-0.1945[/C][C]0.423292[/C][/ROW]
[ROW][C]36[/C][C]-0.034621[/C][C]-0.2399[/C][C]0.405731[/C][/ROW]
[/TABLE]
Source: https://freestatistics.org/blog/index.php?pk=60255&T=1

Globally Unique Identifier (entire table): ba.freestatistics.org/blog/index.php?pk=60255&T=1

As an alternative you can also use a QR Code:  

The GUIDs for individual cells are displayed in the table below:

Autocorrelation Function
Time lag kACF(k)T-STATP-value
10.5028183.48360.000533
20.4588473.1790.001294
30.3722482.5790.006514
40.0867690.60120.275283
50.1039450.72020.237462
60.0769070.53280.298305
7-0.027196-0.18840.42567
80.0645030.44690.328483
9-0.013391-0.09280.463235
10-0.065399-0.45310.326261
11-0.031008-0.21480.415405
12-0.002475-0.01710.493196
13-0.030986-0.21470.415463
140.0559630.38770.349968
150.0350360.24270.404622
16-0.025211-0.17470.431039
170.0283010.19610.42269
180.0020220.0140.494439
19-0.080321-0.55650.290234
200.0250270.17340.431537
21-0.002756-0.01910.492422
22-0.057013-0.3950.347297
230.0464910.32210.374389
24-0.144319-0.99990.161194
25-0.166299-1.15220.127482
26-0.138198-0.95750.171566
27-0.286537-1.98520.026427
28-0.247563-1.71520.046382
29-0.20388-1.41250.082123
30-0.22866-1.58420.059858
31-0.147798-1.0240.155491
32-0.178999-1.24010.110476
33-0.123183-0.85340.198827
34-0.076907-0.53280.298306
35-0.028078-0.19450.423292
36-0.034621-0.23990.405731


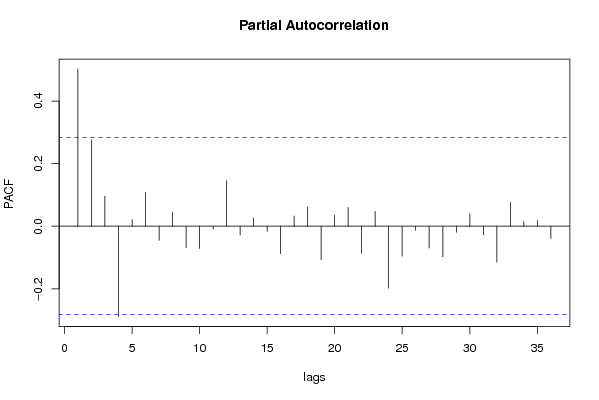
Partial Autocorrelation Function
Time lag kPACF(k)T-STATP-value
10.5028183.48360.000533
20.2757331.91030.031037
30.0963320.66740.253854
4-0.289148-2.00330.025405
50.0209710.14530.442545
60.1078890.74750.22921
7-0.045143-0.31280.377908
80.0450580.31220.378132
9-0.068684-0.47590.318166
10-0.071436-0.49490.311457
11-0.009164-0.06350.474821
120.1456631.00920.158973
13-0.028018-0.19410.423454
140.0258960.17940.429185
15-0.016273-0.11270.455354
16-0.088042-0.610.272379
170.0323280.2240.411863
180.0616190.42690.335677
19-0.106933-0.74090.231195
200.034680.24030.405573
210.0602230.41720.339183
22-0.085938-0.59540.277187
230.0472630.32740.372376
24-0.19804-1.37210.088211
25-0.09596-0.66480.25467
26-0.013053-0.09040.464159
27-0.069263-0.47990.316749
28-0.097956-0.67870.250308
29-0.019558-0.13550.446392
300.0394790.27350.392815
31-0.028126-0.19490.423161
32-0.115064-0.79720.214635
330.0763530.5290.299625
340.0149240.10340.459038
350.0184370.12770.449445
36-0.039017-0.27030.394038

\begin{tabular}{lllllllll}
\hline
Partial Autocorrelation Function \tabularnewline
Time lag k & PACF(k) & T-STAT & P-value \tabularnewline
1 & 0.502818 & 3.4836 & 0.000533 \tabularnewline
2 & 0.275733 & 1.9103 & 0.031037 \tabularnewline
3 & 0.096332 & 0.6674 & 0.253854 \tabularnewline
4 & -0.289148 & -2.0033 & 0.025405 \tabularnewline
5 & 0.020971 & 0.1453 & 0.442545 \tabularnewline
6 & 0.107889 & 0.7475 & 0.22921 \tabularnewline
7 & -0.045143 & -0.3128 & 0.377908 \tabularnewline
8 & 0.045058 & 0.3122 & 0.378132 \tabularnewline
9 & -0.068684 & -0.4759 & 0.318166 \tabularnewline
10 & -0.071436 & -0.4949 & 0.311457 \tabularnewline
11 & -0.009164 & -0.0635 & 0.474821 \tabularnewline
12 & 0.145663 & 1.0092 & 0.158973 \tabularnewline
13 & -0.028018 & -0.1941 & 0.423454 \tabularnewline
14 & 0.025896 & 0.1794 & 0.429185 \tabularnewline
15 & -0.016273 & -0.1127 & 0.455354 \tabularnewline
16 & -0.088042 & -0.61 & 0.272379 \tabularnewline
17 & 0.032328 & 0.224 & 0.411863 \tabularnewline
18 & 0.061619 & 0.4269 & 0.335677 \tabularnewline
19 & -0.106933 & -0.7409 & 0.231195 \tabularnewline
20 & 0.03468 & 0.2403 & 0.405573 \tabularnewline
21 & 0.060223 & 0.4172 & 0.339183 \tabularnewline
22 & -0.085938 & -0.5954 & 0.277187 \tabularnewline
23 & 0.047263 & 0.3274 & 0.372376 \tabularnewline
24 & -0.19804 & -1.3721 & 0.088211 \tabularnewline
25 & -0.09596 & -0.6648 & 0.25467 \tabularnewline
26 & -0.013053 & -0.0904 & 0.464159 \tabularnewline
27 & -0.069263 & -0.4799 & 0.316749 \tabularnewline
28 & -0.097956 & -0.6787 & 0.250308 \tabularnewline
29 & -0.019558 & -0.1355 & 0.446392 \tabularnewline
30 & 0.039479 & 0.2735 & 0.392815 \tabularnewline
31 & -0.028126 & -0.1949 & 0.423161 \tabularnewline
32 & -0.115064 & -0.7972 & 0.214635 \tabularnewline
33 & 0.076353 & 0.529 & 0.299625 \tabularnewline
34 & 0.014924 & 0.1034 & 0.459038 \tabularnewline
35 & 0.018437 & 0.1277 & 0.449445 \tabularnewline
36 & -0.039017 & -0.2703 & 0.394038 \tabularnewline
\hline
\end{tabular}
%Source: https://freestatistics.org/blog/index.php?pk=60255&T=2

[TABLE]
[ROW][C]Partial Autocorrelation Function[/C][/ROW]
[ROW][C]Time lag k[/C][C]PACF(k)[/C][C]T-STAT[/C][C]P-value[/C][/ROW]
[ROW][C]1[/C][C]0.502818[/C][C]3.4836[/C][C]0.000533[/C][/ROW]
[ROW][C]2[/C][C]0.275733[/C][C]1.9103[/C][C]0.031037[/C][/ROW]
[ROW][C]3[/C][C]0.096332[/C][C]0.6674[/C][C]0.253854[/C][/ROW]
[ROW][C]4[/C][C]-0.289148[/C][C]-2.0033[/C][C]0.025405[/C][/ROW]
[ROW][C]5[/C][C]0.020971[/C][C]0.1453[/C][C]0.442545[/C][/ROW]
[ROW][C]6[/C][C]0.107889[/C][C]0.7475[/C][C]0.22921[/C][/ROW]
[ROW][C]7[/C][C]-0.045143[/C][C]-0.3128[/C][C]0.377908[/C][/ROW]
[ROW][C]8[/C][C]0.045058[/C][C]0.3122[/C][C]0.378132[/C][/ROW]
[ROW][C]9[/C][C]-0.068684[/C][C]-0.4759[/C][C]0.318166[/C][/ROW]
[ROW][C]10[/C][C]-0.071436[/C][C]-0.4949[/C][C]0.311457[/C][/ROW]
[ROW][C]11[/C][C]-0.009164[/C][C]-0.0635[/C][C]0.474821[/C][/ROW]
[ROW][C]12[/C][C]0.145663[/C][C]1.0092[/C][C]0.158973[/C][/ROW]
[ROW][C]13[/C][C]-0.028018[/C][C]-0.1941[/C][C]0.423454[/C][/ROW]
[ROW][C]14[/C][C]0.025896[/C][C]0.1794[/C][C]0.429185[/C][/ROW]
[ROW][C]15[/C][C]-0.016273[/C][C]-0.1127[/C][C]0.455354[/C][/ROW]
[ROW][C]16[/C][C]-0.088042[/C][C]-0.61[/C][C]0.272379[/C][/ROW]
[ROW][C]17[/C][C]0.032328[/C][C]0.224[/C][C]0.411863[/C][/ROW]
[ROW][C]18[/C][C]0.061619[/C][C]0.4269[/C][C]0.335677[/C][/ROW]
[ROW][C]19[/C][C]-0.106933[/C][C]-0.7409[/C][C]0.231195[/C][/ROW]
[ROW][C]20[/C][C]0.03468[/C][C]0.2403[/C][C]0.405573[/C][/ROW]
[ROW][C]21[/C][C]0.060223[/C][C]0.4172[/C][C]0.339183[/C][/ROW]
[ROW][C]22[/C][C]-0.085938[/C][C]-0.5954[/C][C]0.277187[/C][/ROW]
[ROW][C]23[/C][C]0.047263[/C][C]0.3274[/C][C]0.372376[/C][/ROW]
[ROW][C]24[/C][C]-0.19804[/C][C]-1.3721[/C][C]0.088211[/C][/ROW]
[ROW][C]25[/C][C]-0.09596[/C][C]-0.6648[/C][C]0.25467[/C][/ROW]
[ROW][C]26[/C][C]-0.013053[/C][C]-0.0904[/C][C]0.464159[/C][/ROW]
[ROW][C]27[/C][C]-0.069263[/C][C]-0.4799[/C][C]0.316749[/C][/ROW]
[ROW][C]28[/C][C]-0.097956[/C][C]-0.6787[/C][C]0.250308[/C][/ROW]
[ROW][C]29[/C][C]-0.019558[/C][C]-0.1355[/C][C]0.446392[/C][/ROW]
[ROW][C]30[/C][C]0.039479[/C][C]0.2735[/C][C]0.392815[/C][/ROW]
[ROW][C]31[/C][C]-0.028126[/C][C]-0.1949[/C][C]0.423161[/C][/ROW]
[ROW][C]32[/C][C]-0.115064[/C][C]-0.7972[/C][C]0.214635[/C][/ROW]
[ROW][C]33[/C][C]0.076353[/C][C]0.529[/C][C]0.299625[/C][/ROW]
[ROW][C]34[/C][C]0.014924[/C][C]0.1034[/C][C]0.459038[/C][/ROW]
[ROW][C]35[/C][C]0.018437[/C][C]0.1277[/C][C]0.449445[/C][/ROW]
[ROW][C]36[/C][C]-0.039017[/C][C]-0.2703[/C][C]0.394038[/C][/ROW]
[/TABLE]
Source: https://freestatistics.org/blog/index.php?pk=60255&T=2

Globally Unique Identifier (entire table): ba.freestatistics.org/blog/index.php?pk=60255&T=2

As an alternative you can also use a QR Code:  

The GUIDs for individual cells are displayed in the table below:

Partial Autocorrelation Function
Time lag kPACF(k)T-STATP-value
10.5028183.48360.000533
20.2757331.91030.031037
30.0963320.66740.253854
4-0.289148-2.00330.025405
50.0209710.14530.442545
60.1078890.74750.22921
7-0.045143-0.31280.377908
80.0450580.31220.378132
9-0.068684-0.47590.318166
10-0.071436-0.49490.311457
11-0.009164-0.06350.474821
120.1456631.00920.158973
13-0.028018-0.19410.423454
140.0258960.17940.429185
15-0.016273-0.11270.455354
16-0.088042-0.610.272379
170.0323280.2240.411863
180.0616190.42690.335677
19-0.106933-0.74090.231195
200.034680.24030.405573
210.0602230.41720.339183
22-0.085938-0.59540.277187
230.0472630.32740.372376
24-0.19804-1.37210.088211
25-0.09596-0.66480.25467
26-0.013053-0.09040.464159
27-0.069263-0.47990.316749
28-0.097956-0.67870.250308
29-0.019558-0.13550.446392
300.0394790.27350.392815
31-0.028126-0.19490.423161
32-0.115064-0.79720.214635
330.0763530.5290.299625
340.0149240.10340.459038
350.0184370.12770.449445
36-0.039017-0.27030.394038


Parameters (Session):
par1 = 36 ; par2 = 1 ; par3 = 0 ; par4 = 1 ; par5 = 12 ; par6 = MA ; par7 = 0.95 ;
Parameters (R input):
par1 = 36 ; par2 = 1 ; par3 = 0 ; par4 = 1 ; par5 = 12 ; par6 = MA ; par7 = 0.95 ;
R code (references can be found in the software module):
if (par1 == 'Default') {
par1 = 10*log10(length(x))
} else {
par1 <- as.numeric(par1)
}
par2 <- as.numeric(par2)
par3 <- as.numeric(par3)
par4 <- as.numeric(par4)
par5 <- as.numeric(par5)
if (par6 == 'White Noise') par6 <- 'white' else par6 <- 'ma'
par7 <- as.numeric(par7)
if (par2 == 0) {
x <- log(x)
} else {
x <- (x ^ par2 - 1) / par2
}
if (par3 > 0) x <- diff(x,lag=1,difference=par3)
if (par4 > 0) x <- diff(x,lag=par5,difference=par4)
bitmap(file='pic1.png')
racf <- acf(x, par1, main='Autocorrelation', xlab='time lag', ylab='ACF', ci.type=par6, ci=par7, sub=paste('(lambda=',par2,', d=',par3,', D=',par4,', CI=', par7, ', CI type=',par6,')',sep=''))
dev.off()
bitmap(file='pic2.png')
rpacf <- pacf(x,par1,main='Partial Autocorrelation',xlab='lags',ylab='PACF')
dev.off()
(myacf <- c(racf$acf))
(mypacf <- c(rpacf$acf))
lengthx <- length(x)
sqrtn <- sqrt(lengthx)
load(file='createtable')
a<-table.start()
a<-table.row.start(a)
a<-table.element(a,'Autocorrelation Function',4,TRUE)
a<-table.row.end(a)
a<-table.row.start(a)
a<-table.element(a,'Time lag k',header=TRUE)
a<-table.element(a,hyperlink('basics.htm','ACF(k)','click here for more information about the Autocorrelation Function'),header=TRUE)
a<-table.element(a,'T-STAT',header=TRUE)
a<-table.element(a,'P-value',header=TRUE)
a<-table.row.end(a)
for (i in 2:(par1+1)) {
a<-table.row.start(a)
a<-table.element(a,i-1,header=TRUE)
a<-table.element(a,round(myacf[i],6))
mytstat <- myacf[i]*sqrtn
a<-table.element(a,round(mytstat,4))
a<-table.element(a,round(1-pt(abs(mytstat),lengthx),6))
a<-table.row.end(a)
}
a<-table.end(a)
table.save(a,file='mytable.tab')
a<-table.start()
a<-table.row.start(a)
a<-table.element(a,'Partial Autocorrelation Function',4,TRUE)
a<-table.row.end(a)
a<-table.row.start(a)
a<-table.element(a,'Time lag k',header=TRUE)
a<-table.element(a,hyperlink('basics.htm','PACF(k)','click here for more information about the Partial Autocorrelation Function'),header=TRUE)
a<-table.element(a,'T-STAT',header=TRUE)
a<-table.element(a,'P-value',header=TRUE)
a<-table.row.end(a)
for (i in 1:par1) {
a<-table.row.start(a)
a<-table.element(a,i,header=TRUE)
a<-table.element(a,round(mypacf[i],6))
mytstat <- mypacf[i]*sqrtn
a<-table.element(a,round(mytstat,4))
a<-table.element(a,round(1-pt(abs(mytstat),lengthx),6))
a<-table.row.end(a)
}
a<-table.end(a)
table.save(a,file='mytable1.tab')