Free Statistics

of Irreproducible Research!

Author's title

Author*The author of this computation has been verified*
R Software Modulerwasp_autocorrelation.wasp
Title produced by software(Partial) Autocorrelation Function
Date of computationThu, 26 Nov 2009 11:42:04 -0700
Cite this page as followsStatistical Computations at FreeStatistics.org, Office for Research Development and Education, URL https://freestatistics.org/blog/index.php?v=date/2009/Nov/26/t1259260978eff7b5loy8uxgzs.htm/, Retrieved Mon, 29 Apr 2024 04:09:14 +0000
Statistical Computations at FreeStatistics.org, Office for Research Development and Education, URL https://freestatistics.org/blog/index.php?pk=60261, Retrieved Mon, 29 Apr 2024 04:09:14 +0000
QR Codes:

Original text written by user:
IsPrivate?No (this computation is public)
User-defined keywords
Estimated Impact167
Family? (F = Feedback message, R = changed R code, M = changed R Module, P = changed Parameters, D = changed Data)
-     [Univariate Explorative Data Analysis] [Run Sequence gebo...] [2008-12-12 13:32:37] [76963dc1903f0f612b6153510a3818cf]
- R  D  [Univariate Explorative Data Analysis] [Run Sequence gebo...] [2008-12-17 12:14:40] [76963dc1903f0f612b6153510a3818cf]
-         [Univariate Explorative Data Analysis] [Run Sequence Plot...] [2008-12-22 18:19:51] [1ce0d16c8f4225c977b42c8fa93bc163]
- RMP       [(Partial) Autocorrelation Function] [Identifying Integ...] [2009-11-22 12:26:39] [b98453cac15ba1066b407e146608df68]
-    D          [(Partial) Autocorrelation Function] [WS 8 ACF (1;1;1)] [2009-11-26 18:42:04] [eba9f01697e64705b70041e6f338cb22] [Current]
Feedback Forum

Post a new message
Dataseries X:
108,01
101,21
119,93
94,76
95,26
117,96
115,86
111,44
108,16
108,77
109,45
124,83
115,31
109,49
124,24
92,85
98,42
120,88
111,72
116,1
109,37
111,65
114,29
133,68
114,27
126,49
131
104
108,88
128,48
132,44
128,04
116,35
120,93
118,59
133,1
121,05
127,62
135,44
114,88
114,34
128,85
138,9
129,44
114,96
127,98
127,03
128,75
137,91
128,37
135,9
122,19
113,08
136,2
138
115,24
110,95
99,23
102,39
112,67


Summary of computational transaction
Raw Inputview raw input (R code)
Raw Outputview raw output of R engine
Computing time1 seconds
R Server'Gwilym Jenkins' @ 72.249.127.135

\begin{tabular}{lllllllll}
\hline
Summary of computational transaction \tabularnewline
Raw Input & view raw input (R code)  \tabularnewline
Raw Output & view raw output of R engine  \tabularnewline
Computing time & 1 seconds \tabularnewline
R Server & 'Gwilym Jenkins' @ 72.249.127.135 \tabularnewline
\hline
\end{tabular}
%Source: https://freestatistics.org/blog/index.php?pk=60261&T=0

[TABLE]
[ROW][C]Summary of computational transaction[/C][/ROW]
[ROW][C]Raw Input[/C][C]view raw input (R code) [/C][/ROW]
[ROW][C]Raw Output[/C][C]view raw output of R engine [/C][/ROW]
[ROW][C]Computing time[/C][C]1 seconds[/C][/ROW]
[ROW][C]R Server[/C][C]'Gwilym Jenkins' @ 72.249.127.135[/C][/ROW]
[/TABLE]
Source: https://freestatistics.org/blog/index.php?pk=60261&T=0

Globally Unique Identifier (entire table): ba.freestatistics.org/blog/index.php?pk=60261&T=0

As an alternative you can also use a QR Code:  

The GUIDs for individual cells are displayed in the table below:

Summary of computational transaction
Raw Inputview raw input (R code)
Raw Outputview raw output of R engine
Computing time1 seconds
R Server'Gwilym Jenkins' @ 72.249.127.135


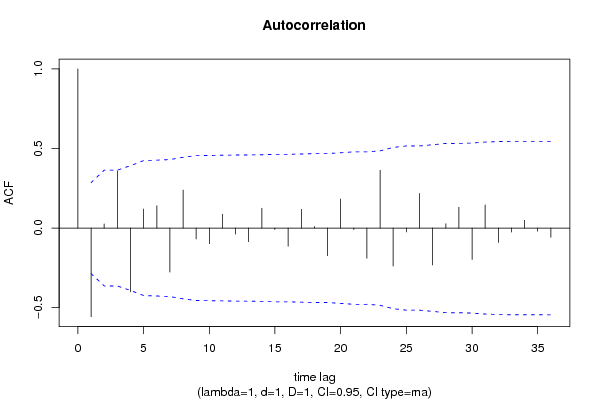
Autocorrelation Function
Time lag kACF(k)T-STATP-value
1-0.556736-3.81680.000197
20.0259770.17810.42971
30.3601832.46930.008614
4-0.400592-2.74630.004257
50.1192110.81730.208949
60.1396680.95750.171604
7-0.276308-1.89430.032176
80.2391721.63970.053875
9-0.068214-0.46770.321098
10-0.098539-0.67550.251319
110.0872480.59810.276309
12-0.037714-0.25860.398555
13-0.085614-0.58690.280026
140.1248060.85560.198273
15-0.00913-0.06260.475177
16-0.113609-0.77890.219982
170.118040.80920.211226
180.009810.06730.473333
19-0.173638-1.19040.119933
200.1825581.25160.108463
21-0.009596-0.06580.473915
22-0.189254-1.29750.100403
230.3637312.49360.008111
24-0.239181-1.63970.053868
25-0.024242-0.16620.434358
260.2179291.4940.070924
27-0.231563-1.58750.05955
280.0267570.18340.427623
290.1300620.89170.188559
30-0.19687-1.34970.091793
310.1455760.9980.161691
32-0.090389-0.61970.269233
33-0.025482-0.17470.431034
340.0485150.33260.370456
35-0.019834-0.1360.44621
36-0.058394-0.40030.345365

\begin{tabular}{lllllllll}
\hline
Autocorrelation Function \tabularnewline
Time lag k & ACF(k) & T-STAT & P-value \tabularnewline
1 & -0.556736 & -3.8168 & 0.000197 \tabularnewline
2 & 0.025977 & 0.1781 & 0.42971 \tabularnewline
3 & 0.360183 & 2.4693 & 0.008614 \tabularnewline
4 & -0.400592 & -2.7463 & 0.004257 \tabularnewline
5 & 0.119211 & 0.8173 & 0.208949 \tabularnewline
6 & 0.139668 & 0.9575 & 0.171604 \tabularnewline
7 & -0.276308 & -1.8943 & 0.032176 \tabularnewline
8 & 0.239172 & 1.6397 & 0.053875 \tabularnewline
9 & -0.068214 & -0.4677 & 0.321098 \tabularnewline
10 & -0.098539 & -0.6755 & 0.251319 \tabularnewline
11 & 0.087248 & 0.5981 & 0.276309 \tabularnewline
12 & -0.037714 & -0.2586 & 0.398555 \tabularnewline
13 & -0.085614 & -0.5869 & 0.280026 \tabularnewline
14 & 0.124806 & 0.8556 & 0.198273 \tabularnewline
15 & -0.00913 & -0.0626 & 0.475177 \tabularnewline
16 & -0.113609 & -0.7789 & 0.219982 \tabularnewline
17 & 0.11804 & 0.8092 & 0.211226 \tabularnewline
18 & 0.00981 & 0.0673 & 0.473333 \tabularnewline
19 & -0.173638 & -1.1904 & 0.119933 \tabularnewline
20 & 0.182558 & 1.2516 & 0.108463 \tabularnewline
21 & -0.009596 & -0.0658 & 0.473915 \tabularnewline
22 & -0.189254 & -1.2975 & 0.100403 \tabularnewline
23 & 0.363731 & 2.4936 & 0.008111 \tabularnewline
24 & -0.239181 & -1.6397 & 0.053868 \tabularnewline
25 & -0.024242 & -0.1662 & 0.434358 \tabularnewline
26 & 0.217929 & 1.494 & 0.070924 \tabularnewline
27 & -0.231563 & -1.5875 & 0.05955 \tabularnewline
28 & 0.026757 & 0.1834 & 0.427623 \tabularnewline
29 & 0.130062 & 0.8917 & 0.188559 \tabularnewline
30 & -0.19687 & -1.3497 & 0.091793 \tabularnewline
31 & 0.145576 & 0.998 & 0.161691 \tabularnewline
32 & -0.090389 & -0.6197 & 0.269233 \tabularnewline
33 & -0.025482 & -0.1747 & 0.431034 \tabularnewline
34 & 0.048515 & 0.3326 & 0.370456 \tabularnewline
35 & -0.019834 & -0.136 & 0.44621 \tabularnewline
36 & -0.058394 & -0.4003 & 0.345365 \tabularnewline
\hline
\end{tabular}
%Source: https://freestatistics.org/blog/index.php?pk=60261&T=1

[TABLE]
[ROW][C]Autocorrelation Function[/C][/ROW]
[ROW][C]Time lag k[/C][C]ACF(k)[/C][C]T-STAT[/C][C]P-value[/C][/ROW]
[ROW][C]1[/C][C]-0.556736[/C][C]-3.8168[/C][C]0.000197[/C][/ROW]
[ROW][C]2[/C][C]0.025977[/C][C]0.1781[/C][C]0.42971[/C][/ROW]
[ROW][C]3[/C][C]0.360183[/C][C]2.4693[/C][C]0.008614[/C][/ROW]
[ROW][C]4[/C][C]-0.400592[/C][C]-2.7463[/C][C]0.004257[/C][/ROW]
[ROW][C]5[/C][C]0.119211[/C][C]0.8173[/C][C]0.208949[/C][/ROW]
[ROW][C]6[/C][C]0.139668[/C][C]0.9575[/C][C]0.171604[/C][/ROW]
[ROW][C]7[/C][C]-0.276308[/C][C]-1.8943[/C][C]0.032176[/C][/ROW]
[ROW][C]8[/C][C]0.239172[/C][C]1.6397[/C][C]0.053875[/C][/ROW]
[ROW][C]9[/C][C]-0.068214[/C][C]-0.4677[/C][C]0.321098[/C][/ROW]
[ROW][C]10[/C][C]-0.098539[/C][C]-0.6755[/C][C]0.251319[/C][/ROW]
[ROW][C]11[/C][C]0.087248[/C][C]0.5981[/C][C]0.276309[/C][/ROW]
[ROW][C]12[/C][C]-0.037714[/C][C]-0.2586[/C][C]0.398555[/C][/ROW]
[ROW][C]13[/C][C]-0.085614[/C][C]-0.5869[/C][C]0.280026[/C][/ROW]
[ROW][C]14[/C][C]0.124806[/C][C]0.8556[/C][C]0.198273[/C][/ROW]
[ROW][C]15[/C][C]-0.00913[/C][C]-0.0626[/C][C]0.475177[/C][/ROW]
[ROW][C]16[/C][C]-0.113609[/C][C]-0.7789[/C][C]0.219982[/C][/ROW]
[ROW][C]17[/C][C]0.11804[/C][C]0.8092[/C][C]0.211226[/C][/ROW]
[ROW][C]18[/C][C]0.00981[/C][C]0.0673[/C][C]0.473333[/C][/ROW]
[ROW][C]19[/C][C]-0.173638[/C][C]-1.1904[/C][C]0.119933[/C][/ROW]
[ROW][C]20[/C][C]0.182558[/C][C]1.2516[/C][C]0.108463[/C][/ROW]
[ROW][C]21[/C][C]-0.009596[/C][C]-0.0658[/C][C]0.473915[/C][/ROW]
[ROW][C]22[/C][C]-0.189254[/C][C]-1.2975[/C][C]0.100403[/C][/ROW]
[ROW][C]23[/C][C]0.363731[/C][C]2.4936[/C][C]0.008111[/C][/ROW]
[ROW][C]24[/C][C]-0.239181[/C][C]-1.6397[/C][C]0.053868[/C][/ROW]
[ROW][C]25[/C][C]-0.024242[/C][C]-0.1662[/C][C]0.434358[/C][/ROW]
[ROW][C]26[/C][C]0.217929[/C][C]1.494[/C][C]0.070924[/C][/ROW]
[ROW][C]27[/C][C]-0.231563[/C][C]-1.5875[/C][C]0.05955[/C][/ROW]
[ROW][C]28[/C][C]0.026757[/C][C]0.1834[/C][C]0.427623[/C][/ROW]
[ROW][C]29[/C][C]0.130062[/C][C]0.8917[/C][C]0.188559[/C][/ROW]
[ROW][C]30[/C][C]-0.19687[/C][C]-1.3497[/C][C]0.091793[/C][/ROW]
[ROW][C]31[/C][C]0.145576[/C][C]0.998[/C][C]0.161691[/C][/ROW]
[ROW][C]32[/C][C]-0.090389[/C][C]-0.6197[/C][C]0.269233[/C][/ROW]
[ROW][C]33[/C][C]-0.025482[/C][C]-0.1747[/C][C]0.431034[/C][/ROW]
[ROW][C]34[/C][C]0.048515[/C][C]0.3326[/C][C]0.370456[/C][/ROW]
[ROW][C]35[/C][C]-0.019834[/C][C]-0.136[/C][C]0.44621[/C][/ROW]
[ROW][C]36[/C][C]-0.058394[/C][C]-0.4003[/C][C]0.345365[/C][/ROW]
[/TABLE]
Source: https://freestatistics.org/blog/index.php?pk=60261&T=1

Globally Unique Identifier (entire table): ba.freestatistics.org/blog/index.php?pk=60261&T=1

As an alternative you can also use a QR Code:  

The GUIDs for individual cells are displayed in the table below:

Autocorrelation Function
Time lag kACF(k)T-STATP-value
1-0.556736-3.81680.000197
20.0259770.17810.42971
30.3601832.46930.008614
4-0.400592-2.74630.004257
50.1192110.81730.208949
60.1396680.95750.171604
7-0.276308-1.89430.032176
80.2391721.63970.053875
9-0.068214-0.46770.321098
10-0.098539-0.67550.251319
110.0872480.59810.276309
12-0.037714-0.25860.398555
13-0.085614-0.58690.280026
140.1248060.85560.198273
15-0.00913-0.06260.475177
16-0.113609-0.77890.219982
170.118040.80920.211226
180.009810.06730.473333
19-0.173638-1.19040.119933
200.1825581.25160.108463
21-0.009596-0.06580.473915
22-0.189254-1.29750.100403
230.3637312.49360.008111
24-0.239181-1.63970.053868
25-0.024242-0.16620.434358
260.2179291.4940.070924
27-0.231563-1.58750.05955
280.0267570.18340.427623
290.1300620.89170.188559
30-0.19687-1.34970.091793
310.1455760.9980.161691
32-0.090389-0.61970.269233
33-0.025482-0.17470.431034
340.0485150.33260.370456
35-0.019834-0.1360.44621
36-0.058394-0.40030.345365


Partial Autocorrelation Function
Time lag kPACF(k)T-STATP-value
1-0.556736-3.81680.000197
2-0.411537-2.82140.003493
30.264281.81180.038203
4-0.008037-0.05510.478146
5-0.165747-1.13630.130795
6-0.028864-0.19790.421995
7-0.067796-0.46480.322114
80.0779210.53420.297861
90.0096740.06630.473701
10-0.031268-0.21440.415596
11-0.166181-1.13930.130181
12-0.054762-0.37540.354515
13-0.083656-0.57350.284515
14-0.000234-0.00160.499364
150.1235540.8470.200631
16-0.068315-0.46830.320853
17-0.116811-0.80080.213635
180.0613580.42060.337964
19-0.041106-0.28180.389663
20-0.049771-0.34120.367232
210.1038820.71220.239938
22-0.097829-0.67070.252852
230.1883911.29150.101416
240.1044990.71640.238642
25-0.020812-0.14270.443577
26-0.057271-0.39260.348183
270.0503860.34540.365657
28-0.069816-0.47860.317208
29-0.102521-0.70290.242808
30-0.011196-0.07680.469571
310.0268810.18430.427291
32-0.169281-1.16050.125846
33-0.065023-0.44580.328902
34-0.025409-0.17420.431229
350.0212630.14580.442361
36-0.055437-0.38010.352808

\begin{tabular}{lllllllll}
\hline
Partial Autocorrelation Function \tabularnewline
Time lag k & PACF(k) & T-STAT & P-value \tabularnewline
1 & -0.556736 & -3.8168 & 0.000197 \tabularnewline
2 & -0.411537 & -2.8214 & 0.003493 \tabularnewline
3 & 0.26428 & 1.8118 & 0.038203 \tabularnewline
4 & -0.008037 & -0.0551 & 0.478146 \tabularnewline
5 & -0.165747 & -1.1363 & 0.130795 \tabularnewline
6 & -0.028864 & -0.1979 & 0.421995 \tabularnewline
7 & -0.067796 & -0.4648 & 0.322114 \tabularnewline
8 & 0.077921 & 0.5342 & 0.297861 \tabularnewline
9 & 0.009674 & 0.0663 & 0.473701 \tabularnewline
10 & -0.031268 & -0.2144 & 0.415596 \tabularnewline
11 & -0.166181 & -1.1393 & 0.130181 \tabularnewline
12 & -0.054762 & -0.3754 & 0.354515 \tabularnewline
13 & -0.083656 & -0.5735 & 0.284515 \tabularnewline
14 & -0.000234 & -0.0016 & 0.499364 \tabularnewline
15 & 0.123554 & 0.847 & 0.200631 \tabularnewline
16 & -0.068315 & -0.4683 & 0.320853 \tabularnewline
17 & -0.116811 & -0.8008 & 0.213635 \tabularnewline
18 & 0.061358 & 0.4206 & 0.337964 \tabularnewline
19 & -0.041106 & -0.2818 & 0.389663 \tabularnewline
20 & -0.049771 & -0.3412 & 0.367232 \tabularnewline
21 & 0.103882 & 0.7122 & 0.239938 \tabularnewline
22 & -0.097829 & -0.6707 & 0.252852 \tabularnewline
23 & 0.188391 & 1.2915 & 0.101416 \tabularnewline
24 & 0.104499 & 0.7164 & 0.238642 \tabularnewline
25 & -0.020812 & -0.1427 & 0.443577 \tabularnewline
26 & -0.057271 & -0.3926 & 0.348183 \tabularnewline
27 & 0.050386 & 0.3454 & 0.365657 \tabularnewline
28 & -0.069816 & -0.4786 & 0.317208 \tabularnewline
29 & -0.102521 & -0.7029 & 0.242808 \tabularnewline
30 & -0.011196 & -0.0768 & 0.469571 \tabularnewline
31 & 0.026881 & 0.1843 & 0.427291 \tabularnewline
32 & -0.169281 & -1.1605 & 0.125846 \tabularnewline
33 & -0.065023 & -0.4458 & 0.328902 \tabularnewline
34 & -0.025409 & -0.1742 & 0.431229 \tabularnewline
35 & 0.021263 & 0.1458 & 0.442361 \tabularnewline
36 & -0.055437 & -0.3801 & 0.352808 \tabularnewline
\hline
\end{tabular}
%Source: https://freestatistics.org/blog/index.php?pk=60261&T=2

[TABLE]
[ROW][C]Partial Autocorrelation Function[/C][/ROW]
[ROW][C]Time lag k[/C][C]PACF(k)[/C][C]T-STAT[/C][C]P-value[/C][/ROW]
[ROW][C]1[/C][C]-0.556736[/C][C]-3.8168[/C][C]0.000197[/C][/ROW]
[ROW][C]2[/C][C]-0.411537[/C][C]-2.8214[/C][C]0.003493[/C][/ROW]
[ROW][C]3[/C][C]0.26428[/C][C]1.8118[/C][C]0.038203[/C][/ROW]
[ROW][C]4[/C][C]-0.008037[/C][C]-0.0551[/C][C]0.478146[/C][/ROW]
[ROW][C]5[/C][C]-0.165747[/C][C]-1.1363[/C][C]0.130795[/C][/ROW]
[ROW][C]6[/C][C]-0.028864[/C][C]-0.1979[/C][C]0.421995[/C][/ROW]
[ROW][C]7[/C][C]-0.067796[/C][C]-0.4648[/C][C]0.322114[/C][/ROW]
[ROW][C]8[/C][C]0.077921[/C][C]0.5342[/C][C]0.297861[/C][/ROW]
[ROW][C]9[/C][C]0.009674[/C][C]0.0663[/C][C]0.473701[/C][/ROW]
[ROW][C]10[/C][C]-0.031268[/C][C]-0.2144[/C][C]0.415596[/C][/ROW]
[ROW][C]11[/C][C]-0.166181[/C][C]-1.1393[/C][C]0.130181[/C][/ROW]
[ROW][C]12[/C][C]-0.054762[/C][C]-0.3754[/C][C]0.354515[/C][/ROW]
[ROW][C]13[/C][C]-0.083656[/C][C]-0.5735[/C][C]0.284515[/C][/ROW]
[ROW][C]14[/C][C]-0.000234[/C][C]-0.0016[/C][C]0.499364[/C][/ROW]
[ROW][C]15[/C][C]0.123554[/C][C]0.847[/C][C]0.200631[/C][/ROW]
[ROW][C]16[/C][C]-0.068315[/C][C]-0.4683[/C][C]0.320853[/C][/ROW]
[ROW][C]17[/C][C]-0.116811[/C][C]-0.8008[/C][C]0.213635[/C][/ROW]
[ROW][C]18[/C][C]0.061358[/C][C]0.4206[/C][C]0.337964[/C][/ROW]
[ROW][C]19[/C][C]-0.041106[/C][C]-0.2818[/C][C]0.389663[/C][/ROW]
[ROW][C]20[/C][C]-0.049771[/C][C]-0.3412[/C][C]0.367232[/C][/ROW]
[ROW][C]21[/C][C]0.103882[/C][C]0.7122[/C][C]0.239938[/C][/ROW]
[ROW][C]22[/C][C]-0.097829[/C][C]-0.6707[/C][C]0.252852[/C][/ROW]
[ROW][C]23[/C][C]0.188391[/C][C]1.2915[/C][C]0.101416[/C][/ROW]
[ROW][C]24[/C][C]0.104499[/C][C]0.7164[/C][C]0.238642[/C][/ROW]
[ROW][C]25[/C][C]-0.020812[/C][C]-0.1427[/C][C]0.443577[/C][/ROW]
[ROW][C]26[/C][C]-0.057271[/C][C]-0.3926[/C][C]0.348183[/C][/ROW]
[ROW][C]27[/C][C]0.050386[/C][C]0.3454[/C][C]0.365657[/C][/ROW]
[ROW][C]28[/C][C]-0.069816[/C][C]-0.4786[/C][C]0.317208[/C][/ROW]
[ROW][C]29[/C][C]-0.102521[/C][C]-0.7029[/C][C]0.242808[/C][/ROW]
[ROW][C]30[/C][C]-0.011196[/C][C]-0.0768[/C][C]0.469571[/C][/ROW]
[ROW][C]31[/C][C]0.026881[/C][C]0.1843[/C][C]0.427291[/C][/ROW]
[ROW][C]32[/C][C]-0.169281[/C][C]-1.1605[/C][C]0.125846[/C][/ROW]
[ROW][C]33[/C][C]-0.065023[/C][C]-0.4458[/C][C]0.328902[/C][/ROW]
[ROW][C]34[/C][C]-0.025409[/C][C]-0.1742[/C][C]0.431229[/C][/ROW]
[ROW][C]35[/C][C]0.021263[/C][C]0.1458[/C][C]0.442361[/C][/ROW]
[ROW][C]36[/C][C]-0.055437[/C][C]-0.3801[/C][C]0.352808[/C][/ROW]
[/TABLE]
Source: https://freestatistics.org/blog/index.php?pk=60261&T=2

Globally Unique Identifier (entire table): ba.freestatistics.org/blog/index.php?pk=60261&T=2

As an alternative you can also use a QR Code:  

The GUIDs for individual cells are displayed in the table below:

Partial Autocorrelation Function
Time lag kPACF(k)T-STATP-value
1-0.556736-3.81680.000197
2-0.411537-2.82140.003493
30.264281.81180.038203
4-0.008037-0.05510.478146
5-0.165747-1.13630.130795
6-0.028864-0.19790.421995
7-0.067796-0.46480.322114
80.0779210.53420.297861
90.0096740.06630.473701
10-0.031268-0.21440.415596
11-0.166181-1.13930.130181
12-0.054762-0.37540.354515
13-0.083656-0.57350.284515
14-0.000234-0.00160.499364
150.1235540.8470.200631
16-0.068315-0.46830.320853
17-0.116811-0.80080.213635
180.0613580.42060.337964
19-0.041106-0.28180.389663
20-0.049771-0.34120.367232
210.1038820.71220.239938
22-0.097829-0.67070.252852
230.1883911.29150.101416
240.1044990.71640.238642
25-0.020812-0.14270.443577
26-0.057271-0.39260.348183
270.0503860.34540.365657
28-0.069816-0.47860.317208
29-0.102521-0.70290.242808
30-0.011196-0.07680.469571
310.0268810.18430.427291
32-0.169281-1.16050.125846
33-0.065023-0.44580.328902
34-0.025409-0.17420.431229
350.0212630.14580.442361
36-0.055437-0.38010.352808


Parameters (Session):
par1 = 36 ; par2 = 1 ; par3 = 1 ; par4 = 1 ; par5 = 12 ; par6 = MA ; par7 = 0.95 ;
Parameters (R input):
par1 = 36 ; par2 = 1 ; par3 = 1 ; par4 = 1 ; par5 = 12 ; par6 = MA ; par7 = 0.95 ;
R code (references can be found in the software module):
if (par1 == 'Default') {
par1 = 10*log10(length(x))
} else {
par1 <- as.numeric(par1)
}
par2 <- as.numeric(par2)
par3 <- as.numeric(par3)
par4 <- as.numeric(par4)
par5 <- as.numeric(par5)
if (par6 == 'White Noise') par6 <- 'white' else par6 <- 'ma'
par7 <- as.numeric(par7)
if (par2 == 0) {
x <- log(x)
} else {
x <- (x ^ par2 - 1) / par2
}
if (par3 > 0) x <- diff(x,lag=1,difference=par3)
if (par4 > 0) x <- diff(x,lag=par5,difference=par4)
bitmap(file='pic1.png')
racf <- acf(x, par1, main='Autocorrelation', xlab='time lag', ylab='ACF', ci.type=par6, ci=par7, sub=paste('(lambda=',par2,', d=',par3,', D=',par4,', CI=', par7, ', CI type=',par6,')',sep=''))
dev.off()
bitmap(file='pic2.png')
rpacf <- pacf(x,par1,main='Partial Autocorrelation',xlab='lags',ylab='PACF')
dev.off()
(myacf <- c(racf$acf))
(mypacf <- c(rpacf$acf))
lengthx <- length(x)
sqrtn <- sqrt(lengthx)
load(file='createtable')
a<-table.start()
a<-table.row.start(a)
a<-table.element(a,'Autocorrelation Function',4,TRUE)
a<-table.row.end(a)
a<-table.row.start(a)
a<-table.element(a,'Time lag k',header=TRUE)
a<-table.element(a,hyperlink('basics.htm','ACF(k)','click here for more information about the Autocorrelation Function'),header=TRUE)
a<-table.element(a,'T-STAT',header=TRUE)
a<-table.element(a,'P-value',header=TRUE)
a<-table.row.end(a)
for (i in 2:(par1+1)) {
a<-table.row.start(a)
a<-table.element(a,i-1,header=TRUE)
a<-table.element(a,round(myacf[i],6))
mytstat <- myacf[i]*sqrtn
a<-table.element(a,round(mytstat,4))
a<-table.element(a,round(1-pt(abs(mytstat),lengthx),6))
a<-table.row.end(a)
}
a<-table.end(a)
table.save(a,file='mytable.tab')
a<-table.start()
a<-table.row.start(a)
a<-table.element(a,'Partial Autocorrelation Function',4,TRUE)
a<-table.row.end(a)
a<-table.row.start(a)
a<-table.element(a,'Time lag k',header=TRUE)
a<-table.element(a,hyperlink('basics.htm','PACF(k)','click here for more information about the Partial Autocorrelation Function'),header=TRUE)
a<-table.element(a,'T-STAT',header=TRUE)
a<-table.element(a,'P-value',header=TRUE)
a<-table.row.end(a)
for (i in 1:par1) {
a<-table.row.start(a)
a<-table.element(a,i,header=TRUE)
a<-table.element(a,round(mypacf[i],6))
mytstat <- mypacf[i]*sqrtn
a<-table.element(a,round(mytstat,4))
a<-table.element(a,round(1-pt(abs(mytstat),lengthx),6))
a<-table.row.end(a)
}
a<-table.end(a)
table.save(a,file='mytable1.tab')