Free Statistics

of Irreproducible Research!

Author's title

Author*The author of this computation has been verified*
R Software Modulerwasp_autocorrelation.wasp
Title produced by software(Partial) Autocorrelation Function
Date of computationThu, 26 Nov 2009 11:48:39 -0700
Cite this page as followsStatistical Computations at FreeStatistics.org, Office for Research Development and Education, URL https://freestatistics.org/blog/index.php?v=date/2009/Nov/26/t12592614377db3lflqtwtjyc3.htm/, Retrieved Sun, 28 Apr 2024 22:43:54 +0000
Statistical Computations at FreeStatistics.org, Office for Research Development and Education, URL https://freestatistics.org/blog/index.php?pk=60273, Retrieved Sun, 28 Apr 2024 22:43:54 +0000
QR Codes:

Original text written by user:
IsPrivate?No (this computation is public)
User-defined keywords
Estimated Impact120
Family? (F = Feedback message, R = changed R code, M = changed R Module, P = changed Parameters, D = changed Data)
-     [Univariate Explorative Data Analysis] [Run Sequence gebo...] [2008-12-12 13:32:37] [76963dc1903f0f612b6153510a3818cf]
- R  D  [Univariate Explorative Data Analysis] [Run Sequence gebo...] [2008-12-17 12:14:40] [76963dc1903f0f612b6153510a3818cf]
-         [Univariate Explorative Data Analysis] [Run Sequence Plot...] [2008-12-22 18:19:51] [1ce0d16c8f4225c977b42c8fa93bc163]
- RMP       [(Partial) Autocorrelation Function] [Identifying Integ...] [2009-11-22 12:16:10] [b98453cac15ba1066b407e146608df68]
-    D          [(Partial) Autocorrelation Function] [] [2009-11-26 18:48:39] [aa8eb70c35ea8a87edcd21d6427e653e] [Current]
Feedback Forum

Post a new message
Dataseries X:
10872
10625
10407
10463
10556
10646
10702
11353
11346
11451
11964
12574
13031
13812
14544
14931
14886
16005
17064
15168
16050
15839
15137
14954
15648
15305
15579
16348
15928
16171
15937
15713
15594
15683
16438
17032
17696
17745
19394
20148
20108
18584
18441
18391
19178
18079
18483
19644
19195
19650
20830
23595
22937
21814
21928
21777
21383
21467
22052
22680


Summary of computational transaction
Raw Inputview raw input (R code)
Raw Outputview raw output of R engine
Computing time1 seconds
R Server'Gwilym Jenkins' @ 72.249.127.135

\begin{tabular}{lllllllll}
\hline
Summary of computational transaction \tabularnewline
Raw Input & view raw input (R code)  \tabularnewline
Raw Output & view raw output of R engine  \tabularnewline
Computing time & 1 seconds \tabularnewline
R Server & 'Gwilym Jenkins' @ 72.249.127.135 \tabularnewline
\hline
\end{tabular}
%Source: https://freestatistics.org/blog/index.php?pk=60273&T=0

[TABLE]
[ROW][C]Summary of computational transaction[/C][/ROW]
[ROW][C]Raw Input[/C][C]view raw input (R code) [/C][/ROW]
[ROW][C]Raw Output[/C][C]view raw output of R engine [/C][/ROW]
[ROW][C]Computing time[/C][C]1 seconds[/C][/ROW]
[ROW][C]R Server[/C][C]'Gwilym Jenkins' @ 72.249.127.135[/C][/ROW]
[/TABLE]
Source: https://freestatistics.org/blog/index.php?pk=60273&T=0

Globally Unique Identifier (entire table): ba.freestatistics.org/blog/index.php?pk=60273&T=0

As an alternative you can also use a QR Code:  

The GUIDs for individual cells are displayed in the table below:

Summary of computational transaction
Raw Inputview raw input (R code)
Raw Outputview raw output of R engine
Computing time1 seconds
R Server'Gwilym Jenkins' @ 72.249.127.135


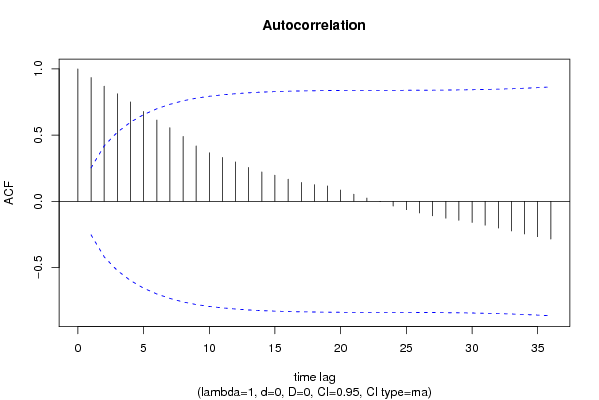
Autocorrelation Function
Time lag kACF(k)T-STATP-value
10.9352697.24460
20.8701986.74050
30.8122616.29170
40.7509125.81650
50.6795985.26411e-06
60.6138174.75466e-06
70.5563584.30953.1e-05
80.4908033.80170.000169
90.418433.24110.000972
100.3669732.84260.003054
110.3320822.57230.006298
120.2981932.30980.012178
130.2561461.98410.025912
140.2221711.72090.045209
150.1979061.5330.065269
160.1674551.29710.099781
170.14261.10460.136877
180.1261260.9770.166254
190.116790.90470.184634
200.0855290.66250.255091
210.0545110.42220.33718
220.0253070.1960.422627
23-0.002866-0.02220.49118
24-0.035136-0.27220.393216
25-0.06244-0.48370.315195
26-0.0878-0.68010.249529
27-0.109283-0.84650.200317
28-0.127099-0.98450.16441
29-0.142883-1.10680.136406
30-0.159112-1.23250.111289
31-0.179412-1.38970.084874
32-0.201394-1.560.062011
33-0.223651-1.73240.044171
34-0.246227-1.90730.030638
35-0.2672-2.06970.021396
36-0.284755-2.20570.015623

\begin{tabular}{lllllllll}
\hline
Autocorrelation Function \tabularnewline
Time lag k & ACF(k) & T-STAT & P-value \tabularnewline
1 & 0.935269 & 7.2446 & 0 \tabularnewline
2 & 0.870198 & 6.7405 & 0 \tabularnewline
3 & 0.812261 & 6.2917 & 0 \tabularnewline
4 & 0.750912 & 5.8165 & 0 \tabularnewline
5 & 0.679598 & 5.2641 & 1e-06 \tabularnewline
6 & 0.613817 & 4.7546 & 6e-06 \tabularnewline
7 & 0.556358 & 4.3095 & 3.1e-05 \tabularnewline
8 & 0.490803 & 3.8017 & 0.000169 \tabularnewline
9 & 0.41843 & 3.2411 & 0.000972 \tabularnewline
10 & 0.366973 & 2.8426 & 0.003054 \tabularnewline
11 & 0.332082 & 2.5723 & 0.006298 \tabularnewline
12 & 0.298193 & 2.3098 & 0.012178 \tabularnewline
13 & 0.256146 & 1.9841 & 0.025912 \tabularnewline
14 & 0.222171 & 1.7209 & 0.045209 \tabularnewline
15 & 0.197906 & 1.533 & 0.065269 \tabularnewline
16 & 0.167455 & 1.2971 & 0.099781 \tabularnewline
17 & 0.1426 & 1.1046 & 0.136877 \tabularnewline
18 & 0.126126 & 0.977 & 0.166254 \tabularnewline
19 & 0.11679 & 0.9047 & 0.184634 \tabularnewline
20 & 0.085529 & 0.6625 & 0.255091 \tabularnewline
21 & 0.054511 & 0.4222 & 0.33718 \tabularnewline
22 & 0.025307 & 0.196 & 0.422627 \tabularnewline
23 & -0.002866 & -0.0222 & 0.49118 \tabularnewline
24 & -0.035136 & -0.2722 & 0.393216 \tabularnewline
25 & -0.06244 & -0.4837 & 0.315195 \tabularnewline
26 & -0.0878 & -0.6801 & 0.249529 \tabularnewline
27 & -0.109283 & -0.8465 & 0.200317 \tabularnewline
28 & -0.127099 & -0.9845 & 0.16441 \tabularnewline
29 & -0.142883 & -1.1068 & 0.136406 \tabularnewline
30 & -0.159112 & -1.2325 & 0.111289 \tabularnewline
31 & -0.179412 & -1.3897 & 0.084874 \tabularnewline
32 & -0.201394 & -1.56 & 0.062011 \tabularnewline
33 & -0.223651 & -1.7324 & 0.044171 \tabularnewline
34 & -0.246227 & -1.9073 & 0.030638 \tabularnewline
35 & -0.2672 & -2.0697 & 0.021396 \tabularnewline
36 & -0.284755 & -2.2057 & 0.015623 \tabularnewline
\hline
\end{tabular}
%Source: https://freestatistics.org/blog/index.php?pk=60273&T=1

[TABLE]
[ROW][C]Autocorrelation Function[/C][/ROW]
[ROW][C]Time lag k[/C][C]ACF(k)[/C][C]T-STAT[/C][C]P-value[/C][/ROW]
[ROW][C]1[/C][C]0.935269[/C][C]7.2446[/C][C]0[/C][/ROW]
[ROW][C]2[/C][C]0.870198[/C][C]6.7405[/C][C]0[/C][/ROW]
[ROW][C]3[/C][C]0.812261[/C][C]6.2917[/C][C]0[/C][/ROW]
[ROW][C]4[/C][C]0.750912[/C][C]5.8165[/C][C]0[/C][/ROW]
[ROW][C]5[/C][C]0.679598[/C][C]5.2641[/C][C]1e-06[/C][/ROW]
[ROW][C]6[/C][C]0.613817[/C][C]4.7546[/C][C]6e-06[/C][/ROW]
[ROW][C]7[/C][C]0.556358[/C][C]4.3095[/C][C]3.1e-05[/C][/ROW]
[ROW][C]8[/C][C]0.490803[/C][C]3.8017[/C][C]0.000169[/C][/ROW]
[ROW][C]9[/C][C]0.41843[/C][C]3.2411[/C][C]0.000972[/C][/ROW]
[ROW][C]10[/C][C]0.366973[/C][C]2.8426[/C][C]0.003054[/C][/ROW]
[ROW][C]11[/C][C]0.332082[/C][C]2.5723[/C][C]0.006298[/C][/ROW]
[ROW][C]12[/C][C]0.298193[/C][C]2.3098[/C][C]0.012178[/C][/ROW]
[ROW][C]13[/C][C]0.256146[/C][C]1.9841[/C][C]0.025912[/C][/ROW]
[ROW][C]14[/C][C]0.222171[/C][C]1.7209[/C][C]0.045209[/C][/ROW]
[ROW][C]15[/C][C]0.197906[/C][C]1.533[/C][C]0.065269[/C][/ROW]
[ROW][C]16[/C][C]0.167455[/C][C]1.2971[/C][C]0.099781[/C][/ROW]
[ROW][C]17[/C][C]0.1426[/C][C]1.1046[/C][C]0.136877[/C][/ROW]
[ROW][C]18[/C][C]0.126126[/C][C]0.977[/C][C]0.166254[/C][/ROW]
[ROW][C]19[/C][C]0.11679[/C][C]0.9047[/C][C]0.184634[/C][/ROW]
[ROW][C]20[/C][C]0.085529[/C][C]0.6625[/C][C]0.255091[/C][/ROW]
[ROW][C]21[/C][C]0.054511[/C][C]0.4222[/C][C]0.33718[/C][/ROW]
[ROW][C]22[/C][C]0.025307[/C][C]0.196[/C][C]0.422627[/C][/ROW]
[ROW][C]23[/C][C]-0.002866[/C][C]-0.0222[/C][C]0.49118[/C][/ROW]
[ROW][C]24[/C][C]-0.035136[/C][C]-0.2722[/C][C]0.393216[/C][/ROW]
[ROW][C]25[/C][C]-0.06244[/C][C]-0.4837[/C][C]0.315195[/C][/ROW]
[ROW][C]26[/C][C]-0.0878[/C][C]-0.6801[/C][C]0.249529[/C][/ROW]
[ROW][C]27[/C][C]-0.109283[/C][C]-0.8465[/C][C]0.200317[/C][/ROW]
[ROW][C]28[/C][C]-0.127099[/C][C]-0.9845[/C][C]0.16441[/C][/ROW]
[ROW][C]29[/C][C]-0.142883[/C][C]-1.1068[/C][C]0.136406[/C][/ROW]
[ROW][C]30[/C][C]-0.159112[/C][C]-1.2325[/C][C]0.111289[/C][/ROW]
[ROW][C]31[/C][C]-0.179412[/C][C]-1.3897[/C][C]0.084874[/C][/ROW]
[ROW][C]32[/C][C]-0.201394[/C][C]-1.56[/C][C]0.062011[/C][/ROW]
[ROW][C]33[/C][C]-0.223651[/C][C]-1.7324[/C][C]0.044171[/C][/ROW]
[ROW][C]34[/C][C]-0.246227[/C][C]-1.9073[/C][C]0.030638[/C][/ROW]
[ROW][C]35[/C][C]-0.2672[/C][C]-2.0697[/C][C]0.021396[/C][/ROW]
[ROW][C]36[/C][C]-0.284755[/C][C]-2.2057[/C][C]0.015623[/C][/ROW]
[/TABLE]
Source: https://freestatistics.org/blog/index.php?pk=60273&T=1

Globally Unique Identifier (entire table): ba.freestatistics.org/blog/index.php?pk=60273&T=1

As an alternative you can also use a QR Code:  

The GUIDs for individual cells are displayed in the table below:

Autocorrelation Function
Time lag kACF(k)T-STATP-value
10.9352697.24460
20.8701986.74050
30.8122616.29170
40.7509125.81650
50.6795985.26411e-06
60.6138174.75466e-06
70.5563584.30953.1e-05
80.4908033.80170.000169
90.418433.24110.000972
100.3669732.84260.003054
110.3320822.57230.006298
120.2981932.30980.012178
130.2561461.98410.025912
140.2221711.72090.045209
150.1979061.5330.065269
160.1674551.29710.099781
170.14261.10460.136877
180.1261260.9770.166254
190.116790.90470.184634
200.0855290.66250.255091
210.0545110.42220.33718
220.0253070.1960.422627
23-0.002866-0.02220.49118
24-0.035136-0.27220.393216
25-0.06244-0.48370.315195
26-0.0878-0.68010.249529
27-0.109283-0.84650.200317
28-0.127099-0.98450.16441
29-0.142883-1.10680.136406
30-0.159112-1.23250.111289
31-0.179412-1.38970.084874
32-0.201394-1.560.062011
33-0.223651-1.73240.044171
34-0.246227-1.90730.030638
35-0.2672-2.06970.021396
36-0.284755-2.20570.015623


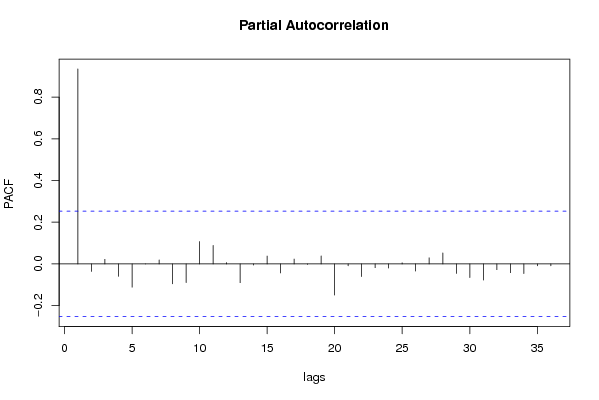
Partial Autocorrelation Function
Time lag kPACF(k)T-STATP-value
10.9352697.24460
2-0.036157-0.28010.390192
30.0222280.17220.43194
4-0.05975-0.46280.322583
5-0.111743-0.86560.195091
6-6.5e-05-5e-040.4998
70.018870.14620.442141
8-0.095404-0.7390.231396
9-0.089378-0.69230.245703
100.1074780.83250.204208
110.0884050.68480.24806
120.0065550.05080.479838
13-0.089887-0.69630.244476
14-0.005358-0.04150.483517
150.0375050.29050.386212
16-0.043596-0.33770.368386
170.0229640.17790.429708
18-0.002335-0.01810.492815
190.0383440.2970.383742
20-0.149576-1.15860.125603
21-0.009227-0.07150.471631
22-0.060522-0.46880.320455
23-0.018293-0.14170.443898
24-0.019802-0.15340.439303
250.0050050.03880.484603
26-0.034281-0.26550.395752
270.0294220.22790.41025
280.0527350.40850.342187
29-0.045695-0.3540.362308
30-0.065562-0.50780.306713
31-0.077598-0.60110.275027
32-0.027461-0.21270.416137
33-0.04188-0.32440.373381
34-0.046112-0.35720.361104
35-0.009067-0.07020.47212
36-0.009237-0.07150.4716

\begin{tabular}{lllllllll}
\hline
Partial Autocorrelation Function \tabularnewline
Time lag k & PACF(k) & T-STAT & P-value \tabularnewline
1 & 0.935269 & 7.2446 & 0 \tabularnewline
2 & -0.036157 & -0.2801 & 0.390192 \tabularnewline
3 & 0.022228 & 0.1722 & 0.43194 \tabularnewline
4 & -0.05975 & -0.4628 & 0.322583 \tabularnewline
5 & -0.111743 & -0.8656 & 0.195091 \tabularnewline
6 & -6.5e-05 & -5e-04 & 0.4998 \tabularnewline
7 & 0.01887 & 0.1462 & 0.442141 \tabularnewline
8 & -0.095404 & -0.739 & 0.231396 \tabularnewline
9 & -0.089378 & -0.6923 & 0.245703 \tabularnewline
10 & 0.107478 & 0.8325 & 0.204208 \tabularnewline
11 & 0.088405 & 0.6848 & 0.24806 \tabularnewline
12 & 0.006555 & 0.0508 & 0.479838 \tabularnewline
13 & -0.089887 & -0.6963 & 0.244476 \tabularnewline
14 & -0.005358 & -0.0415 & 0.483517 \tabularnewline
15 & 0.037505 & 0.2905 & 0.386212 \tabularnewline
16 & -0.043596 & -0.3377 & 0.368386 \tabularnewline
17 & 0.022964 & 0.1779 & 0.429708 \tabularnewline
18 & -0.002335 & -0.0181 & 0.492815 \tabularnewline
19 & 0.038344 & 0.297 & 0.383742 \tabularnewline
20 & -0.149576 & -1.1586 & 0.125603 \tabularnewline
21 & -0.009227 & -0.0715 & 0.471631 \tabularnewline
22 & -0.060522 & -0.4688 & 0.320455 \tabularnewline
23 & -0.018293 & -0.1417 & 0.443898 \tabularnewline
24 & -0.019802 & -0.1534 & 0.439303 \tabularnewline
25 & 0.005005 & 0.0388 & 0.484603 \tabularnewline
26 & -0.034281 & -0.2655 & 0.395752 \tabularnewline
27 & 0.029422 & 0.2279 & 0.41025 \tabularnewline
28 & 0.052735 & 0.4085 & 0.342187 \tabularnewline
29 & -0.045695 & -0.354 & 0.362308 \tabularnewline
30 & -0.065562 & -0.5078 & 0.306713 \tabularnewline
31 & -0.077598 & -0.6011 & 0.275027 \tabularnewline
32 & -0.027461 & -0.2127 & 0.416137 \tabularnewline
33 & -0.04188 & -0.3244 & 0.373381 \tabularnewline
34 & -0.046112 & -0.3572 & 0.361104 \tabularnewline
35 & -0.009067 & -0.0702 & 0.47212 \tabularnewline
36 & -0.009237 & -0.0715 & 0.4716 \tabularnewline
\hline
\end{tabular}
%Source: https://freestatistics.org/blog/index.php?pk=60273&T=2

[TABLE]
[ROW][C]Partial Autocorrelation Function[/C][/ROW]
[ROW][C]Time lag k[/C][C]PACF(k)[/C][C]T-STAT[/C][C]P-value[/C][/ROW]
[ROW][C]1[/C][C]0.935269[/C][C]7.2446[/C][C]0[/C][/ROW]
[ROW][C]2[/C][C]-0.036157[/C][C]-0.2801[/C][C]0.390192[/C][/ROW]
[ROW][C]3[/C][C]0.022228[/C][C]0.1722[/C][C]0.43194[/C][/ROW]
[ROW][C]4[/C][C]-0.05975[/C][C]-0.4628[/C][C]0.322583[/C][/ROW]
[ROW][C]5[/C][C]-0.111743[/C][C]-0.8656[/C][C]0.195091[/C][/ROW]
[ROW][C]6[/C][C]-6.5e-05[/C][C]-5e-04[/C][C]0.4998[/C][/ROW]
[ROW][C]7[/C][C]0.01887[/C][C]0.1462[/C][C]0.442141[/C][/ROW]
[ROW][C]8[/C][C]-0.095404[/C][C]-0.739[/C][C]0.231396[/C][/ROW]
[ROW][C]9[/C][C]-0.089378[/C][C]-0.6923[/C][C]0.245703[/C][/ROW]
[ROW][C]10[/C][C]0.107478[/C][C]0.8325[/C][C]0.204208[/C][/ROW]
[ROW][C]11[/C][C]0.088405[/C][C]0.6848[/C][C]0.24806[/C][/ROW]
[ROW][C]12[/C][C]0.006555[/C][C]0.0508[/C][C]0.479838[/C][/ROW]
[ROW][C]13[/C][C]-0.089887[/C][C]-0.6963[/C][C]0.244476[/C][/ROW]
[ROW][C]14[/C][C]-0.005358[/C][C]-0.0415[/C][C]0.483517[/C][/ROW]
[ROW][C]15[/C][C]0.037505[/C][C]0.2905[/C][C]0.386212[/C][/ROW]
[ROW][C]16[/C][C]-0.043596[/C][C]-0.3377[/C][C]0.368386[/C][/ROW]
[ROW][C]17[/C][C]0.022964[/C][C]0.1779[/C][C]0.429708[/C][/ROW]
[ROW][C]18[/C][C]-0.002335[/C][C]-0.0181[/C][C]0.492815[/C][/ROW]
[ROW][C]19[/C][C]0.038344[/C][C]0.297[/C][C]0.383742[/C][/ROW]
[ROW][C]20[/C][C]-0.149576[/C][C]-1.1586[/C][C]0.125603[/C][/ROW]
[ROW][C]21[/C][C]-0.009227[/C][C]-0.0715[/C][C]0.471631[/C][/ROW]
[ROW][C]22[/C][C]-0.060522[/C][C]-0.4688[/C][C]0.320455[/C][/ROW]
[ROW][C]23[/C][C]-0.018293[/C][C]-0.1417[/C][C]0.443898[/C][/ROW]
[ROW][C]24[/C][C]-0.019802[/C][C]-0.1534[/C][C]0.439303[/C][/ROW]
[ROW][C]25[/C][C]0.005005[/C][C]0.0388[/C][C]0.484603[/C][/ROW]
[ROW][C]26[/C][C]-0.034281[/C][C]-0.2655[/C][C]0.395752[/C][/ROW]
[ROW][C]27[/C][C]0.029422[/C][C]0.2279[/C][C]0.41025[/C][/ROW]
[ROW][C]28[/C][C]0.052735[/C][C]0.4085[/C][C]0.342187[/C][/ROW]
[ROW][C]29[/C][C]-0.045695[/C][C]-0.354[/C][C]0.362308[/C][/ROW]
[ROW][C]30[/C][C]-0.065562[/C][C]-0.5078[/C][C]0.306713[/C][/ROW]
[ROW][C]31[/C][C]-0.077598[/C][C]-0.6011[/C][C]0.275027[/C][/ROW]
[ROW][C]32[/C][C]-0.027461[/C][C]-0.2127[/C][C]0.416137[/C][/ROW]
[ROW][C]33[/C][C]-0.04188[/C][C]-0.3244[/C][C]0.373381[/C][/ROW]
[ROW][C]34[/C][C]-0.046112[/C][C]-0.3572[/C][C]0.361104[/C][/ROW]
[ROW][C]35[/C][C]-0.009067[/C][C]-0.0702[/C][C]0.47212[/C][/ROW]
[ROW][C]36[/C][C]-0.009237[/C][C]-0.0715[/C][C]0.4716[/C][/ROW]
[/TABLE]
Source: https://freestatistics.org/blog/index.php?pk=60273&T=2

Globally Unique Identifier (entire table): ba.freestatistics.org/blog/index.php?pk=60273&T=2

As an alternative you can also use a QR Code:  

The GUIDs for individual cells are displayed in the table below:

Partial Autocorrelation Function
Time lag kPACF(k)T-STATP-value
10.9352697.24460
2-0.036157-0.28010.390192
30.0222280.17220.43194
4-0.05975-0.46280.322583
5-0.111743-0.86560.195091
6-6.5e-05-5e-040.4998
70.018870.14620.442141
8-0.095404-0.7390.231396
9-0.089378-0.69230.245703
100.1074780.83250.204208
110.0884050.68480.24806
120.0065550.05080.479838
13-0.089887-0.69630.244476
14-0.005358-0.04150.483517
150.0375050.29050.386212
16-0.043596-0.33770.368386
170.0229640.17790.429708
18-0.002335-0.01810.492815
190.0383440.2970.383742
20-0.149576-1.15860.125603
21-0.009227-0.07150.471631
22-0.060522-0.46880.320455
23-0.018293-0.14170.443898
24-0.019802-0.15340.439303
250.0050050.03880.484603
26-0.034281-0.26550.395752
270.0294220.22790.41025
280.0527350.40850.342187
29-0.045695-0.3540.362308
30-0.065562-0.50780.306713
31-0.077598-0.60110.275027
32-0.027461-0.21270.416137
33-0.04188-0.32440.373381
34-0.046112-0.35720.361104
35-0.009067-0.07020.47212
36-0.009237-0.07150.4716


Parameters (Session):
par1 = 36 ; par2 = 1 ; par3 = 0 ; par4 = 0 ; par5 = 12 ; par6 = MA ; par7 = 0.95 ;
Parameters (R input):
par1 = 36 ; par2 = 1 ; par3 = 0 ; par4 = 0 ; par5 = 12 ; par6 = MA ; par7 = 0.95 ;
R code (references can be found in the software module):
if (par1 == 'Default') {
par1 = 10*log10(length(x))
} else {
par1 <- as.numeric(par1)
}
par2 <- as.numeric(par2)
par3 <- as.numeric(par3)
par4 <- as.numeric(par4)
par5 <- as.numeric(par5)
if (par6 == 'White Noise') par6 <- 'white' else par6 <- 'ma'
par7 <- as.numeric(par7)
if (par2 == 0) {
x <- log(x)
} else {
x <- (x ^ par2 - 1) / par2
}
if (par3 > 0) x <- diff(x,lag=1,difference=par3)
if (par4 > 0) x <- diff(x,lag=par5,difference=par4)
bitmap(file='pic1.png')
racf <- acf(x, par1, main='Autocorrelation', xlab='time lag', ylab='ACF', ci.type=par6, ci=par7, sub=paste('(lambda=',par2,', d=',par3,', D=',par4,', CI=', par7, ', CI type=',par6,')',sep=''))
dev.off()
bitmap(file='pic2.png')
rpacf <- pacf(x,par1,main='Partial Autocorrelation',xlab='lags',ylab='PACF')
dev.off()
(myacf <- c(racf$acf))
(mypacf <- c(rpacf$acf))
lengthx <- length(x)
sqrtn <- sqrt(lengthx)
load(file='createtable')
a<-table.start()
a<-table.row.start(a)
a<-table.element(a,'Autocorrelation Function',4,TRUE)
a<-table.row.end(a)
a<-table.row.start(a)
a<-table.element(a,'Time lag k',header=TRUE)
a<-table.element(a,hyperlink('basics.htm','ACF(k)','click here for more information about the Autocorrelation Function'),header=TRUE)
a<-table.element(a,'T-STAT',header=TRUE)
a<-table.element(a,'P-value',header=TRUE)
a<-table.row.end(a)
for (i in 2:(par1+1)) {
a<-table.row.start(a)
a<-table.element(a,i-1,header=TRUE)
a<-table.element(a,round(myacf[i],6))
mytstat <- myacf[i]*sqrtn
a<-table.element(a,round(mytstat,4))
a<-table.element(a,round(1-pt(abs(mytstat),lengthx),6))
a<-table.row.end(a)
}
a<-table.end(a)
table.save(a,file='mytable.tab')
a<-table.start()
a<-table.row.start(a)
a<-table.element(a,'Partial Autocorrelation Function',4,TRUE)
a<-table.row.end(a)
a<-table.row.start(a)
a<-table.element(a,'Time lag k',header=TRUE)
a<-table.element(a,hyperlink('basics.htm','PACF(k)','click here for more information about the Partial Autocorrelation Function'),header=TRUE)
a<-table.element(a,'T-STAT',header=TRUE)
a<-table.element(a,'P-value',header=TRUE)
a<-table.row.end(a)
for (i in 1:par1) {
a<-table.row.start(a)
a<-table.element(a,i,header=TRUE)
a<-table.element(a,round(mypacf[i],6))
mytstat <- mypacf[i]*sqrtn
a<-table.element(a,round(mytstat,4))
a<-table.element(a,round(1-pt(abs(mytstat),lengthx),6))
a<-table.row.end(a)
}
a<-table.end(a)
table.save(a,file='mytable1.tab')