Free Statistics

of Irreproducible Research!

Author's title

Author*The author of this computation has been verified*
R Software Modulerwasp_autocorrelation.wasp
Title produced by software(Partial) Autocorrelation Function
Date of computationThu, 26 Nov 2009 12:15:04 -0700
Cite this page as followsStatistical Computations at FreeStatistics.org, Office for Research Development and Education, URL https://freestatistics.org/blog/index.php?v=date/2009/Nov/26/t12592630014vbww5yh34ytaxp.htm/, Retrieved Sun, 28 Apr 2024 22:23:57 +0000
Statistical Computations at FreeStatistics.org, Office for Research Development and Education, URL https://freestatistics.org/blog/index.php?pk=60304, Retrieved Sun, 28 Apr 2024 22:23:57 +0000
QR Codes:

Original text written by user:
IsPrivate?No (this computation is public)
User-defined keywords
Estimated Impact106
Family? (F = Feedback message, R = changed R code, M = changed R Module, P = changed Parameters, D = changed Data)
-     [Univariate Explorative Data Analysis] [Run Sequence gebo...] [2008-12-12 13:32:37] [76963dc1903f0f612b6153510a3818cf]
- R  D  [Univariate Explorative Data Analysis] [Run Sequence gebo...] [2008-12-17 12:14:40] [76963dc1903f0f612b6153510a3818cf]
-         [Univariate Explorative Data Analysis] [Run Sequence Plot...] [2008-12-22 18:19:51] [1ce0d16c8f4225c977b42c8fa93bc163]
- RMP       [(Partial) Autocorrelation Function] [Identifying Integ...] [2009-11-22 12:26:39] [b98453cac15ba1066b407e146608df68]
-   PD          [(Partial) Autocorrelation Function] [] [2009-11-26 19:15:04] [aa8eb70c35ea8a87edcd21d6427e653e] [Current]
Feedback Forum

Post a new message
Dataseries X:
10872
10625
10407
10463
10556
10646
10702
11353
11346
11451
11964
12574
13031
13812
14544
14931
14886
16005
17064
15168
16050
15839
15137
14954
15648
15305
15579
16348
15928
16171
15937
15713
15594
15683
16438
17032
17696
17745
19394
20148
20108
18584
18441
18391
19178
18079
18483
19644
19195
19650
20830
23595
22937
21814
21928
21777
21383
21467
22052
22680


Summary of computational transaction
Raw Inputview raw input (R code)
Raw Outputview raw output of R engine
Computing time1 seconds
R Server'Gwilym Jenkins' @ 72.249.127.135

\begin{tabular}{lllllllll}
\hline
Summary of computational transaction \tabularnewline
Raw Input & view raw input (R code)  \tabularnewline
Raw Output & view raw output of R engine  \tabularnewline
Computing time & 1 seconds \tabularnewline
R Server & 'Gwilym Jenkins' @ 72.249.127.135 \tabularnewline
\hline
\end{tabular}
%Source: https://freestatistics.org/blog/index.php?pk=60304&T=0

[TABLE]
[ROW][C]Summary of computational transaction[/C][/ROW]
[ROW][C]Raw Input[/C][C]view raw input (R code) [/C][/ROW]
[ROW][C]Raw Output[/C][C]view raw output of R engine [/C][/ROW]
[ROW][C]Computing time[/C][C]1 seconds[/C][/ROW]
[ROW][C]R Server[/C][C]'Gwilym Jenkins' @ 72.249.127.135[/C][/ROW]
[/TABLE]
Source: https://freestatistics.org/blog/index.php?pk=60304&T=0

Globally Unique Identifier (entire table): ba.freestatistics.org/blog/index.php?pk=60304&T=0

As an alternative you can also use a QR Code:  

The GUIDs for individual cells are displayed in the table below:

Summary of computational transaction
Raw Inputview raw input (R code)
Raw Outputview raw output of R engine
Computing time1 seconds
R Server'Gwilym Jenkins' @ 72.249.127.135


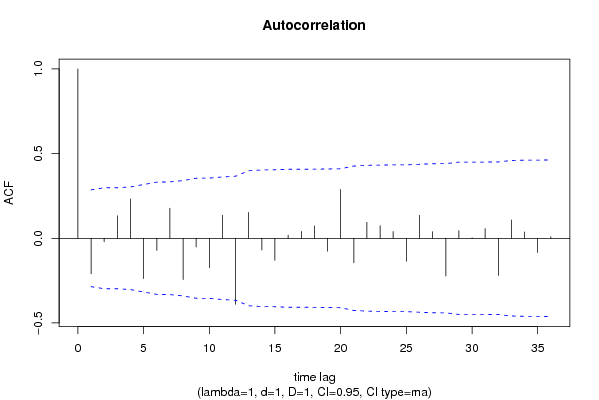
Autocorrelation Function
Time lag kACF(k)T-STATP-value
1-0.210373-1.44220.077932
2-0.020828-0.14280.443533
30.1325960.9090.183985
40.232021.59060.059197
5-0.238489-1.6350.054365
6-0.072038-0.49390.311849
70.1778031.2190.114472
8-0.244304-1.67490.050302
9-0.051329-0.35190.363244
10-0.173843-1.19180.11966
110.1361010.93310.177779
12-0.389956-2.67340.005146
130.1522021.04340.15104
14-0.069064-0.47350.319033
15-0.130021-0.89140.188633
160.0177140.12140.451928
170.0400480.27460.392432
180.0727010.49840.310259
19-0.076558-0.52490.301076
200.2883251.97670.026982
21-0.144114-0.9880.164106
220.0939910.64440.261233
230.0743010.50940.306434
240.0395880.27140.393635
25-0.135261-0.92730.179253
260.1356760.93020.178523
270.0386980.26530.39597
28-0.223623-1.53310.06598
290.0444990.30510.380831
300.002570.01760.493009
310.0574360.39380.34777
32-0.218622-1.49880.070307
330.1081120.74120.231136
340.036990.25360.400458
35-0.083878-0.5750.284005
360.0095540.06550.474028

\begin{tabular}{lllllllll}
\hline
Autocorrelation Function \tabularnewline
Time lag k & ACF(k) & T-STAT & P-value \tabularnewline
1 & -0.210373 & -1.4422 & 0.077932 \tabularnewline
2 & -0.020828 & -0.1428 & 0.443533 \tabularnewline
3 & 0.132596 & 0.909 & 0.183985 \tabularnewline
4 & 0.23202 & 1.5906 & 0.059197 \tabularnewline
5 & -0.238489 & -1.635 & 0.054365 \tabularnewline
6 & -0.072038 & -0.4939 & 0.311849 \tabularnewline
7 & 0.177803 & 1.219 & 0.114472 \tabularnewline
8 & -0.244304 & -1.6749 & 0.050302 \tabularnewline
9 & -0.051329 & -0.3519 & 0.363244 \tabularnewline
10 & -0.173843 & -1.1918 & 0.11966 \tabularnewline
11 & 0.136101 & 0.9331 & 0.177779 \tabularnewline
12 & -0.389956 & -2.6734 & 0.005146 \tabularnewline
13 & 0.152202 & 1.0434 & 0.15104 \tabularnewline
14 & -0.069064 & -0.4735 & 0.319033 \tabularnewline
15 & -0.130021 & -0.8914 & 0.188633 \tabularnewline
16 & 0.017714 & 0.1214 & 0.451928 \tabularnewline
17 & 0.040048 & 0.2746 & 0.392432 \tabularnewline
18 & 0.072701 & 0.4984 & 0.310259 \tabularnewline
19 & -0.076558 & -0.5249 & 0.301076 \tabularnewline
20 & 0.288325 & 1.9767 & 0.026982 \tabularnewline
21 & -0.144114 & -0.988 & 0.164106 \tabularnewline
22 & 0.093991 & 0.6444 & 0.261233 \tabularnewline
23 & 0.074301 & 0.5094 & 0.306434 \tabularnewline
24 & 0.039588 & 0.2714 & 0.393635 \tabularnewline
25 & -0.135261 & -0.9273 & 0.179253 \tabularnewline
26 & 0.135676 & 0.9302 & 0.178523 \tabularnewline
27 & 0.038698 & 0.2653 & 0.39597 \tabularnewline
28 & -0.223623 & -1.5331 & 0.06598 \tabularnewline
29 & 0.044499 & 0.3051 & 0.380831 \tabularnewline
30 & 0.00257 & 0.0176 & 0.493009 \tabularnewline
31 & 0.057436 & 0.3938 & 0.34777 \tabularnewline
32 & -0.218622 & -1.4988 & 0.070307 \tabularnewline
33 & 0.108112 & 0.7412 & 0.231136 \tabularnewline
34 & 0.03699 & 0.2536 & 0.400458 \tabularnewline
35 & -0.083878 & -0.575 & 0.284005 \tabularnewline
36 & 0.009554 & 0.0655 & 0.474028 \tabularnewline
\hline
\end{tabular}
%Source: https://freestatistics.org/blog/index.php?pk=60304&T=1

[TABLE]
[ROW][C]Autocorrelation Function[/C][/ROW]
[ROW][C]Time lag k[/C][C]ACF(k)[/C][C]T-STAT[/C][C]P-value[/C][/ROW]
[ROW][C]1[/C][C]-0.210373[/C][C]-1.4422[/C][C]0.077932[/C][/ROW]
[ROW][C]2[/C][C]-0.020828[/C][C]-0.1428[/C][C]0.443533[/C][/ROW]
[ROW][C]3[/C][C]0.132596[/C][C]0.909[/C][C]0.183985[/C][/ROW]
[ROW][C]4[/C][C]0.23202[/C][C]1.5906[/C][C]0.059197[/C][/ROW]
[ROW][C]5[/C][C]-0.238489[/C][C]-1.635[/C][C]0.054365[/C][/ROW]
[ROW][C]6[/C][C]-0.072038[/C][C]-0.4939[/C][C]0.311849[/C][/ROW]
[ROW][C]7[/C][C]0.177803[/C][C]1.219[/C][C]0.114472[/C][/ROW]
[ROW][C]8[/C][C]-0.244304[/C][C]-1.6749[/C][C]0.050302[/C][/ROW]
[ROW][C]9[/C][C]-0.051329[/C][C]-0.3519[/C][C]0.363244[/C][/ROW]
[ROW][C]10[/C][C]-0.173843[/C][C]-1.1918[/C][C]0.11966[/C][/ROW]
[ROW][C]11[/C][C]0.136101[/C][C]0.9331[/C][C]0.177779[/C][/ROW]
[ROW][C]12[/C][C]-0.389956[/C][C]-2.6734[/C][C]0.005146[/C][/ROW]
[ROW][C]13[/C][C]0.152202[/C][C]1.0434[/C][C]0.15104[/C][/ROW]
[ROW][C]14[/C][C]-0.069064[/C][C]-0.4735[/C][C]0.319033[/C][/ROW]
[ROW][C]15[/C][C]-0.130021[/C][C]-0.8914[/C][C]0.188633[/C][/ROW]
[ROW][C]16[/C][C]0.017714[/C][C]0.1214[/C][C]0.451928[/C][/ROW]
[ROW][C]17[/C][C]0.040048[/C][C]0.2746[/C][C]0.392432[/C][/ROW]
[ROW][C]18[/C][C]0.072701[/C][C]0.4984[/C][C]0.310259[/C][/ROW]
[ROW][C]19[/C][C]-0.076558[/C][C]-0.5249[/C][C]0.301076[/C][/ROW]
[ROW][C]20[/C][C]0.288325[/C][C]1.9767[/C][C]0.026982[/C][/ROW]
[ROW][C]21[/C][C]-0.144114[/C][C]-0.988[/C][C]0.164106[/C][/ROW]
[ROW][C]22[/C][C]0.093991[/C][C]0.6444[/C][C]0.261233[/C][/ROW]
[ROW][C]23[/C][C]0.074301[/C][C]0.5094[/C][C]0.306434[/C][/ROW]
[ROW][C]24[/C][C]0.039588[/C][C]0.2714[/C][C]0.393635[/C][/ROW]
[ROW][C]25[/C][C]-0.135261[/C][C]-0.9273[/C][C]0.179253[/C][/ROW]
[ROW][C]26[/C][C]0.135676[/C][C]0.9302[/C][C]0.178523[/C][/ROW]
[ROW][C]27[/C][C]0.038698[/C][C]0.2653[/C][C]0.39597[/C][/ROW]
[ROW][C]28[/C][C]-0.223623[/C][C]-1.5331[/C][C]0.06598[/C][/ROW]
[ROW][C]29[/C][C]0.044499[/C][C]0.3051[/C][C]0.380831[/C][/ROW]
[ROW][C]30[/C][C]0.00257[/C][C]0.0176[/C][C]0.493009[/C][/ROW]
[ROW][C]31[/C][C]0.057436[/C][C]0.3938[/C][C]0.34777[/C][/ROW]
[ROW][C]32[/C][C]-0.218622[/C][C]-1.4988[/C][C]0.070307[/C][/ROW]
[ROW][C]33[/C][C]0.108112[/C][C]0.7412[/C][C]0.231136[/C][/ROW]
[ROW][C]34[/C][C]0.03699[/C][C]0.2536[/C][C]0.400458[/C][/ROW]
[ROW][C]35[/C][C]-0.083878[/C][C]-0.575[/C][C]0.284005[/C][/ROW]
[ROW][C]36[/C][C]0.009554[/C][C]0.0655[/C][C]0.474028[/C][/ROW]
[/TABLE]
Source: https://freestatistics.org/blog/index.php?pk=60304&T=1

Globally Unique Identifier (entire table): ba.freestatistics.org/blog/index.php?pk=60304&T=1

As an alternative you can also use a QR Code:  

The GUIDs for individual cells are displayed in the table below:

Autocorrelation Function
Time lag kACF(k)T-STATP-value
1-0.210373-1.44220.077932
2-0.020828-0.14280.443533
30.1325960.9090.183985
40.232021.59060.059197
5-0.238489-1.6350.054365
6-0.072038-0.49390.311849
70.1778031.2190.114472
8-0.244304-1.67490.050302
9-0.051329-0.35190.363244
10-0.173843-1.19180.11966
110.1361010.93310.177779
12-0.389956-2.67340.005146
130.1522021.04340.15104
14-0.069064-0.47350.319033
15-0.130021-0.89140.188633
160.0177140.12140.451928
170.0400480.27460.392432
180.0727010.49840.310259
19-0.076558-0.52490.301076
200.2883251.97670.026982
21-0.144114-0.9880.164106
220.0939910.64440.261233
230.0743010.50940.306434
240.0395880.27140.393635
25-0.135261-0.92730.179253
260.1356760.93020.178523
270.0386980.26530.39597
28-0.223623-1.53310.06598
290.0444990.30510.380831
300.002570.01760.493009
310.0574360.39380.34777
32-0.218622-1.49880.070307
330.1081120.74120.231136
340.036990.25360.400458
35-0.083878-0.5750.284005
360.0095540.06550.474028


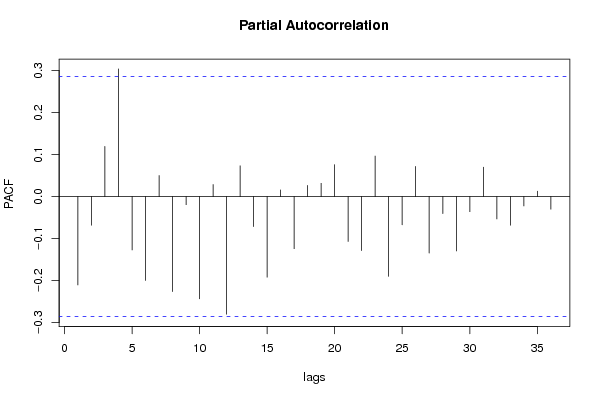
Partial Autocorrelation Function
Time lag kPACF(k)T-STATP-value
1-0.210373-1.44220.077932
2-0.068099-0.46690.321378
30.1194030.81860.208576
40.3039152.08350.021333
5-0.127147-0.87170.193908
6-0.199539-1.3680.088913
70.0501150.34360.366351
8-0.226208-1.55080.063828
9-0.019283-0.13220.447695
10-0.243343-1.66830.050955
110.0285560.19580.422818
12-0.28005-1.91990.030474
130.073240.50210.308969
14-0.071392-0.48940.313403
15-0.192017-1.31640.097211
160.015960.10940.456669
17-0.124012-0.85020.199766
180.0264270.18120.428505
190.0314890.21590.415008
200.0759330.52060.302554
21-0.106924-0.7330.233589
22-0.128485-0.88080.191442
230.0965820.66210.255559
24-0.189767-1.3010.099805
25-0.067286-0.46130.32336
260.0719190.4930.312137
27-0.134407-0.92140.180762
28-0.04055-0.2780.391117
29-0.129364-0.88690.189831
30-0.035831-0.24560.403514
310.0699850.47980.316799
32-0.053235-0.3650.358389
33-0.067977-0.4660.321674
34-0.022121-0.15170.440055
350.0128870.08830.464988
36-0.030131-0.20660.418619

\begin{tabular}{lllllllll}
\hline
Partial Autocorrelation Function \tabularnewline
Time lag k & PACF(k) & T-STAT & P-value \tabularnewline
1 & -0.210373 & -1.4422 & 0.077932 \tabularnewline
2 & -0.068099 & -0.4669 & 0.321378 \tabularnewline
3 & 0.119403 & 0.8186 & 0.208576 \tabularnewline
4 & 0.303915 & 2.0835 & 0.021333 \tabularnewline
5 & -0.127147 & -0.8717 & 0.193908 \tabularnewline
6 & -0.199539 & -1.368 & 0.088913 \tabularnewline
7 & 0.050115 & 0.3436 & 0.366351 \tabularnewline
8 & -0.226208 & -1.5508 & 0.063828 \tabularnewline
9 & -0.019283 & -0.1322 & 0.447695 \tabularnewline
10 & -0.243343 & -1.6683 & 0.050955 \tabularnewline
11 & 0.028556 & 0.1958 & 0.422818 \tabularnewline
12 & -0.28005 & -1.9199 & 0.030474 \tabularnewline
13 & 0.07324 & 0.5021 & 0.308969 \tabularnewline
14 & -0.071392 & -0.4894 & 0.313403 \tabularnewline
15 & -0.192017 & -1.3164 & 0.097211 \tabularnewline
16 & 0.01596 & 0.1094 & 0.456669 \tabularnewline
17 & -0.124012 & -0.8502 & 0.199766 \tabularnewline
18 & 0.026427 & 0.1812 & 0.428505 \tabularnewline
19 & 0.031489 & 0.2159 & 0.415008 \tabularnewline
20 & 0.075933 & 0.5206 & 0.302554 \tabularnewline
21 & -0.106924 & -0.733 & 0.233589 \tabularnewline
22 & -0.128485 & -0.8808 & 0.191442 \tabularnewline
23 & 0.096582 & 0.6621 & 0.255559 \tabularnewline
24 & -0.189767 & -1.301 & 0.099805 \tabularnewline
25 & -0.067286 & -0.4613 & 0.32336 \tabularnewline
26 & 0.071919 & 0.493 & 0.312137 \tabularnewline
27 & -0.134407 & -0.9214 & 0.180762 \tabularnewline
28 & -0.04055 & -0.278 & 0.391117 \tabularnewline
29 & -0.129364 & -0.8869 & 0.189831 \tabularnewline
30 & -0.035831 & -0.2456 & 0.403514 \tabularnewline
31 & 0.069985 & 0.4798 & 0.316799 \tabularnewline
32 & -0.053235 & -0.365 & 0.358389 \tabularnewline
33 & -0.067977 & -0.466 & 0.321674 \tabularnewline
34 & -0.022121 & -0.1517 & 0.440055 \tabularnewline
35 & 0.012887 & 0.0883 & 0.464988 \tabularnewline
36 & -0.030131 & -0.2066 & 0.418619 \tabularnewline
\hline
\end{tabular}
%Source: https://freestatistics.org/blog/index.php?pk=60304&T=2

[TABLE]
[ROW][C]Partial Autocorrelation Function[/C][/ROW]
[ROW][C]Time lag k[/C][C]PACF(k)[/C][C]T-STAT[/C][C]P-value[/C][/ROW]
[ROW][C]1[/C][C]-0.210373[/C][C]-1.4422[/C][C]0.077932[/C][/ROW]
[ROW][C]2[/C][C]-0.068099[/C][C]-0.4669[/C][C]0.321378[/C][/ROW]
[ROW][C]3[/C][C]0.119403[/C][C]0.8186[/C][C]0.208576[/C][/ROW]
[ROW][C]4[/C][C]0.303915[/C][C]2.0835[/C][C]0.021333[/C][/ROW]
[ROW][C]5[/C][C]-0.127147[/C][C]-0.8717[/C][C]0.193908[/C][/ROW]
[ROW][C]6[/C][C]-0.199539[/C][C]-1.368[/C][C]0.088913[/C][/ROW]
[ROW][C]7[/C][C]0.050115[/C][C]0.3436[/C][C]0.366351[/C][/ROW]
[ROW][C]8[/C][C]-0.226208[/C][C]-1.5508[/C][C]0.063828[/C][/ROW]
[ROW][C]9[/C][C]-0.019283[/C][C]-0.1322[/C][C]0.447695[/C][/ROW]
[ROW][C]10[/C][C]-0.243343[/C][C]-1.6683[/C][C]0.050955[/C][/ROW]
[ROW][C]11[/C][C]0.028556[/C][C]0.1958[/C][C]0.422818[/C][/ROW]
[ROW][C]12[/C][C]-0.28005[/C][C]-1.9199[/C][C]0.030474[/C][/ROW]
[ROW][C]13[/C][C]0.07324[/C][C]0.5021[/C][C]0.308969[/C][/ROW]
[ROW][C]14[/C][C]-0.071392[/C][C]-0.4894[/C][C]0.313403[/C][/ROW]
[ROW][C]15[/C][C]-0.192017[/C][C]-1.3164[/C][C]0.097211[/C][/ROW]
[ROW][C]16[/C][C]0.01596[/C][C]0.1094[/C][C]0.456669[/C][/ROW]
[ROW][C]17[/C][C]-0.124012[/C][C]-0.8502[/C][C]0.199766[/C][/ROW]
[ROW][C]18[/C][C]0.026427[/C][C]0.1812[/C][C]0.428505[/C][/ROW]
[ROW][C]19[/C][C]0.031489[/C][C]0.2159[/C][C]0.415008[/C][/ROW]
[ROW][C]20[/C][C]0.075933[/C][C]0.5206[/C][C]0.302554[/C][/ROW]
[ROW][C]21[/C][C]-0.106924[/C][C]-0.733[/C][C]0.233589[/C][/ROW]
[ROW][C]22[/C][C]-0.128485[/C][C]-0.8808[/C][C]0.191442[/C][/ROW]
[ROW][C]23[/C][C]0.096582[/C][C]0.6621[/C][C]0.255559[/C][/ROW]
[ROW][C]24[/C][C]-0.189767[/C][C]-1.301[/C][C]0.099805[/C][/ROW]
[ROW][C]25[/C][C]-0.067286[/C][C]-0.4613[/C][C]0.32336[/C][/ROW]
[ROW][C]26[/C][C]0.071919[/C][C]0.493[/C][C]0.312137[/C][/ROW]
[ROW][C]27[/C][C]-0.134407[/C][C]-0.9214[/C][C]0.180762[/C][/ROW]
[ROW][C]28[/C][C]-0.04055[/C][C]-0.278[/C][C]0.391117[/C][/ROW]
[ROW][C]29[/C][C]-0.129364[/C][C]-0.8869[/C][C]0.189831[/C][/ROW]
[ROW][C]30[/C][C]-0.035831[/C][C]-0.2456[/C][C]0.403514[/C][/ROW]
[ROW][C]31[/C][C]0.069985[/C][C]0.4798[/C][C]0.316799[/C][/ROW]
[ROW][C]32[/C][C]-0.053235[/C][C]-0.365[/C][C]0.358389[/C][/ROW]
[ROW][C]33[/C][C]-0.067977[/C][C]-0.466[/C][C]0.321674[/C][/ROW]
[ROW][C]34[/C][C]-0.022121[/C][C]-0.1517[/C][C]0.440055[/C][/ROW]
[ROW][C]35[/C][C]0.012887[/C][C]0.0883[/C][C]0.464988[/C][/ROW]
[ROW][C]36[/C][C]-0.030131[/C][C]-0.2066[/C][C]0.418619[/C][/ROW]
[/TABLE]
Source: https://freestatistics.org/blog/index.php?pk=60304&T=2

Globally Unique Identifier (entire table): ba.freestatistics.org/blog/index.php?pk=60304&T=2

As an alternative you can also use a QR Code:  

The GUIDs for individual cells are displayed in the table below:

Partial Autocorrelation Function
Time lag kPACF(k)T-STATP-value
1-0.210373-1.44220.077932
2-0.068099-0.46690.321378
30.1194030.81860.208576
40.3039152.08350.021333
5-0.127147-0.87170.193908
6-0.199539-1.3680.088913
70.0501150.34360.366351
8-0.226208-1.55080.063828
9-0.019283-0.13220.447695
10-0.243343-1.66830.050955
110.0285560.19580.422818
12-0.28005-1.91990.030474
130.073240.50210.308969
14-0.071392-0.48940.313403
15-0.192017-1.31640.097211
160.015960.10940.456669
17-0.124012-0.85020.199766
180.0264270.18120.428505
190.0314890.21590.415008
200.0759330.52060.302554
21-0.106924-0.7330.233589
22-0.128485-0.88080.191442
230.0965820.66210.255559
24-0.189767-1.3010.099805
25-0.067286-0.46130.32336
260.0719190.4930.312137
27-0.134407-0.92140.180762
28-0.04055-0.2780.391117
29-0.129364-0.88690.189831
30-0.035831-0.24560.403514
310.0699850.47980.316799
32-0.053235-0.3650.358389
33-0.067977-0.4660.321674
34-0.022121-0.15170.440055
350.0128870.08830.464988
36-0.030131-0.20660.418619


Parameters (Session):
par1 = 36 ; par2 = 1 ; par3 = 0 ; par4 = 1 ; par5 = 12 ; par6 = MA ; par7 = 0.95 ;
Parameters (R input):
par1 = 36 ; par2 = 1 ; par3 = 1 ; par4 = 1 ; par5 = 12 ; par6 = MA ; par7 = 0.95 ;
R code (references can be found in the software module):
if (par1 == 'Default') {
par1 = 10*log10(length(x))
} else {
par1 <- as.numeric(par1)
}
par2 <- as.numeric(par2)
par3 <- as.numeric(par3)
par4 <- as.numeric(par4)
par5 <- as.numeric(par5)
if (par6 == 'White Noise') par6 <- 'white' else par6 <- 'ma'
par7 <- as.numeric(par7)
if (par2 == 0) {
x <- log(x)
} else {
x <- (x ^ par2 - 1) / par2
}
if (par3 > 0) x <- diff(x,lag=1,difference=par3)
if (par4 > 0) x <- diff(x,lag=par5,difference=par4)
bitmap(file='pic1.png')
racf <- acf(x, par1, main='Autocorrelation', xlab='time lag', ylab='ACF', ci.type=par6, ci=par7, sub=paste('(lambda=',par2,', d=',par3,', D=',par4,', CI=', par7, ', CI type=',par6,')',sep=''))
dev.off()
bitmap(file='pic2.png')
rpacf <- pacf(x,par1,main='Partial Autocorrelation',xlab='lags',ylab='PACF')
dev.off()
(myacf <- c(racf$acf))
(mypacf <- c(rpacf$acf))
lengthx <- length(x)
sqrtn <- sqrt(lengthx)
load(file='createtable')
a<-table.start()
a<-table.row.start(a)
a<-table.element(a,'Autocorrelation Function',4,TRUE)
a<-table.row.end(a)
a<-table.row.start(a)
a<-table.element(a,'Time lag k',header=TRUE)
a<-table.element(a,hyperlink('basics.htm','ACF(k)','click here for more information about the Autocorrelation Function'),header=TRUE)
a<-table.element(a,'T-STAT',header=TRUE)
a<-table.element(a,'P-value',header=TRUE)
a<-table.row.end(a)
for (i in 2:(par1+1)) {
a<-table.row.start(a)
a<-table.element(a,i-1,header=TRUE)
a<-table.element(a,round(myacf[i],6))
mytstat <- myacf[i]*sqrtn
a<-table.element(a,round(mytstat,4))
a<-table.element(a,round(1-pt(abs(mytstat),lengthx),6))
a<-table.row.end(a)
}
a<-table.end(a)
table.save(a,file='mytable.tab')
a<-table.start()
a<-table.row.start(a)
a<-table.element(a,'Partial Autocorrelation Function',4,TRUE)
a<-table.row.end(a)
a<-table.row.start(a)
a<-table.element(a,'Time lag k',header=TRUE)
a<-table.element(a,hyperlink('basics.htm','PACF(k)','click here for more information about the Partial Autocorrelation Function'),header=TRUE)
a<-table.element(a,'T-STAT',header=TRUE)
a<-table.element(a,'P-value',header=TRUE)
a<-table.row.end(a)
for (i in 1:par1) {
a<-table.row.start(a)
a<-table.element(a,i,header=TRUE)
a<-table.element(a,round(mypacf[i],6))
mytstat <- mypacf[i]*sqrtn
a<-table.element(a,round(mytstat,4))
a<-table.element(a,round(1-pt(abs(mytstat),lengthx),6))
a<-table.row.end(a)
}
a<-table.end(a)
table.save(a,file='mytable1.tab')