Free Statistics

of Irreproducible Research!

Author's title

Author*The author of this computation has been verified*
R Software Modulerwasp_autocorrelation.wasp
Title produced by software(Partial) Autocorrelation Function
Date of computationThu, 26 Nov 2009 13:10:53 -0700
Cite this page as followsStatistical Computations at FreeStatistics.org, Office for Research Development and Education, URL https://freestatistics.org/blog/index.php?v=date/2009/Nov/26/t1259266440ru9zm1i5bsqri5i.htm/, Retrieved Mon, 29 Apr 2024 07:31:53 +0000
Statistical Computations at FreeStatistics.org, Office for Research Development and Education, URL https://freestatistics.org/blog/index.php?pk=60356, Retrieved Mon, 29 Apr 2024 07:31:53 +0000
QR Codes:

Original text written by user:
IsPrivate?No (this computation is public)
User-defined keywords
Estimated Impact115
Family? (F = Feedback message, R = changed R code, M = changed R Module, P = changed Parameters, D = changed Data)
-     [Univariate Explorative Data Analysis] [Run Sequence gebo...] [2008-12-12 13:32:37] [76963dc1903f0f612b6153510a3818cf]
- R  D  [Univariate Explorative Data Analysis] [Run Sequence gebo...] [2008-12-17 12:14:40] [76963dc1903f0f612b6153510a3818cf]
-         [Univariate Explorative Data Analysis] [Run Sequence Plot...] [2008-12-22 18:19:51] [1ce0d16c8f4225c977b42c8fa93bc163]
- RMP       [(Partial) Autocorrelation Function] [Identifying Integ...] [2009-11-22 12:26:39] [b98453cac15ba1066b407e146608df68]
-   PD          [(Partial) Autocorrelation Function] [workshop 8] [2009-11-26 20:10:53] [6c94b261890ba36343a04d1029691995] [Current]
Feedback Forum

Post a new message
Dataseries X:
283.042
276.687
277.915
277.128
277.103
275.037
270.150
267.140
264.993
287.259
291.186
292.300
288.186
281.477
282.656
280.190
280.408
276.836
275.216
274.352
271.311
289.802
290.726
292.300
278.506
269.826
265.861
269.034
264.176
255.198
253.353
246.057
235.372
258.556
260.993
254.663
250.643
243.422
247.105
248.541
245.039
237.080
237.085
225.554
226.839
247.934
248.333
246.969
245.098
246.263
255.765
264.319
268.347
273.046
273.963
267.430
271.993
292.710
295.881
293.299


Summary of computational transaction
Raw Inputview raw input (R code)
Raw Outputview raw output of R engine
Computing time1 seconds
R Server'Gwilym Jenkins' @ 72.249.127.135

\begin{tabular}{lllllllll}
\hline
Summary of computational transaction \tabularnewline
Raw Input & view raw input (R code)  \tabularnewline
Raw Output & view raw output of R engine  \tabularnewline
Computing time & 1 seconds \tabularnewline
R Server & 'Gwilym Jenkins' @ 72.249.127.135 \tabularnewline
\hline
\end{tabular}
%Source: https://freestatistics.org/blog/index.php?pk=60356&T=0

[TABLE]
[ROW][C]Summary of computational transaction[/C][/ROW]
[ROW][C]Raw Input[/C][C]view raw input (R code) [/C][/ROW]
[ROW][C]Raw Output[/C][C]view raw output of R engine [/C][/ROW]
[ROW][C]Computing time[/C][C]1 seconds[/C][/ROW]
[ROW][C]R Server[/C][C]'Gwilym Jenkins' @ 72.249.127.135[/C][/ROW]
[/TABLE]
Source: https://freestatistics.org/blog/index.php?pk=60356&T=0

Globally Unique Identifier (entire table): ba.freestatistics.org/blog/index.php?pk=60356&T=0

As an alternative you can also use a QR Code:  

The GUIDs for individual cells are displayed in the table below:

Summary of computational transaction
Raw Inputview raw input (R code)
Raw Outputview raw output of R engine
Computing time1 seconds
R Server'Gwilym Jenkins' @ 72.249.127.135


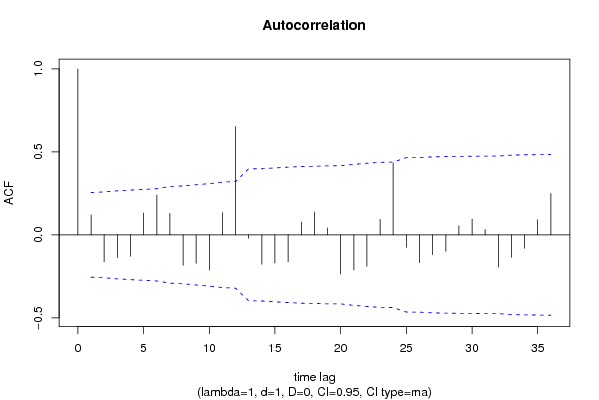
Autocorrelation Function
Time lag kACF(k)T-STATP-value
10.1203220.92420.179571
2-0.162827-1.25070.107991
3-0.137566-1.05670.147486
4-0.129208-0.99250.162511
50.1316471.01120.158024
60.2401961.8450.035031
70.1287610.9890.163343
8-0.183677-1.41090.08177
9-0.171827-1.31980.095995
10-0.212559-1.63270.05393
110.1341641.03050.153482
120.6516875.00573e-06
13-0.021117-0.16220.43585
14-0.176951-1.35920.08963
15-0.169212-1.29970.099372
16-0.162687-1.24960.108186
170.0773840.59440.277259
180.1370711.05290.148348
190.0419210.3220.374296
20-0.235954-1.81240.037507
21-0.211179-1.62210.055058
22-0.189562-1.45610.075339
230.093750.72010.237151
240.4324193.32150.00077
25-0.075555-0.58040.281944
26-0.16779-1.28880.101246
27-0.118511-0.91030.183184
28-0.098393-0.75580.226397
290.0548690.42150.337476
300.0942370.72380.236011
310.0315520.24240.404672
32-0.193427-1.48570.071336
33-0.134406-1.03240.153051
34-0.081395-0.62520.267124
350.0907150.69680.244333
360.2485471.90910.030557

\begin{tabular}{lllllllll}
\hline
Autocorrelation Function \tabularnewline
Time lag k & ACF(k) & T-STAT & P-value \tabularnewline
1 & 0.120322 & 0.9242 & 0.179571 \tabularnewline
2 & -0.162827 & -1.2507 & 0.107991 \tabularnewline
3 & -0.137566 & -1.0567 & 0.147486 \tabularnewline
4 & -0.129208 & -0.9925 & 0.162511 \tabularnewline
5 & 0.131647 & 1.0112 & 0.158024 \tabularnewline
6 & 0.240196 & 1.845 & 0.035031 \tabularnewline
7 & 0.128761 & 0.989 & 0.163343 \tabularnewline
8 & -0.183677 & -1.4109 & 0.08177 \tabularnewline
9 & -0.171827 & -1.3198 & 0.095995 \tabularnewline
10 & -0.212559 & -1.6327 & 0.05393 \tabularnewline
11 & 0.134164 & 1.0305 & 0.153482 \tabularnewline
12 & 0.651687 & 5.0057 & 3e-06 \tabularnewline
13 & -0.021117 & -0.1622 & 0.43585 \tabularnewline
14 & -0.176951 & -1.3592 & 0.08963 \tabularnewline
15 & -0.169212 & -1.2997 & 0.099372 \tabularnewline
16 & -0.162687 & -1.2496 & 0.108186 \tabularnewline
17 & 0.077384 & 0.5944 & 0.277259 \tabularnewline
18 & 0.137071 & 1.0529 & 0.148348 \tabularnewline
19 & 0.041921 & 0.322 & 0.374296 \tabularnewline
20 & -0.235954 & -1.8124 & 0.037507 \tabularnewline
21 & -0.211179 & -1.6221 & 0.055058 \tabularnewline
22 & -0.189562 & -1.4561 & 0.075339 \tabularnewline
23 & 0.09375 & 0.7201 & 0.237151 \tabularnewline
24 & 0.432419 & 3.3215 & 0.00077 \tabularnewline
25 & -0.075555 & -0.5804 & 0.281944 \tabularnewline
26 & -0.16779 & -1.2888 & 0.101246 \tabularnewline
27 & -0.118511 & -0.9103 & 0.183184 \tabularnewline
28 & -0.098393 & -0.7558 & 0.226397 \tabularnewline
29 & 0.054869 & 0.4215 & 0.337476 \tabularnewline
30 & 0.094237 & 0.7238 & 0.236011 \tabularnewline
31 & 0.031552 & 0.2424 & 0.404672 \tabularnewline
32 & -0.193427 & -1.4857 & 0.071336 \tabularnewline
33 & -0.134406 & -1.0324 & 0.153051 \tabularnewline
34 & -0.081395 & -0.6252 & 0.267124 \tabularnewline
35 & 0.090715 & 0.6968 & 0.244333 \tabularnewline
36 & 0.248547 & 1.9091 & 0.030557 \tabularnewline
\hline
\end{tabular}
%Source: https://freestatistics.org/blog/index.php?pk=60356&T=1

[TABLE]
[ROW][C]Autocorrelation Function[/C][/ROW]
[ROW][C]Time lag k[/C][C]ACF(k)[/C][C]T-STAT[/C][C]P-value[/C][/ROW]
[ROW][C]1[/C][C]0.120322[/C][C]0.9242[/C][C]0.179571[/C][/ROW]
[ROW][C]2[/C][C]-0.162827[/C][C]-1.2507[/C][C]0.107991[/C][/ROW]
[ROW][C]3[/C][C]-0.137566[/C][C]-1.0567[/C][C]0.147486[/C][/ROW]
[ROW][C]4[/C][C]-0.129208[/C][C]-0.9925[/C][C]0.162511[/C][/ROW]
[ROW][C]5[/C][C]0.131647[/C][C]1.0112[/C][C]0.158024[/C][/ROW]
[ROW][C]6[/C][C]0.240196[/C][C]1.845[/C][C]0.035031[/C][/ROW]
[ROW][C]7[/C][C]0.128761[/C][C]0.989[/C][C]0.163343[/C][/ROW]
[ROW][C]8[/C][C]-0.183677[/C][C]-1.4109[/C][C]0.08177[/C][/ROW]
[ROW][C]9[/C][C]-0.171827[/C][C]-1.3198[/C][C]0.095995[/C][/ROW]
[ROW][C]10[/C][C]-0.212559[/C][C]-1.6327[/C][C]0.05393[/C][/ROW]
[ROW][C]11[/C][C]0.134164[/C][C]1.0305[/C][C]0.153482[/C][/ROW]
[ROW][C]12[/C][C]0.651687[/C][C]5.0057[/C][C]3e-06[/C][/ROW]
[ROW][C]13[/C][C]-0.021117[/C][C]-0.1622[/C][C]0.43585[/C][/ROW]
[ROW][C]14[/C][C]-0.176951[/C][C]-1.3592[/C][C]0.08963[/C][/ROW]
[ROW][C]15[/C][C]-0.169212[/C][C]-1.2997[/C][C]0.099372[/C][/ROW]
[ROW][C]16[/C][C]-0.162687[/C][C]-1.2496[/C][C]0.108186[/C][/ROW]
[ROW][C]17[/C][C]0.077384[/C][C]0.5944[/C][C]0.277259[/C][/ROW]
[ROW][C]18[/C][C]0.137071[/C][C]1.0529[/C][C]0.148348[/C][/ROW]
[ROW][C]19[/C][C]0.041921[/C][C]0.322[/C][C]0.374296[/C][/ROW]
[ROW][C]20[/C][C]-0.235954[/C][C]-1.8124[/C][C]0.037507[/C][/ROW]
[ROW][C]21[/C][C]-0.211179[/C][C]-1.6221[/C][C]0.055058[/C][/ROW]
[ROW][C]22[/C][C]-0.189562[/C][C]-1.4561[/C][C]0.075339[/C][/ROW]
[ROW][C]23[/C][C]0.09375[/C][C]0.7201[/C][C]0.237151[/C][/ROW]
[ROW][C]24[/C][C]0.432419[/C][C]3.3215[/C][C]0.00077[/C][/ROW]
[ROW][C]25[/C][C]-0.075555[/C][C]-0.5804[/C][C]0.281944[/C][/ROW]
[ROW][C]26[/C][C]-0.16779[/C][C]-1.2888[/C][C]0.101246[/C][/ROW]
[ROW][C]27[/C][C]-0.118511[/C][C]-0.9103[/C][C]0.183184[/C][/ROW]
[ROW][C]28[/C][C]-0.098393[/C][C]-0.7558[/C][C]0.226397[/C][/ROW]
[ROW][C]29[/C][C]0.054869[/C][C]0.4215[/C][C]0.337476[/C][/ROW]
[ROW][C]30[/C][C]0.094237[/C][C]0.7238[/C][C]0.236011[/C][/ROW]
[ROW][C]31[/C][C]0.031552[/C][C]0.2424[/C][C]0.404672[/C][/ROW]
[ROW][C]32[/C][C]-0.193427[/C][C]-1.4857[/C][C]0.071336[/C][/ROW]
[ROW][C]33[/C][C]-0.134406[/C][C]-1.0324[/C][C]0.153051[/C][/ROW]
[ROW][C]34[/C][C]-0.081395[/C][C]-0.6252[/C][C]0.267124[/C][/ROW]
[ROW][C]35[/C][C]0.090715[/C][C]0.6968[/C][C]0.244333[/C][/ROW]
[ROW][C]36[/C][C]0.248547[/C][C]1.9091[/C][C]0.030557[/C][/ROW]
[/TABLE]
Source: https://freestatistics.org/blog/index.php?pk=60356&T=1

Globally Unique Identifier (entire table): ba.freestatistics.org/blog/index.php?pk=60356&T=1

As an alternative you can also use a QR Code:  

The GUIDs for individual cells are displayed in the table below:

Autocorrelation Function
Time lag kACF(k)T-STATP-value
10.1203220.92420.179571
2-0.162827-1.25070.107991
3-0.137566-1.05670.147486
4-0.129208-0.99250.162511
50.1316471.01120.158024
60.2401961.8450.035031
70.1287610.9890.163343
8-0.183677-1.41090.08177
9-0.171827-1.31980.095995
10-0.212559-1.63270.05393
110.1341641.03050.153482
120.6516875.00573e-06
13-0.021117-0.16220.43585
14-0.176951-1.35920.08963
15-0.169212-1.29970.099372
16-0.162687-1.24960.108186
170.0773840.59440.277259
180.1370711.05290.148348
190.0419210.3220.374296
20-0.235954-1.81240.037507
21-0.211179-1.62210.055058
22-0.189562-1.45610.075339
230.093750.72010.237151
240.4324193.32150.00077
25-0.075555-0.58040.281944
26-0.16779-1.28880.101246
27-0.118511-0.91030.183184
28-0.098393-0.75580.226397
290.0548690.42150.337476
300.0942370.72380.236011
310.0315520.24240.404672
32-0.193427-1.48570.071336
33-0.134406-1.03240.153051
34-0.081395-0.62520.267124
350.0907150.69680.244333
360.2485471.90910.030557


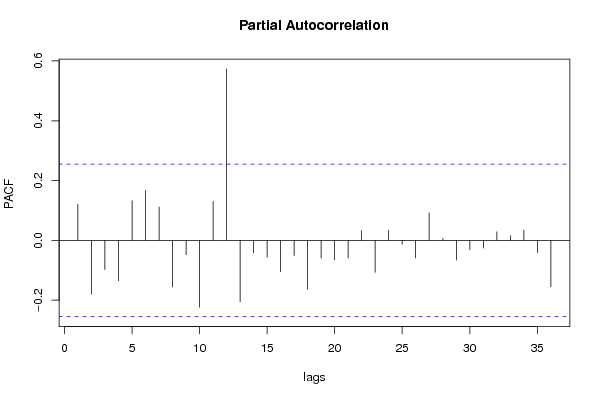
Partial Autocorrelation Function
Time lag kPACF(k)T-STATP-value
10.1203220.92420.179571
2-0.179909-1.38190.086105
3-0.097316-0.74750.228866
4-0.134896-1.03620.152179
50.1328661.02060.155814
60.1670781.28340.102193
70.1114490.85610.197716
8-0.155955-1.19790.11787
9-0.047821-0.36730.357346
10-0.223623-1.71770.04555
110.1303531.00130.160395
120.5733554.4042.3e-05
13-0.205631-1.57950.059786
14-0.041699-0.32030.374937
15-0.056477-0.43380.333005
16-0.104582-0.80330.21251
17-0.050512-0.3880.349711
18-0.163405-1.25510.107188
19-0.058987-0.45310.326073
20-0.065009-0.49930.309697
21-0.059381-0.45610.324991
220.0324560.24930.401996
23-0.106834-0.82060.207587
240.0331580.25470.399923
25-0.012966-0.09960.460503
26-0.058681-0.45070.326915
270.0916210.70380.242177
280.0058950.04530.482018
29-0.065519-0.50330.308328
30-0.031791-0.24420.403965
31-0.02589-0.19890.421525
320.0287820.22110.412897
330.0155340.11930.452713
340.0339760.2610.39751
35-0.040924-0.31430.377186
36-0.154918-1.190.119416

\begin{tabular}{lllllllll}
\hline
Partial Autocorrelation Function \tabularnewline
Time lag k & PACF(k) & T-STAT & P-value \tabularnewline
1 & 0.120322 & 0.9242 & 0.179571 \tabularnewline
2 & -0.179909 & -1.3819 & 0.086105 \tabularnewline
3 & -0.097316 & -0.7475 & 0.228866 \tabularnewline
4 & -0.134896 & -1.0362 & 0.152179 \tabularnewline
5 & 0.132866 & 1.0206 & 0.155814 \tabularnewline
6 & 0.167078 & 1.2834 & 0.102193 \tabularnewline
7 & 0.111449 & 0.8561 & 0.197716 \tabularnewline
8 & -0.155955 & -1.1979 & 0.11787 \tabularnewline
9 & -0.047821 & -0.3673 & 0.357346 \tabularnewline
10 & -0.223623 & -1.7177 & 0.04555 \tabularnewline
11 & 0.130353 & 1.0013 & 0.160395 \tabularnewline
12 & 0.573355 & 4.404 & 2.3e-05 \tabularnewline
13 & -0.205631 & -1.5795 & 0.059786 \tabularnewline
14 & -0.041699 & -0.3203 & 0.374937 \tabularnewline
15 & -0.056477 & -0.4338 & 0.333005 \tabularnewline
16 & -0.104582 & -0.8033 & 0.21251 \tabularnewline
17 & -0.050512 & -0.388 & 0.349711 \tabularnewline
18 & -0.163405 & -1.2551 & 0.107188 \tabularnewline
19 & -0.058987 & -0.4531 & 0.326073 \tabularnewline
20 & -0.065009 & -0.4993 & 0.309697 \tabularnewline
21 & -0.059381 & -0.4561 & 0.324991 \tabularnewline
22 & 0.032456 & 0.2493 & 0.401996 \tabularnewline
23 & -0.106834 & -0.8206 & 0.207587 \tabularnewline
24 & 0.033158 & 0.2547 & 0.399923 \tabularnewline
25 & -0.012966 & -0.0996 & 0.460503 \tabularnewline
26 & -0.058681 & -0.4507 & 0.326915 \tabularnewline
27 & 0.091621 & 0.7038 & 0.242177 \tabularnewline
28 & 0.005895 & 0.0453 & 0.482018 \tabularnewline
29 & -0.065519 & -0.5033 & 0.308328 \tabularnewline
30 & -0.031791 & -0.2442 & 0.403965 \tabularnewline
31 & -0.02589 & -0.1989 & 0.421525 \tabularnewline
32 & 0.028782 & 0.2211 & 0.412897 \tabularnewline
33 & 0.015534 & 0.1193 & 0.452713 \tabularnewline
34 & 0.033976 & 0.261 & 0.39751 \tabularnewline
35 & -0.040924 & -0.3143 & 0.377186 \tabularnewline
36 & -0.154918 & -1.19 & 0.119416 \tabularnewline
\hline
\end{tabular}
%Source: https://freestatistics.org/blog/index.php?pk=60356&T=2

[TABLE]
[ROW][C]Partial Autocorrelation Function[/C][/ROW]
[ROW][C]Time lag k[/C][C]PACF(k)[/C][C]T-STAT[/C][C]P-value[/C][/ROW]
[ROW][C]1[/C][C]0.120322[/C][C]0.9242[/C][C]0.179571[/C][/ROW]
[ROW][C]2[/C][C]-0.179909[/C][C]-1.3819[/C][C]0.086105[/C][/ROW]
[ROW][C]3[/C][C]-0.097316[/C][C]-0.7475[/C][C]0.228866[/C][/ROW]
[ROW][C]4[/C][C]-0.134896[/C][C]-1.0362[/C][C]0.152179[/C][/ROW]
[ROW][C]5[/C][C]0.132866[/C][C]1.0206[/C][C]0.155814[/C][/ROW]
[ROW][C]6[/C][C]0.167078[/C][C]1.2834[/C][C]0.102193[/C][/ROW]
[ROW][C]7[/C][C]0.111449[/C][C]0.8561[/C][C]0.197716[/C][/ROW]
[ROW][C]8[/C][C]-0.155955[/C][C]-1.1979[/C][C]0.11787[/C][/ROW]
[ROW][C]9[/C][C]-0.047821[/C][C]-0.3673[/C][C]0.357346[/C][/ROW]
[ROW][C]10[/C][C]-0.223623[/C][C]-1.7177[/C][C]0.04555[/C][/ROW]
[ROW][C]11[/C][C]0.130353[/C][C]1.0013[/C][C]0.160395[/C][/ROW]
[ROW][C]12[/C][C]0.573355[/C][C]4.404[/C][C]2.3e-05[/C][/ROW]
[ROW][C]13[/C][C]-0.205631[/C][C]-1.5795[/C][C]0.059786[/C][/ROW]
[ROW][C]14[/C][C]-0.041699[/C][C]-0.3203[/C][C]0.374937[/C][/ROW]
[ROW][C]15[/C][C]-0.056477[/C][C]-0.4338[/C][C]0.333005[/C][/ROW]
[ROW][C]16[/C][C]-0.104582[/C][C]-0.8033[/C][C]0.21251[/C][/ROW]
[ROW][C]17[/C][C]-0.050512[/C][C]-0.388[/C][C]0.349711[/C][/ROW]
[ROW][C]18[/C][C]-0.163405[/C][C]-1.2551[/C][C]0.107188[/C][/ROW]
[ROW][C]19[/C][C]-0.058987[/C][C]-0.4531[/C][C]0.326073[/C][/ROW]
[ROW][C]20[/C][C]-0.065009[/C][C]-0.4993[/C][C]0.309697[/C][/ROW]
[ROW][C]21[/C][C]-0.059381[/C][C]-0.4561[/C][C]0.324991[/C][/ROW]
[ROW][C]22[/C][C]0.032456[/C][C]0.2493[/C][C]0.401996[/C][/ROW]
[ROW][C]23[/C][C]-0.106834[/C][C]-0.8206[/C][C]0.207587[/C][/ROW]
[ROW][C]24[/C][C]0.033158[/C][C]0.2547[/C][C]0.399923[/C][/ROW]
[ROW][C]25[/C][C]-0.012966[/C][C]-0.0996[/C][C]0.460503[/C][/ROW]
[ROW][C]26[/C][C]-0.058681[/C][C]-0.4507[/C][C]0.326915[/C][/ROW]
[ROW][C]27[/C][C]0.091621[/C][C]0.7038[/C][C]0.242177[/C][/ROW]
[ROW][C]28[/C][C]0.005895[/C][C]0.0453[/C][C]0.482018[/C][/ROW]
[ROW][C]29[/C][C]-0.065519[/C][C]-0.5033[/C][C]0.308328[/C][/ROW]
[ROW][C]30[/C][C]-0.031791[/C][C]-0.2442[/C][C]0.403965[/C][/ROW]
[ROW][C]31[/C][C]-0.02589[/C][C]-0.1989[/C][C]0.421525[/C][/ROW]
[ROW][C]32[/C][C]0.028782[/C][C]0.2211[/C][C]0.412897[/C][/ROW]
[ROW][C]33[/C][C]0.015534[/C][C]0.1193[/C][C]0.452713[/C][/ROW]
[ROW][C]34[/C][C]0.033976[/C][C]0.261[/C][C]0.39751[/C][/ROW]
[ROW][C]35[/C][C]-0.040924[/C][C]-0.3143[/C][C]0.377186[/C][/ROW]
[ROW][C]36[/C][C]-0.154918[/C][C]-1.19[/C][C]0.119416[/C][/ROW]
[/TABLE]
Source: https://freestatistics.org/blog/index.php?pk=60356&T=2

Globally Unique Identifier (entire table): ba.freestatistics.org/blog/index.php?pk=60356&T=2

As an alternative you can also use a QR Code:  

The GUIDs for individual cells are displayed in the table below:

Partial Autocorrelation Function
Time lag kPACF(k)T-STATP-value
10.1203220.92420.179571
2-0.179909-1.38190.086105
3-0.097316-0.74750.228866
4-0.134896-1.03620.152179
50.1328661.02060.155814
60.1670781.28340.102193
70.1114490.85610.197716
8-0.155955-1.19790.11787
9-0.047821-0.36730.357346
10-0.223623-1.71770.04555
110.1303531.00130.160395
120.5733554.4042.3e-05
13-0.205631-1.57950.059786
14-0.041699-0.32030.374937
15-0.056477-0.43380.333005
16-0.104582-0.80330.21251
17-0.050512-0.3880.349711
18-0.163405-1.25510.107188
19-0.058987-0.45310.326073
20-0.065009-0.49930.309697
21-0.059381-0.45610.324991
220.0324560.24930.401996
23-0.106834-0.82060.207587
240.0331580.25470.399923
25-0.012966-0.09960.460503
26-0.058681-0.45070.326915
270.0916210.70380.242177
280.0058950.04530.482018
29-0.065519-0.50330.308328
30-0.031791-0.24420.403965
31-0.02589-0.19890.421525
320.0287820.22110.412897
330.0155340.11930.452713
340.0339760.2610.39751
35-0.040924-0.31430.377186
36-0.154918-1.190.119416


Parameters (Session):
par1 = 36 ; par2 = 1 ; par3 = 1 ; par4 = 0 ; par5 = 12 ; par6 = MA ; par7 = 0.95 ;
Parameters (R input):
par1 = 36 ; par2 = 1 ; par3 = 1 ; par4 = 0 ; par5 = 12 ; par6 = MA ; par7 = 0.95 ;
R code (references can be found in the software module):
if (par1 == 'Default') {
par1 = 10*log10(length(x))
} else {
par1 <- as.numeric(par1)
}
par2 <- as.numeric(par2)
par3 <- as.numeric(par3)
par4 <- as.numeric(par4)
par5 <- as.numeric(par5)
if (par6 == 'White Noise') par6 <- 'white' else par6 <- 'ma'
par7 <- as.numeric(par7)
if (par2 == 0) {
x <- log(x)
} else {
x <- (x ^ par2 - 1) / par2
}
if (par3 > 0) x <- diff(x,lag=1,difference=par3)
if (par4 > 0) x <- diff(x,lag=par5,difference=par4)
bitmap(file='pic1.png')
racf <- acf(x, par1, main='Autocorrelation', xlab='time lag', ylab='ACF', ci.type=par6, ci=par7, sub=paste('(lambda=',par2,', d=',par3,', D=',par4,', CI=', par7, ', CI type=',par6,')',sep=''))
dev.off()
bitmap(file='pic2.png')
rpacf <- pacf(x,par1,main='Partial Autocorrelation',xlab='lags',ylab='PACF')
dev.off()
(myacf <- c(racf$acf))
(mypacf <- c(rpacf$acf))
lengthx <- length(x)
sqrtn <- sqrt(lengthx)
load(file='createtable')
a<-table.start()
a<-table.row.start(a)
a<-table.element(a,'Autocorrelation Function',4,TRUE)
a<-table.row.end(a)
a<-table.row.start(a)
a<-table.element(a,'Time lag k',header=TRUE)
a<-table.element(a,hyperlink('basics.htm','ACF(k)','click here for more information about the Autocorrelation Function'),header=TRUE)
a<-table.element(a,'T-STAT',header=TRUE)
a<-table.element(a,'P-value',header=TRUE)
a<-table.row.end(a)
for (i in 2:(par1+1)) {
a<-table.row.start(a)
a<-table.element(a,i-1,header=TRUE)
a<-table.element(a,round(myacf[i],6))
mytstat <- myacf[i]*sqrtn
a<-table.element(a,round(mytstat,4))
a<-table.element(a,round(1-pt(abs(mytstat),lengthx),6))
a<-table.row.end(a)
}
a<-table.end(a)
table.save(a,file='mytable.tab')
a<-table.start()
a<-table.row.start(a)
a<-table.element(a,'Partial Autocorrelation Function',4,TRUE)
a<-table.row.end(a)
a<-table.row.start(a)
a<-table.element(a,'Time lag k',header=TRUE)
a<-table.element(a,hyperlink('basics.htm','PACF(k)','click here for more information about the Partial Autocorrelation Function'),header=TRUE)
a<-table.element(a,'T-STAT',header=TRUE)
a<-table.element(a,'P-value',header=TRUE)
a<-table.row.end(a)
for (i in 1:par1) {
a<-table.row.start(a)
a<-table.element(a,i,header=TRUE)
a<-table.element(a,round(mypacf[i],6))
mytstat <- mypacf[i]*sqrtn
a<-table.element(a,round(mytstat,4))
a<-table.element(a,round(1-pt(abs(mytstat),lengthx),6))
a<-table.row.end(a)
}
a<-table.end(a)
table.save(a,file='mytable1.tab')