Free Statistics

of Irreproducible Research!

Author's title

Author*The author of this computation has been verified*
R Software Modulerwasp_smp.wasp
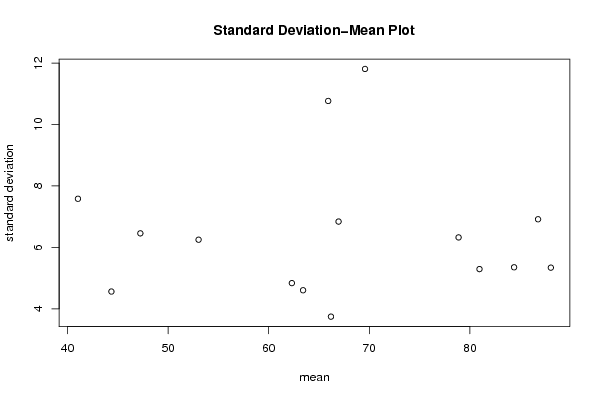
Title produced by softwareStandard Deviation-Mean Plot
Date of computationThu, 26 Nov 2009 13:14:23 -0700
Cite this page as followsStatistical Computations at FreeStatistics.org, Office for Research Development and Education, URL https://freestatistics.org/blog/index.php?v=date/2009/Nov/26/t1259266508jzv5sn186egp3kb.htm/, Retrieved Mon, 29 Apr 2024 03:40:06 +0000
Statistical Computations at FreeStatistics.org, Office for Research Development and Education, URL https://freestatistics.org/blog/index.php?pk=60359, Retrieved Mon, 29 Apr 2024 03:40:06 +0000
QR Codes:

Original text written by user:
IsPrivate?No (this computation is public)
User-defined keywords
Estimated Impact131
Family? (F = Feedback message, R = changed R code, M = changed R Module, P = changed Parameters, D = changed Data)
-     [Univariate Explorative Data Analysis] [Run Sequence gebo...] [2008-12-12 13:32:37] [76963dc1903f0f612b6153510a3818cf]
- R  D  [Univariate Explorative Data Analysis] [Run Sequence gebo...] [2008-12-17 12:14:40] [76963dc1903f0f612b6153510a3818cf]
-         [Univariate Explorative Data Analysis] [Run Sequence Plot...] [2008-12-22 18:19:51] [1ce0d16c8f4225c977b42c8fa93bc163]
- RMP       [Standard Deviation-Mean Plot] [Identifying Integ...] [2009-11-22 12:50:05] [b98453cac15ba1066b407e146608df68]
- R PD        [Standard Deviation-Mean Plot] [workshop 8] [2009-11-26 19:55:09] [3d8acb8ffdb376c5fec19e610f8198c2]
-    D            [Standard Deviation-Mean Plot] [workshop 8] [2009-11-26 20:14:23] [e81f30a5c3daacfe71a556c99a478849] [Current]
-   PD              [Standard Deviation-Mean Plot] [ws 8: SPM transfo...] [2009-11-27 15:52:55] [f924a0adda9c1905a1ba8f1c751261ff]
Feedback Forum

Post a new message
Dataseries X:
44.58070218
43.3193912
42.07587125
40.8501513
39.64224047
39.64224047
45.85979536
52.5216938
53.90730164
53.90730164
53.90730164
56.73168085
59.62689273
59.62689273
59.62689273
58.17043656
58.17043656
59.62689273
67.17441874
78.48233794
81.87175216
83.59285653
83.59285653
85.33155061
87.08782811
87.08782811
85.33155061
83.59285653
81.87175216
80.16824383
85.33155061
96.13275234
96.13275234
94.2886494
90.65310867
88.86168284
88.86168284
87.08782811
83.59285653
80.16824383
76.81404097
75.16335947
83.59285653
92.46209953
96.13275234
94.2886494
92.46209953
90.65310867
92.46209953
90.65310867
87.08782811
83.59285653
78.48233794
75.16335947
80.16824383
88.86168284
88.86168284
85.33155061
81.87175216
80.16824383
78.48233794
78.48233794
75.16335947
71.91486948
70.31707448
70.31707448
76.81404097
87.08782811
88.86168284
85.33155061
81.87175216
81.87175216
83.59285653
81.87175216
80.16824383
78.48233794
75.16335947
73.53030008
78.48233794
88.86168284
90.65310867
85.33155061
78.48233794
76.81404097
76.81404097
75.16335947
73.53030008
70.31707448
67.17441874
64.10238876
67.17441874
70.31707448
65.62957198
61.10104179
56.73168085
55.31063329
52.5216938
48.4712936
43.3193912
42.07587125
38.45214802
37.27988334
43.3193912
49.80368162
47.15666202
45.85979536
43.3193912
40.8501513
37.27988334
34.98887574
34.98887574
37.27988334
37.27988334
33.8701524
36.12545601
38.45214802
43.3193912
52.5216938
52.5216938
53.90730164
53.90730164
51.15381776
49.80368162
47.15666202
44.58070218
43.3193912
52.5216938
53.90730164
56.73168085
59.62689273
61.10104179
62.59287626
64.10238876
62.59287626
59.62689273
58.17043656
53.90730164
53.90730164
64.10238876
65.62957198
65.62957198
65.62957198
65.62957198
68.73692191
73.53030008
71.91486948
64.10238876
52.5216938
48.4712936
51.15381776
71.91486948
80.16824383
80.16824383
70.31707448
62.59287626
64.10238876
67.17441874
68.73692191
67.17441874
62.59287626
61.10104179
58.17043656
68.73692191
70.31707448
70.31707448
67.17441874
65.62957198
67.17441874
70.31707448
70.31707448
68.73692191
67.17441874
64.10238876
59.62689273
62.59287626
61.10104179
61.10104179
59.62689273
58.17043656
58.17043656


Summary of computational transaction
Raw Inputview raw input (R code)
Raw Outputview raw output of R engine
Computing time1 seconds
R Server'Gwilym Jenkins' @ 72.249.127.135

\begin{tabular}{lllllllll}
\hline
Summary of computational transaction \tabularnewline
Raw Input & view raw input (R code)  \tabularnewline
Raw Output & view raw output of R engine  \tabularnewline
Computing time & 1 seconds \tabularnewline
R Server & 'Gwilym Jenkins' @ 72.249.127.135 \tabularnewline
\hline
\end{tabular}
%Source: https://freestatistics.org/blog/index.php?pk=60359&T=0

[TABLE]
[ROW][C]Summary of computational transaction[/C][/ROW]
[ROW][C]Raw Input[/C][C]view raw input (R code) [/C][/ROW]
[ROW][C]Raw Output[/C][C]view raw output of R engine [/C][/ROW]
[ROW][C]Computing time[/C][C]1 seconds[/C][/ROW]
[ROW][C]R Server[/C][C]'Gwilym Jenkins' @ 72.249.127.135[/C][/ROW]
[/TABLE]
Source: https://freestatistics.org/blog/index.php?pk=60359&T=0

Globally Unique Identifier (entire table): ba.freestatistics.org/blog/index.php?pk=60359&T=0

As an alternative you can also use a QR Code:  

The GUIDs for individual cells are displayed in the table below:

Summary of computational transaction
Raw Inputview raw input (R code)
Raw Outputview raw output of R engine
Computing time1 seconds
R Server'Gwilym Jenkins' @ 72.249.127.135


Standard Deviation-Mean Plot
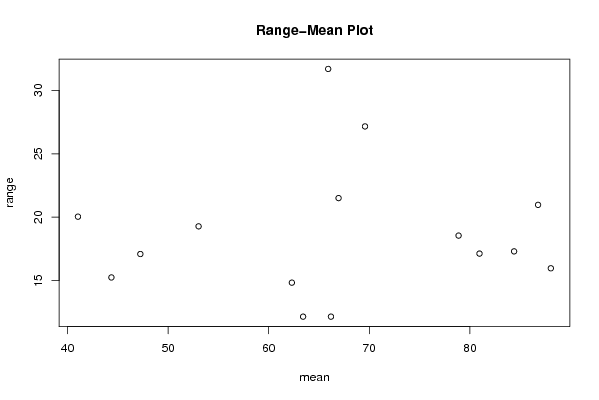
SectionMeanStandard DeviationRange
147.245472656.457166306768517.08944038
269.574518045833311.807434285663327.16111405
388.04504629583335.3411580689940915.96450851
486.77329814583336.9160725777343620.96939287
584.39206219666675.352966769646117.29874006
678.87630505333336.3251607372373718.54460836
780.95282574833335.2940770875273617.12280859
866.94716696916676.8409567064478821.50340768
944.36911282583334.5630433164652215.24181046
1041.04460319757.5818292534656720.03714924
1153.03358695756.2502446200207819.27348506
1262.30539968166674.8376775726912814.82962027
1365.913171676666710.7654391121431.69695023
1466.19163286083333.7462668834676812.14663792
1563.41979139916674.6053395050112112.14663792

\begin{tabular}{lllllllll}
\hline
Standard Deviation-Mean Plot \tabularnewline
Section & Mean & Standard Deviation & Range \tabularnewline
1 & 47.24547265 & 6.4571663067685 & 17.08944038 \tabularnewline
2 & 69.5745180458333 & 11.8074342856633 & 27.16111405 \tabularnewline
3 & 88.0450462958333 & 5.34115806899409 & 15.96450851 \tabularnewline
4 & 86.7732981458333 & 6.91607257773436 & 20.96939287 \tabularnewline
5 & 84.3920621966667 & 5.3529667696461 & 17.29874006 \tabularnewline
6 & 78.8763050533333 & 6.32516073723737 & 18.54460836 \tabularnewline
7 & 80.9528257483333 & 5.29407708752736 & 17.12280859 \tabularnewline
8 & 66.9471669691667 & 6.84095670644788 & 21.50340768 \tabularnewline
9 & 44.3691128258333 & 4.56304331646522 & 15.24181046 \tabularnewline
10 & 41.0446031975 & 7.58182925346567 & 20.03714924 \tabularnewline
11 & 53.0335869575 & 6.25024462002078 & 19.27348506 \tabularnewline
12 & 62.3053996816667 & 4.83767757269128 & 14.82962027 \tabularnewline
13 & 65.9131716766667 & 10.76543911214 & 31.69695023 \tabularnewline
14 & 66.1916328608333 & 3.74626688346768 & 12.14663792 \tabularnewline
15 & 63.4197913991667 & 4.60533950501121 & 12.14663792 \tabularnewline
\hline
\end{tabular}
%Source: https://freestatistics.org/blog/index.php?pk=60359&T=1

[TABLE]
[ROW][C]Standard Deviation-Mean Plot[/C][/ROW]
[ROW][C]Section[/C][C]Mean[/C][C]Standard Deviation[/C][C]Range[/C][/ROW]
[ROW][C]1[/C][C]47.24547265[/C][C]6.4571663067685[/C][C]17.08944038[/C][/ROW]
[ROW][C]2[/C][C]69.5745180458333[/C][C]11.8074342856633[/C][C]27.16111405[/C][/ROW]
[ROW][C]3[/C][C]88.0450462958333[/C][C]5.34115806899409[/C][C]15.96450851[/C][/ROW]
[ROW][C]4[/C][C]86.7732981458333[/C][C]6.91607257773436[/C][C]20.96939287[/C][/ROW]
[ROW][C]5[/C][C]84.3920621966667[/C][C]5.3529667696461[/C][C]17.29874006[/C][/ROW]
[ROW][C]6[/C][C]78.8763050533333[/C][C]6.32516073723737[/C][C]18.54460836[/C][/ROW]
[ROW][C]7[/C][C]80.9528257483333[/C][C]5.29407708752736[/C][C]17.12280859[/C][/ROW]
[ROW][C]8[/C][C]66.9471669691667[/C][C]6.84095670644788[/C][C]21.50340768[/C][/ROW]
[ROW][C]9[/C][C]44.3691128258333[/C][C]4.56304331646522[/C][C]15.24181046[/C][/ROW]
[ROW][C]10[/C][C]41.0446031975[/C][C]7.58182925346567[/C][C]20.03714924[/C][/ROW]
[ROW][C]11[/C][C]53.0335869575[/C][C]6.25024462002078[/C][C]19.27348506[/C][/ROW]
[ROW][C]12[/C][C]62.3053996816667[/C][C]4.83767757269128[/C][C]14.82962027[/C][/ROW]
[ROW][C]13[/C][C]65.9131716766667[/C][C]10.76543911214[/C][C]31.69695023[/C][/ROW]
[ROW][C]14[/C][C]66.1916328608333[/C][C]3.74626688346768[/C][C]12.14663792[/C][/ROW]
[ROW][C]15[/C][C]63.4197913991667[/C][C]4.60533950501121[/C][C]12.14663792[/C][/ROW]
[/TABLE]
Source: https://freestatistics.org/blog/index.php?pk=60359&T=1

Globally Unique Identifier (entire table): ba.freestatistics.org/blog/index.php?pk=60359&T=1

As an alternative you can also use a QR Code:  

The GUIDs for individual cells are displayed in the table below:

Standard Deviation-Mean Plot
SectionMeanStandard DeviationRange
147.245472656.457166306768517.08944038
269.574518045833311.807434285663327.16111405
388.04504629583335.3411580689940915.96450851
486.77329814583336.9160725777343620.96939287
584.39206219666675.352966769646117.29874006
678.87630505333336.3251607372373718.54460836
780.95282574833335.2940770875273617.12280859
866.94716696916676.8409567064478821.50340768
944.36911282583334.5630433164652215.24181046
1041.04460319757.5818292534656720.03714924
1153.03358695756.2502446200207819.27348506
1262.30539968166674.8376775726912814.82962027
1365.913171676666710.7654391121431.69695023
1466.19163286083333.7462668834676812.14663792
1563.41979139916674.6053395050112112.14663792


Regression: S.E.(k) = alpha + beta * Mean(k)
alpha6.63670590389265
beta-0.00286838321219022
S.D.0.0403889584340037
T-STAT-0.0710189943837548
p-value0.944463568279357

\begin{tabular}{lllllllll}
\hline
Regression: S.E.(k) = alpha + beta * Mean(k) \tabularnewline
alpha & 6.63670590389265 \tabularnewline
beta & -0.00286838321219022 \tabularnewline
S.D. & 0.0403889584340037 \tabularnewline
T-STAT & -0.0710189943837548 \tabularnewline
p-value & 0.944463568279357 \tabularnewline
\hline
\end{tabular}
%Source: https://freestatistics.org/blog/index.php?pk=60359&T=2

[TABLE]
[ROW][C]Regression: S.E.(k) = alpha + beta * Mean(k)[/C][/ROW]
[ROW][C]alpha[/C][C]6.63670590389265[/C][/ROW]
[ROW][C]beta[/C][C]-0.00286838321219022[/C][/ROW]
[ROW][C]S.D.[/C][C]0.0403889584340037[/C][/ROW]
[ROW][C]T-STAT[/C][C]-0.0710189943837548[/C][/ROW]
[ROW][C]p-value[/C][C]0.944463568279357[/C][/ROW]
[/TABLE]
Source: https://freestatistics.org/blog/index.php?pk=60359&T=2

Globally Unique Identifier (entire table): ba.freestatistics.org/blog/index.php?pk=60359&T=2

As an alternative you can also use a QR Code:  

The GUIDs for individual cells are displayed in the table below:

Regression: S.E.(k) = alpha + beta * Mean(k)
alpha6.63670590389265
beta-0.00286838321219022
S.D.0.0403889584340037
T-STAT-0.0710189943837548
p-value0.944463568279357


Regression: ln S.E.(k) = alpha + beta * ln Mean(k)
alpha1.86579611221359
beta-0.0120629787911608
S.D.0.351869882968837
T-STAT-0.0342824986593956
p-value0.973172680143146
Lambda1.01206297879116

\begin{tabular}{lllllllll}
\hline
Regression: ln S.E.(k) = alpha + beta * ln Mean(k) \tabularnewline
alpha & 1.86579611221359 \tabularnewline
beta & -0.0120629787911608 \tabularnewline
S.D. & 0.351869882968837 \tabularnewline
T-STAT & -0.0342824986593956 \tabularnewline
p-value & 0.973172680143146 \tabularnewline
Lambda & 1.01206297879116 \tabularnewline
\hline
\end{tabular}
%Source: https://freestatistics.org/blog/index.php?pk=60359&T=3

[TABLE]
[ROW][C]Regression: ln S.E.(k) = alpha + beta * ln Mean(k)[/C][/ROW]
[ROW][C]alpha[/C][C]1.86579611221359[/C][/ROW]
[ROW][C]beta[/C][C]-0.0120629787911608[/C][/ROW]
[ROW][C]S.D.[/C][C]0.351869882968837[/C][/ROW]
[ROW][C]T-STAT[/C][C]-0.0342824986593956[/C][/ROW]
[ROW][C]p-value[/C][C]0.973172680143146[/C][/ROW]
[ROW][C]Lambda[/C][C]1.01206297879116[/C][/ROW]
[/TABLE]
Source: https://freestatistics.org/blog/index.php?pk=60359&T=3

Globally Unique Identifier (entire table): ba.freestatistics.org/blog/index.php?pk=60359&T=3

As an alternative you can also use a QR Code:  

The GUIDs for individual cells are displayed in the table below:

Regression: ln S.E.(k) = alpha + beta * ln Mean(k)
alpha1.86579611221359
beta-0.0120629787911608
S.D.0.351869882968837
T-STAT-0.0342824986593956
p-value0.973172680143146
Lambda1.01206297879116


Parameters (Session):
par1 = 1 ; par2 = 0 ; par3 = 1 ; par4 = 12 ;
Parameters (R input):
par1 = 12 ;
R code (references can be found in the software module):
par1 <- as.numeric(par1)
(n <- length(x))
(np <- floor(n / par1))
arr <- array(NA,dim=c(par1,np))
j <- 0
k <- 1
for (i in 1:(np*par1))
{
j = j + 1
arr[j,k] <- x[i]
if (j == par1) {
j = 0
k=k+1
}
}
arr
arr.mean <- array(NA,dim=np)
arr.sd <- array(NA,dim=np)
arr.range <- array(NA,dim=np)
for (j in 1:np)
{
arr.mean[j] <- mean(arr[,j],na.rm=TRUE)
arr.sd[j] <- sd(arr[,j],na.rm=TRUE)
arr.range[j] <- max(arr[,j],na.rm=TRUE) - min(arr[,j],na.rm=TRUE)
}
arr.mean
arr.sd
arr.range
(lm1 <- lm(arr.sd~arr.mean))
(lnlm1 <- lm(log(arr.sd)~log(arr.mean)))
(lm2 <- lm(arr.range~arr.mean))
bitmap(file='test1.png')
plot(arr.mean,arr.sd,main='Standard Deviation-Mean Plot',xlab='mean',ylab='standard deviation')
dev.off()
bitmap(file='test2.png')
plot(arr.mean,arr.range,main='Range-Mean Plot',xlab='mean',ylab='range')
dev.off()
load(file='createtable')
a<-table.start()
a<-table.row.start(a)
a<-table.element(a,'Standard Deviation-Mean Plot',4,TRUE)
a<-table.row.end(a)
a<-table.row.start(a)
a<-table.element(a,'Section',header=TRUE)
a<-table.element(a,'Mean',header=TRUE)
a<-table.element(a,'Standard Deviation',header=TRUE)
a<-table.element(a,'Range',header=TRUE)
a<-table.row.end(a)
for (j in 1:np) {
a<-table.row.start(a)
a<-table.element(a,j,header=TRUE)
a<-table.element(a,arr.mean[j])
a<-table.element(a,arr.sd[j] )
a<-table.element(a,arr.range[j] )
a<-table.row.end(a)
}
a<-table.end(a)
table.save(a,file='mytable.tab')
a<-table.start()
a<-table.row.start(a)
a<-table.element(a,'Regression: S.E.(k) = alpha + beta * Mean(k)',2,TRUE)
a<-table.row.end(a)
a<-table.row.start(a)
a<-table.element(a,'alpha',header=TRUE)
a<-table.element(a,lm1$coefficients[[1]])
a<-table.row.end(a)
a<-table.row.start(a)
a<-table.element(a,'beta',header=TRUE)
a<-table.element(a,lm1$coefficients[[2]])
a<-table.row.end(a)
a<-table.row.start(a)
a<-table.element(a,'S.D.',header=TRUE)
a<-table.element(a,summary(lm1)$coefficients[2,2])
a<-table.row.end(a)
a<-table.row.start(a)
a<-table.element(a,'T-STAT',header=TRUE)
a<-table.element(a,summary(lm1)$coefficients[2,3])
a<-table.row.end(a)
a<-table.row.start(a)
a<-table.element(a,'p-value',header=TRUE)
a<-table.element(a,summary(lm1)$coefficients[2,4])
a<-table.row.end(a)
a<-table.end(a)
table.save(a,file='mytable1.tab')
a<-table.start()
a<-table.row.start(a)
a<-table.element(a,'Regression: ln S.E.(k) = alpha + beta * ln Mean(k)',2,TRUE)
a<-table.row.end(a)
a<-table.row.start(a)
a<-table.element(a,'alpha',header=TRUE)
a<-table.element(a,lnlm1$coefficients[[1]])
a<-table.row.end(a)
a<-table.row.start(a)
a<-table.element(a,'beta',header=TRUE)
a<-table.element(a,lnlm1$coefficients[[2]])
a<-table.row.end(a)
a<-table.row.start(a)
a<-table.element(a,'S.D.',header=TRUE)
a<-table.element(a,summary(lnlm1)$coefficients[2,2])
a<-table.row.end(a)
a<-table.row.start(a)
a<-table.element(a,'T-STAT',header=TRUE)
a<-table.element(a,summary(lnlm1)$coefficients[2,3])
a<-table.row.end(a)
a<-table.row.start(a)
a<-table.element(a,'p-value',header=TRUE)
a<-table.element(a,summary(lnlm1)$coefficients[2,4])
a<-table.row.end(a)
a<-table.row.start(a)
a<-table.element(a,'Lambda',header=TRUE)
a<-table.element(a,1-lnlm1$coefficients[[2]])
a<-table.row.end(a)
a<-table.end(a)
table.save(a,file='mytable2.tab')