Free Statistics

of Irreproducible Research!

Author's title

Author*The author of this computation has been verified*
R Software Modulerwasp_autocorrelation.wasp
Title produced by software(Partial) Autocorrelation Function
Date of computationThu, 26 Nov 2009 15:23:10 -0700
Cite this page as followsStatistical Computations at FreeStatistics.org, Office for Research Development and Education, URL https://freestatistics.org/blog/index.php?v=date/2009/Nov/26/t1259274253y2xufbyfql035lr.htm/, Retrieved Mon, 29 Apr 2024 00:39:48 +0000
Statistical Computations at FreeStatistics.org, Office for Research Development and Education, URL https://freestatistics.org/blog/index.php?pk=60437, Retrieved Mon, 29 Apr 2024 00:39:48 +0000
QR Codes:

Original text written by user:
IsPrivate?No (this computation is public)
User-defined keywords
Estimated Impact120
Family? (F = Feedback message, R = changed R code, M = changed R Module, P = changed Parameters, D = changed Data)
-     [Univariate Explorative Data Analysis] [Run Sequence gebo...] [2008-12-12 13:32:37] [76963dc1903f0f612b6153510a3818cf]
- R  D  [Univariate Explorative Data Analysis] [Run Sequence gebo...] [2008-12-17 12:14:40] [76963dc1903f0f612b6153510a3818cf]
-         [Univariate Explorative Data Analysis] [Run Sequence Plot...] [2008-12-22 18:19:51] [1ce0d16c8f4225c977b42c8fa93bc163]
- RMP       [(Partial) Autocorrelation Function] [Identifying Integ...] [2009-11-22 12:26:39] [b98453cac15ba1066b407e146608df68]
-    D          [(Partial) Autocorrelation Function] [Autocorrelatie D=...] [2009-11-26 22:23:10] [865cd78857e928bd6e7d79509c6cdcc5] [Current]
Feedback Forum

Post a new message
Dataseries X:
3016
2155
2172
2150
2533
2058
2160
2260
2498
2695
2799
2946
2930
2318
2540
2570
2669
2450
2842
3440
2678
2981
2260
2844
2546
2456
2295
2379
2479
2057
2280
2351
2276
2548
2311
2201
2725
2408
2139
1898
2537
2068
2063
2520
2434
2190
2794
2070
2615
2265
2139
2428
2137
1823
2063
1806
1758
2243
1993
1932
2465


Summary of computational transaction
Raw Inputview raw input (R code)
Raw Outputview raw output of R engine
Computing time2 seconds
R Server'Gwilym Jenkins' @ 72.249.127.135

\begin{tabular}{lllllllll}
\hline
Summary of computational transaction \tabularnewline
Raw Input & view raw input (R code)  \tabularnewline
Raw Output & view raw output of R engine  \tabularnewline
Computing time & 2 seconds \tabularnewline
R Server & 'Gwilym Jenkins' @ 72.249.127.135 \tabularnewline
\hline
\end{tabular}
%Source: https://freestatistics.org/blog/index.php?pk=60437&T=0

[TABLE]
[ROW][C]Summary of computational transaction[/C][/ROW]
[ROW][C]Raw Input[/C][C]view raw input (R code) [/C][/ROW]
[ROW][C]Raw Output[/C][C]view raw output of R engine [/C][/ROW]
[ROW][C]Computing time[/C][C]2 seconds[/C][/ROW]
[ROW][C]R Server[/C][C]'Gwilym Jenkins' @ 72.249.127.135[/C][/ROW]
[/TABLE]
Source: https://freestatistics.org/blog/index.php?pk=60437&T=0

Globally Unique Identifier (entire table): ba.freestatistics.org/blog/index.php?pk=60437&T=0

As an alternative you can also use a QR Code:  

The GUIDs for individual cells are displayed in the table below:

Summary of computational transaction
Raw Inputview raw input (R code)
Raw Outputview raw output of R engine
Computing time2 seconds
R Server'Gwilym Jenkins' @ 72.249.127.135


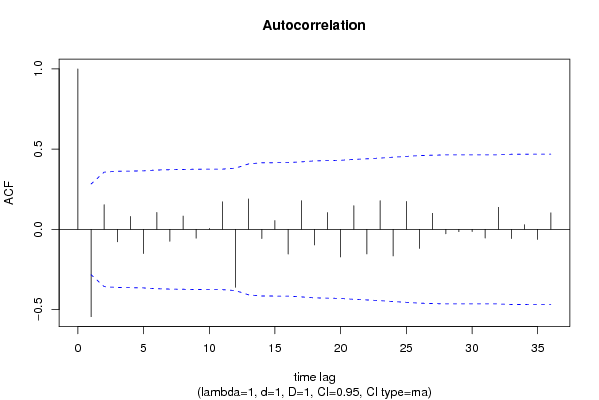
Autocorrelation Function
Time lag kACF(k)T-STATP-value
1-0.544034-3.76920.000224
20.1542221.06850.145323
3-0.077851-0.53940.296062
40.0807890.55970.289136
5-0.150913-1.04560.150502
60.1057440.73260.233677
7-0.074654-0.51720.30369
80.0831340.5760.283663
9-0.055053-0.38140.352289
100.0059170.0410.483735
110.1715321.18840.120259
12-0.360922-2.50050.007934
130.1896531.3140.097554
14-0.057633-0.39930.345725
150.0546850.37890.353229
16-0.154047-1.06730.145594
170.1784821.23660.111133
18-0.09699-0.6720.252413
190.1044670.72380.236361
20-0.171492-1.18810.120313
210.1478761.02450.155364
22-0.153055-1.06040.147136
230.1784981.23670.111114
24-0.165797-1.14870.128192
250.1739811.20540.116984
26-0.118656-0.82210.20755
270.1002660.69470.245308
28-0.027326-0.18930.425321
29-0.014349-0.09940.460612
30-0.013332-0.09240.463395
31-0.053914-0.37350.355199
320.1376840.95390.172456
33-0.057044-0.39520.347218
340.0290180.2010.420757
35-0.062419-0.43250.333675
360.1036250.71790.238139

\begin{tabular}{lllllllll}
\hline
Autocorrelation Function \tabularnewline
Time lag k & ACF(k) & T-STAT & P-value \tabularnewline
1 & -0.544034 & -3.7692 & 0.000224 \tabularnewline
2 & 0.154222 & 1.0685 & 0.145323 \tabularnewline
3 & -0.077851 & -0.5394 & 0.296062 \tabularnewline
4 & 0.080789 & 0.5597 & 0.289136 \tabularnewline
5 & -0.150913 & -1.0456 & 0.150502 \tabularnewline
6 & 0.105744 & 0.7326 & 0.233677 \tabularnewline
7 & -0.074654 & -0.5172 & 0.30369 \tabularnewline
8 & 0.083134 & 0.576 & 0.283663 \tabularnewline
9 & -0.055053 & -0.3814 & 0.352289 \tabularnewline
10 & 0.005917 & 0.041 & 0.483735 \tabularnewline
11 & 0.171532 & 1.1884 & 0.120259 \tabularnewline
12 & -0.360922 & -2.5005 & 0.007934 \tabularnewline
13 & 0.189653 & 1.314 & 0.097554 \tabularnewline
14 & -0.057633 & -0.3993 & 0.345725 \tabularnewline
15 & 0.054685 & 0.3789 & 0.353229 \tabularnewline
16 & -0.154047 & -1.0673 & 0.145594 \tabularnewline
17 & 0.178482 & 1.2366 & 0.111133 \tabularnewline
18 & -0.09699 & -0.672 & 0.252413 \tabularnewline
19 & 0.104467 & 0.7238 & 0.236361 \tabularnewline
20 & -0.171492 & -1.1881 & 0.120313 \tabularnewline
21 & 0.147876 & 1.0245 & 0.155364 \tabularnewline
22 & -0.153055 & -1.0604 & 0.147136 \tabularnewline
23 & 0.178498 & 1.2367 & 0.111114 \tabularnewline
24 & -0.165797 & -1.1487 & 0.128192 \tabularnewline
25 & 0.173981 & 1.2054 & 0.116984 \tabularnewline
26 & -0.118656 & -0.8221 & 0.20755 \tabularnewline
27 & 0.100266 & 0.6947 & 0.245308 \tabularnewline
28 & -0.027326 & -0.1893 & 0.425321 \tabularnewline
29 & -0.014349 & -0.0994 & 0.460612 \tabularnewline
30 & -0.013332 & -0.0924 & 0.463395 \tabularnewline
31 & -0.053914 & -0.3735 & 0.355199 \tabularnewline
32 & 0.137684 & 0.9539 & 0.172456 \tabularnewline
33 & -0.057044 & -0.3952 & 0.347218 \tabularnewline
34 & 0.029018 & 0.201 & 0.420757 \tabularnewline
35 & -0.062419 & -0.4325 & 0.333675 \tabularnewline
36 & 0.103625 & 0.7179 & 0.238139 \tabularnewline
\hline
\end{tabular}
%Source: https://freestatistics.org/blog/index.php?pk=60437&T=1

[TABLE]
[ROW][C]Autocorrelation Function[/C][/ROW]
[ROW][C]Time lag k[/C][C]ACF(k)[/C][C]T-STAT[/C][C]P-value[/C][/ROW]
[ROW][C]1[/C][C]-0.544034[/C][C]-3.7692[/C][C]0.000224[/C][/ROW]
[ROW][C]2[/C][C]0.154222[/C][C]1.0685[/C][C]0.145323[/C][/ROW]
[ROW][C]3[/C][C]-0.077851[/C][C]-0.5394[/C][C]0.296062[/C][/ROW]
[ROW][C]4[/C][C]0.080789[/C][C]0.5597[/C][C]0.289136[/C][/ROW]
[ROW][C]5[/C][C]-0.150913[/C][C]-1.0456[/C][C]0.150502[/C][/ROW]
[ROW][C]6[/C][C]0.105744[/C][C]0.7326[/C][C]0.233677[/C][/ROW]
[ROW][C]7[/C][C]-0.074654[/C][C]-0.5172[/C][C]0.30369[/C][/ROW]
[ROW][C]8[/C][C]0.083134[/C][C]0.576[/C][C]0.283663[/C][/ROW]
[ROW][C]9[/C][C]-0.055053[/C][C]-0.3814[/C][C]0.352289[/C][/ROW]
[ROW][C]10[/C][C]0.005917[/C][C]0.041[/C][C]0.483735[/C][/ROW]
[ROW][C]11[/C][C]0.171532[/C][C]1.1884[/C][C]0.120259[/C][/ROW]
[ROW][C]12[/C][C]-0.360922[/C][C]-2.5005[/C][C]0.007934[/C][/ROW]
[ROW][C]13[/C][C]0.189653[/C][C]1.314[/C][C]0.097554[/C][/ROW]
[ROW][C]14[/C][C]-0.057633[/C][C]-0.3993[/C][C]0.345725[/C][/ROW]
[ROW][C]15[/C][C]0.054685[/C][C]0.3789[/C][C]0.353229[/C][/ROW]
[ROW][C]16[/C][C]-0.154047[/C][C]-1.0673[/C][C]0.145594[/C][/ROW]
[ROW][C]17[/C][C]0.178482[/C][C]1.2366[/C][C]0.111133[/C][/ROW]
[ROW][C]18[/C][C]-0.09699[/C][C]-0.672[/C][C]0.252413[/C][/ROW]
[ROW][C]19[/C][C]0.104467[/C][C]0.7238[/C][C]0.236361[/C][/ROW]
[ROW][C]20[/C][C]-0.171492[/C][C]-1.1881[/C][C]0.120313[/C][/ROW]
[ROW][C]21[/C][C]0.147876[/C][C]1.0245[/C][C]0.155364[/C][/ROW]
[ROW][C]22[/C][C]-0.153055[/C][C]-1.0604[/C][C]0.147136[/C][/ROW]
[ROW][C]23[/C][C]0.178498[/C][C]1.2367[/C][C]0.111114[/C][/ROW]
[ROW][C]24[/C][C]-0.165797[/C][C]-1.1487[/C][C]0.128192[/C][/ROW]
[ROW][C]25[/C][C]0.173981[/C][C]1.2054[/C][C]0.116984[/C][/ROW]
[ROW][C]26[/C][C]-0.118656[/C][C]-0.8221[/C][C]0.20755[/C][/ROW]
[ROW][C]27[/C][C]0.100266[/C][C]0.6947[/C][C]0.245308[/C][/ROW]
[ROW][C]28[/C][C]-0.027326[/C][C]-0.1893[/C][C]0.425321[/C][/ROW]
[ROW][C]29[/C][C]-0.014349[/C][C]-0.0994[/C][C]0.460612[/C][/ROW]
[ROW][C]30[/C][C]-0.013332[/C][C]-0.0924[/C][C]0.463395[/C][/ROW]
[ROW][C]31[/C][C]-0.053914[/C][C]-0.3735[/C][C]0.355199[/C][/ROW]
[ROW][C]32[/C][C]0.137684[/C][C]0.9539[/C][C]0.172456[/C][/ROW]
[ROW][C]33[/C][C]-0.057044[/C][C]-0.3952[/C][C]0.347218[/C][/ROW]
[ROW][C]34[/C][C]0.029018[/C][C]0.201[/C][C]0.420757[/C][/ROW]
[ROW][C]35[/C][C]-0.062419[/C][C]-0.4325[/C][C]0.333675[/C][/ROW]
[ROW][C]36[/C][C]0.103625[/C][C]0.7179[/C][C]0.238139[/C][/ROW]
[/TABLE]
Source: https://freestatistics.org/blog/index.php?pk=60437&T=1

Globally Unique Identifier (entire table): ba.freestatistics.org/blog/index.php?pk=60437&T=1

As an alternative you can also use a QR Code:  

The GUIDs for individual cells are displayed in the table below:

Autocorrelation Function
Time lag kACF(k)T-STATP-value
1-0.544034-3.76920.000224
20.1542221.06850.145323
3-0.077851-0.53940.296062
40.0807890.55970.289136
5-0.150913-1.04560.150502
60.1057440.73260.233677
7-0.074654-0.51720.30369
80.0831340.5760.283663
9-0.055053-0.38140.352289
100.0059170.0410.483735
110.1715321.18840.120259
12-0.360922-2.50050.007934
130.1896531.3140.097554
14-0.057633-0.39930.345725
150.0546850.37890.353229
16-0.154047-1.06730.145594
170.1784821.23660.111133
18-0.09699-0.6720.252413
190.1044670.72380.236361
20-0.171492-1.18810.120313
210.1478761.02450.155364
22-0.153055-1.06040.147136
230.1784981.23670.111114
24-0.165797-1.14870.128192
250.1739811.20540.116984
26-0.118656-0.82210.20755
270.1002660.69470.245308
28-0.027326-0.18930.425321
29-0.014349-0.09940.460612
30-0.013332-0.09240.463395
31-0.053914-0.37350.355199
320.1376840.95390.172456
33-0.057044-0.39520.347218
340.0290180.2010.420757
35-0.062419-0.43250.333675
360.1036250.71790.238139


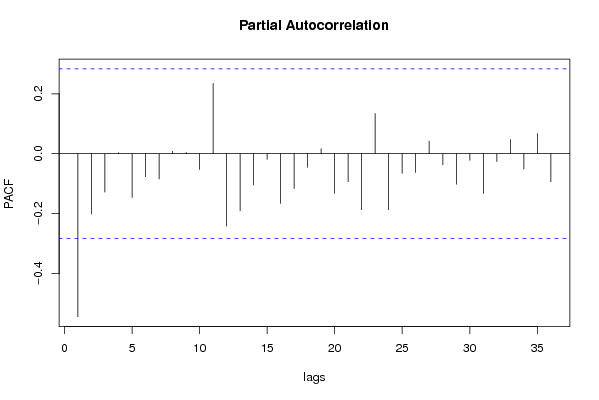
Partial Autocorrelation Function
Time lag kPACF(k)T-STATP-value
1-0.544034-3.76920.000224
2-0.201343-1.39490.084727
3-0.128194-0.88820.189443
40.0032040.02220.49119
5-0.146012-1.01160.1584
6-0.076721-0.53150.29875
7-0.084155-0.5830.281297
80.0083710.0580.476997
90.00410.02840.48873
10-0.052631-0.36460.358492
110.2346071.62540.055313
12-0.241556-1.67360.050362
13-0.190201-1.31780.096921
14-0.104408-0.72340.236485
15-0.018634-0.12910.448909
16-0.165877-1.14920.128078
17-0.116236-0.80530.212308
18-0.045357-0.31420.377349
190.016680.11560.454242
20-0.132459-0.91770.181681
21-0.093569-0.64830.259951
22-0.186969-1.29540.100696
230.1340960.9290.178758
24-0.187072-1.29610.100573
25-0.065419-0.45320.32621
26-0.062487-0.43290.333506
270.0420710.29150.38597
28-0.03702-0.25650.399338
29-0.101913-0.70610.241777
30-0.022019-0.15260.439696
31-0.132825-0.92020.181026
32-0.026397-0.18290.427831
330.0477570.33090.371093
34-0.051014-0.35340.362655
350.0670450.46450.322195
36-0.094007-0.65130.258979

\begin{tabular}{lllllllll}
\hline
Partial Autocorrelation Function \tabularnewline
Time lag k & PACF(k) & T-STAT & P-value \tabularnewline
1 & -0.544034 & -3.7692 & 0.000224 \tabularnewline
2 & -0.201343 & -1.3949 & 0.084727 \tabularnewline
3 & -0.128194 & -0.8882 & 0.189443 \tabularnewline
4 & 0.003204 & 0.0222 & 0.49119 \tabularnewline
5 & -0.146012 & -1.0116 & 0.1584 \tabularnewline
6 & -0.076721 & -0.5315 & 0.29875 \tabularnewline
7 & -0.084155 & -0.583 & 0.281297 \tabularnewline
8 & 0.008371 & 0.058 & 0.476997 \tabularnewline
9 & 0.0041 & 0.0284 & 0.48873 \tabularnewline
10 & -0.052631 & -0.3646 & 0.358492 \tabularnewline
11 & 0.234607 & 1.6254 & 0.055313 \tabularnewline
12 & -0.241556 & -1.6736 & 0.050362 \tabularnewline
13 & -0.190201 & -1.3178 & 0.096921 \tabularnewline
14 & -0.104408 & -0.7234 & 0.236485 \tabularnewline
15 & -0.018634 & -0.1291 & 0.448909 \tabularnewline
16 & -0.165877 & -1.1492 & 0.128078 \tabularnewline
17 & -0.116236 & -0.8053 & 0.212308 \tabularnewline
18 & -0.045357 & -0.3142 & 0.377349 \tabularnewline
19 & 0.01668 & 0.1156 & 0.454242 \tabularnewline
20 & -0.132459 & -0.9177 & 0.181681 \tabularnewline
21 & -0.093569 & -0.6483 & 0.259951 \tabularnewline
22 & -0.186969 & -1.2954 & 0.100696 \tabularnewline
23 & 0.134096 & 0.929 & 0.178758 \tabularnewline
24 & -0.187072 & -1.2961 & 0.100573 \tabularnewline
25 & -0.065419 & -0.4532 & 0.32621 \tabularnewline
26 & -0.062487 & -0.4329 & 0.333506 \tabularnewline
27 & 0.042071 & 0.2915 & 0.38597 \tabularnewline
28 & -0.03702 & -0.2565 & 0.399338 \tabularnewline
29 & -0.101913 & -0.7061 & 0.241777 \tabularnewline
30 & -0.022019 & -0.1526 & 0.439696 \tabularnewline
31 & -0.132825 & -0.9202 & 0.181026 \tabularnewline
32 & -0.026397 & -0.1829 & 0.427831 \tabularnewline
33 & 0.047757 & 0.3309 & 0.371093 \tabularnewline
34 & -0.051014 & -0.3534 & 0.362655 \tabularnewline
35 & 0.067045 & 0.4645 & 0.322195 \tabularnewline
36 & -0.094007 & -0.6513 & 0.258979 \tabularnewline
\hline
\end{tabular}
%Source: https://freestatistics.org/blog/index.php?pk=60437&T=2

[TABLE]
[ROW][C]Partial Autocorrelation Function[/C][/ROW]
[ROW][C]Time lag k[/C][C]PACF(k)[/C][C]T-STAT[/C][C]P-value[/C][/ROW]
[ROW][C]1[/C][C]-0.544034[/C][C]-3.7692[/C][C]0.000224[/C][/ROW]
[ROW][C]2[/C][C]-0.201343[/C][C]-1.3949[/C][C]0.084727[/C][/ROW]
[ROW][C]3[/C][C]-0.128194[/C][C]-0.8882[/C][C]0.189443[/C][/ROW]
[ROW][C]4[/C][C]0.003204[/C][C]0.0222[/C][C]0.49119[/C][/ROW]
[ROW][C]5[/C][C]-0.146012[/C][C]-1.0116[/C][C]0.1584[/C][/ROW]
[ROW][C]6[/C][C]-0.076721[/C][C]-0.5315[/C][C]0.29875[/C][/ROW]
[ROW][C]7[/C][C]-0.084155[/C][C]-0.583[/C][C]0.281297[/C][/ROW]
[ROW][C]8[/C][C]0.008371[/C][C]0.058[/C][C]0.476997[/C][/ROW]
[ROW][C]9[/C][C]0.0041[/C][C]0.0284[/C][C]0.48873[/C][/ROW]
[ROW][C]10[/C][C]-0.052631[/C][C]-0.3646[/C][C]0.358492[/C][/ROW]
[ROW][C]11[/C][C]0.234607[/C][C]1.6254[/C][C]0.055313[/C][/ROW]
[ROW][C]12[/C][C]-0.241556[/C][C]-1.6736[/C][C]0.050362[/C][/ROW]
[ROW][C]13[/C][C]-0.190201[/C][C]-1.3178[/C][C]0.096921[/C][/ROW]
[ROW][C]14[/C][C]-0.104408[/C][C]-0.7234[/C][C]0.236485[/C][/ROW]
[ROW][C]15[/C][C]-0.018634[/C][C]-0.1291[/C][C]0.448909[/C][/ROW]
[ROW][C]16[/C][C]-0.165877[/C][C]-1.1492[/C][C]0.128078[/C][/ROW]
[ROW][C]17[/C][C]-0.116236[/C][C]-0.8053[/C][C]0.212308[/C][/ROW]
[ROW][C]18[/C][C]-0.045357[/C][C]-0.3142[/C][C]0.377349[/C][/ROW]
[ROW][C]19[/C][C]0.01668[/C][C]0.1156[/C][C]0.454242[/C][/ROW]
[ROW][C]20[/C][C]-0.132459[/C][C]-0.9177[/C][C]0.181681[/C][/ROW]
[ROW][C]21[/C][C]-0.093569[/C][C]-0.6483[/C][C]0.259951[/C][/ROW]
[ROW][C]22[/C][C]-0.186969[/C][C]-1.2954[/C][C]0.100696[/C][/ROW]
[ROW][C]23[/C][C]0.134096[/C][C]0.929[/C][C]0.178758[/C][/ROW]
[ROW][C]24[/C][C]-0.187072[/C][C]-1.2961[/C][C]0.100573[/C][/ROW]
[ROW][C]25[/C][C]-0.065419[/C][C]-0.4532[/C][C]0.32621[/C][/ROW]
[ROW][C]26[/C][C]-0.062487[/C][C]-0.4329[/C][C]0.333506[/C][/ROW]
[ROW][C]27[/C][C]0.042071[/C][C]0.2915[/C][C]0.38597[/C][/ROW]
[ROW][C]28[/C][C]-0.03702[/C][C]-0.2565[/C][C]0.399338[/C][/ROW]
[ROW][C]29[/C][C]-0.101913[/C][C]-0.7061[/C][C]0.241777[/C][/ROW]
[ROW][C]30[/C][C]-0.022019[/C][C]-0.1526[/C][C]0.439696[/C][/ROW]
[ROW][C]31[/C][C]-0.132825[/C][C]-0.9202[/C][C]0.181026[/C][/ROW]
[ROW][C]32[/C][C]-0.026397[/C][C]-0.1829[/C][C]0.427831[/C][/ROW]
[ROW][C]33[/C][C]0.047757[/C][C]0.3309[/C][C]0.371093[/C][/ROW]
[ROW][C]34[/C][C]-0.051014[/C][C]-0.3534[/C][C]0.362655[/C][/ROW]
[ROW][C]35[/C][C]0.067045[/C][C]0.4645[/C][C]0.322195[/C][/ROW]
[ROW][C]36[/C][C]-0.094007[/C][C]-0.6513[/C][C]0.258979[/C][/ROW]
[/TABLE]
Source: https://freestatistics.org/blog/index.php?pk=60437&T=2

Globally Unique Identifier (entire table): ba.freestatistics.org/blog/index.php?pk=60437&T=2

As an alternative you can also use a QR Code:  

The GUIDs for individual cells are displayed in the table below:

Partial Autocorrelation Function
Time lag kPACF(k)T-STATP-value
1-0.544034-3.76920.000224
2-0.201343-1.39490.084727
3-0.128194-0.88820.189443
40.0032040.02220.49119
5-0.146012-1.01160.1584
6-0.076721-0.53150.29875
7-0.084155-0.5830.281297
80.0083710.0580.476997
90.00410.02840.48873
10-0.052631-0.36460.358492
110.2346071.62540.055313
12-0.241556-1.67360.050362
13-0.190201-1.31780.096921
14-0.104408-0.72340.236485
15-0.018634-0.12910.448909
16-0.165877-1.14920.128078
17-0.116236-0.80530.212308
18-0.045357-0.31420.377349
190.016680.11560.454242
20-0.132459-0.91770.181681
21-0.093569-0.64830.259951
22-0.186969-1.29540.100696
230.1340960.9290.178758
24-0.187072-1.29610.100573
25-0.065419-0.45320.32621
26-0.062487-0.43290.333506
270.0420710.29150.38597
28-0.03702-0.25650.399338
29-0.101913-0.70610.241777
30-0.022019-0.15260.439696
31-0.132825-0.92020.181026
32-0.026397-0.18290.427831
330.0477570.33090.371093
34-0.051014-0.35340.362655
350.0670450.46450.322195
36-0.094007-0.65130.258979


Parameters (Session):
par1 = 36 ; par2 = 1 ; par3 = 1 ; par4 = 1 ; par5 = 12 ; par6 = MA ; par7 = 0.95 ;
Parameters (R input):
par1 = 36 ; par2 = 1 ; par3 = 1 ; par4 = 1 ; par5 = 12 ; par6 = MA ; par7 = 0.95 ;
R code (references can be found in the software module):
if (par1 == 'Default') {
par1 = 10*log10(length(x))
} else {
par1 <- as.numeric(par1)
}
par2 <- as.numeric(par2)
par3 <- as.numeric(par3)
par4 <- as.numeric(par4)
par5 <- as.numeric(par5)
if (par6 == 'White Noise') par6 <- 'white' else par6 <- 'ma'
par7 <- as.numeric(par7)
if (par2 == 0) {
x <- log(x)
} else {
x <- (x ^ par2 - 1) / par2
}
if (par3 > 0) x <- diff(x,lag=1,difference=par3)
if (par4 > 0) x <- diff(x,lag=par5,difference=par4)
bitmap(file='pic1.png')
racf <- acf(x, par1, main='Autocorrelation', xlab='time lag', ylab='ACF', ci.type=par6, ci=par7, sub=paste('(lambda=',par2,', d=',par3,', D=',par4,', CI=', par7, ', CI type=',par6,')',sep=''))
dev.off()
bitmap(file='pic2.png')
rpacf <- pacf(x,par1,main='Partial Autocorrelation',xlab='lags',ylab='PACF')
dev.off()
(myacf <- c(racf$acf))
(mypacf <- c(rpacf$acf))
lengthx <- length(x)
sqrtn <- sqrt(lengthx)
load(file='createtable')
a<-table.start()
a<-table.row.start(a)
a<-table.element(a,'Autocorrelation Function',4,TRUE)
a<-table.row.end(a)
a<-table.row.start(a)
a<-table.element(a,'Time lag k',header=TRUE)
a<-table.element(a,hyperlink('basics.htm','ACF(k)','click here for more information about the Autocorrelation Function'),header=TRUE)
a<-table.element(a,'T-STAT',header=TRUE)
a<-table.element(a,'P-value',header=TRUE)
a<-table.row.end(a)
for (i in 2:(par1+1)) {
a<-table.row.start(a)
a<-table.element(a,i-1,header=TRUE)
a<-table.element(a,round(myacf[i],6))
mytstat <- myacf[i]*sqrtn
a<-table.element(a,round(mytstat,4))
a<-table.element(a,round(1-pt(abs(mytstat),lengthx),6))
a<-table.row.end(a)
}
a<-table.end(a)
table.save(a,file='mytable.tab')
a<-table.start()
a<-table.row.start(a)
a<-table.element(a,'Partial Autocorrelation Function',4,TRUE)
a<-table.row.end(a)
a<-table.row.start(a)
a<-table.element(a,'Time lag k',header=TRUE)
a<-table.element(a,hyperlink('basics.htm','PACF(k)','click here for more information about the Partial Autocorrelation Function'),header=TRUE)
a<-table.element(a,'T-STAT',header=TRUE)
a<-table.element(a,'P-value',header=TRUE)
a<-table.row.end(a)
for (i in 1:par1) {
a<-table.row.start(a)
a<-table.element(a,i,header=TRUE)
a<-table.element(a,round(mypacf[i],6))
mytstat <- mypacf[i]*sqrtn
a<-table.element(a,round(mytstat,4))
a<-table.element(a,round(1-pt(abs(mytstat),lengthx),6))
a<-table.row.end(a)
}
a<-table.end(a)
table.save(a,file='mytable1.tab')