Free Statistics

of Irreproducible Research!

Author's title

Author*The author of this computation has been verified*
R Software Modulerwasp_autocorrelation.wasp
Title produced by software(Partial) Autocorrelation Function
Date of computationFri, 27 Nov 2009 05:12:39 -0700
Cite this page as followsStatistical Computations at FreeStatistics.org, Office for Research Development and Education, URL https://freestatistics.org/blog/index.php?v=date/2009/Nov/27/t1259324013b2golyjh8872g55.htm/, Retrieved Mon, 29 Apr 2024 01:20:20 +0000
Statistical Computations at FreeStatistics.org, Office for Research Development and Education, URL https://freestatistics.org/blog/index.php?pk=60617, Retrieved Mon, 29 Apr 2024 01:20:20 +0000
QR Codes:

Original text written by user:
IsPrivate?No (this computation is public)
User-defined keywords
Estimated Impact141
Family? (F = Feedback message, R = changed R code, M = changed R Module, P = changed Parameters, D = changed Data)
-     [Univariate Explorative Data Analysis] [Run Sequence gebo...] [2008-12-12 13:32:37] [76963dc1903f0f612b6153510a3818cf]
- R  D  [Univariate Explorative Data Analysis] [Run Sequence gebo...] [2008-12-17 12:14:40] [76963dc1903f0f612b6153510a3818cf]
-         [Univariate Explorative Data Analysis] [Run Sequence Plot...] [2008-12-22 18:19:51] [1ce0d16c8f4225c977b42c8fa93bc163]
- RMP       [(Partial) Autocorrelation Function] [Identifying Integ...] [2009-11-22 12:16:10] [b98453cac15ba1066b407e146608df68]
-   PD          [(Partial) Autocorrelation Function] [WS 8 autocorrelat...] [2009-11-27 12:12:39] [51d49d3536f6a59f2486a67bf50b2759] [Current]
Feedback Forum

Post a new message
Dataseries X:
1901
1395
1639
1643
1751
1797
1373
1558
1555
2061
2010
2119
1985
1963
2017
1975
1589
1679
1392
1511
1449
1767
1899
2179
2217
2049
2343
2175
1607
1702
1764
1766
1615
1953
2091
2411
2550
2351
2786
2525
2474
2332
1978
1789
1904
1997
2207
2453
1948
1384
1989
2140
2100
2045
2083
2022
1950
1422
1859
2147


Summary of computational transaction
Raw Inputview raw input (R code)
Raw Outputview raw output of R engine
Computing time1 seconds
R Server'Gwilym Jenkins' @ 72.249.127.135

\begin{tabular}{lllllllll}
\hline
Summary of computational transaction \tabularnewline
Raw Input & view raw input (R code)  \tabularnewline
Raw Output & view raw output of R engine  \tabularnewline
Computing time & 1 seconds \tabularnewline
R Server & 'Gwilym Jenkins' @ 72.249.127.135 \tabularnewline
\hline
\end{tabular}
%Source: https://freestatistics.org/blog/index.php?pk=60617&T=0

[TABLE]
[ROW][C]Summary of computational transaction[/C][/ROW]
[ROW][C]Raw Input[/C][C]view raw input (R code) [/C][/ROW]
[ROW][C]Raw Output[/C][C]view raw output of R engine [/C][/ROW]
[ROW][C]Computing time[/C][C]1 seconds[/C][/ROW]
[ROW][C]R Server[/C][C]'Gwilym Jenkins' @ 72.249.127.135[/C][/ROW]
[/TABLE]
Source: https://freestatistics.org/blog/index.php?pk=60617&T=0

Globally Unique Identifier (entire table): ba.freestatistics.org/blog/index.php?pk=60617&T=0

As an alternative you can also use a QR Code:  

The GUIDs for individual cells are displayed in the table below:

Summary of computational transaction
Raw Inputview raw input (R code)
Raw Outputview raw output of R engine
Computing time1 seconds
R Server'Gwilym Jenkins' @ 72.249.127.135


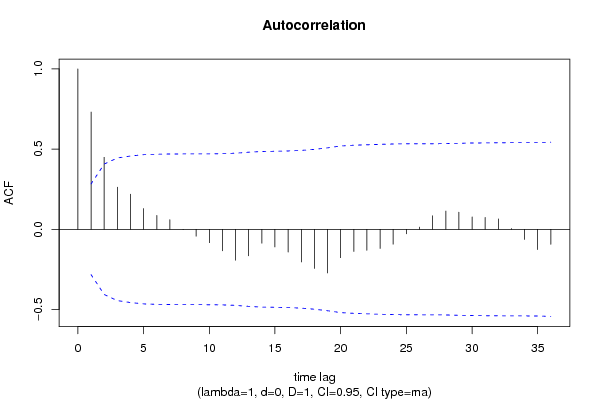
Autocorrelation Function
Time lag kACF(k)T-STATP-value
10.7313335.06683e-06
20.4486333.10820.00158
30.2627691.82050.037459
40.2190431.51760.06784
50.1291960.89510.187601
60.0865110.59940.275873
70.060040.4160.339644
8-0.000739-0.00510.497969
9-0.042858-0.29690.383901
10-0.083526-0.57870.282753
11-0.134108-0.92910.178736
12-0.193003-1.33720.093736
13-0.165259-1.14490.128954
14-0.087009-0.60280.274734
15-0.110014-0.76220.224836
16-0.142342-0.98620.164496
17-0.203519-1.410.08249
18-0.244013-1.69060.048702
19-0.272605-1.88870.032494
20-0.177128-1.22720.11287
21-0.138525-0.95970.171001
22-0.131291-0.90960.183786
23-0.119734-0.82950.205452
24-0.092571-0.64140.262172
25-0.028543-0.19770.422038
260.0135380.09380.46283
270.0839450.58160.281782
280.1133490.78530.218067
290.1067220.73940.231634
300.0769880.53340.298113
310.0735690.50970.306299
320.0643440.44580.328878
330.0046840.03250.487122
34-0.063633-0.44090.330646
35-0.126222-0.87450.193102
36-0.094081-0.65180.258816

\begin{tabular}{lllllllll}
\hline
Autocorrelation Function \tabularnewline
Time lag k & ACF(k) & T-STAT & P-value \tabularnewline
1 & 0.731333 & 5.0668 & 3e-06 \tabularnewline
2 & 0.448633 & 3.1082 & 0.00158 \tabularnewline
3 & 0.262769 & 1.8205 & 0.037459 \tabularnewline
4 & 0.219043 & 1.5176 & 0.06784 \tabularnewline
5 & 0.129196 & 0.8951 & 0.187601 \tabularnewline
6 & 0.086511 & 0.5994 & 0.275873 \tabularnewline
7 & 0.06004 & 0.416 & 0.339644 \tabularnewline
8 & -0.000739 & -0.0051 & 0.497969 \tabularnewline
9 & -0.042858 & -0.2969 & 0.383901 \tabularnewline
10 & -0.083526 & -0.5787 & 0.282753 \tabularnewline
11 & -0.134108 & -0.9291 & 0.178736 \tabularnewline
12 & -0.193003 & -1.3372 & 0.093736 \tabularnewline
13 & -0.165259 & -1.1449 & 0.128954 \tabularnewline
14 & -0.087009 & -0.6028 & 0.274734 \tabularnewline
15 & -0.110014 & -0.7622 & 0.224836 \tabularnewline
16 & -0.142342 & -0.9862 & 0.164496 \tabularnewline
17 & -0.203519 & -1.41 & 0.08249 \tabularnewline
18 & -0.244013 & -1.6906 & 0.048702 \tabularnewline
19 & -0.272605 & -1.8887 & 0.032494 \tabularnewline
20 & -0.177128 & -1.2272 & 0.11287 \tabularnewline
21 & -0.138525 & -0.9597 & 0.171001 \tabularnewline
22 & -0.131291 & -0.9096 & 0.183786 \tabularnewline
23 & -0.119734 & -0.8295 & 0.205452 \tabularnewline
24 & -0.092571 & -0.6414 & 0.262172 \tabularnewline
25 & -0.028543 & -0.1977 & 0.422038 \tabularnewline
26 & 0.013538 & 0.0938 & 0.46283 \tabularnewline
27 & 0.083945 & 0.5816 & 0.281782 \tabularnewline
28 & 0.113349 & 0.7853 & 0.218067 \tabularnewline
29 & 0.106722 & 0.7394 & 0.231634 \tabularnewline
30 & 0.076988 & 0.5334 & 0.298113 \tabularnewline
31 & 0.073569 & 0.5097 & 0.306299 \tabularnewline
32 & 0.064344 & 0.4458 & 0.328878 \tabularnewline
33 & 0.004684 & 0.0325 & 0.487122 \tabularnewline
34 & -0.063633 & -0.4409 & 0.330646 \tabularnewline
35 & -0.126222 & -0.8745 & 0.193102 \tabularnewline
36 & -0.094081 & -0.6518 & 0.258816 \tabularnewline
\hline
\end{tabular}
%Source: https://freestatistics.org/blog/index.php?pk=60617&T=1

[TABLE]
[ROW][C]Autocorrelation Function[/C][/ROW]
[ROW][C]Time lag k[/C][C]ACF(k)[/C][C]T-STAT[/C][C]P-value[/C][/ROW]
[ROW][C]1[/C][C]0.731333[/C][C]5.0668[/C][C]3e-06[/C][/ROW]
[ROW][C]2[/C][C]0.448633[/C][C]3.1082[/C][C]0.00158[/C][/ROW]
[ROW][C]3[/C][C]0.262769[/C][C]1.8205[/C][C]0.037459[/C][/ROW]
[ROW][C]4[/C][C]0.219043[/C][C]1.5176[/C][C]0.06784[/C][/ROW]
[ROW][C]5[/C][C]0.129196[/C][C]0.8951[/C][C]0.187601[/C][/ROW]
[ROW][C]6[/C][C]0.086511[/C][C]0.5994[/C][C]0.275873[/C][/ROW]
[ROW][C]7[/C][C]0.06004[/C][C]0.416[/C][C]0.339644[/C][/ROW]
[ROW][C]8[/C][C]-0.000739[/C][C]-0.0051[/C][C]0.497969[/C][/ROW]
[ROW][C]9[/C][C]-0.042858[/C][C]-0.2969[/C][C]0.383901[/C][/ROW]
[ROW][C]10[/C][C]-0.083526[/C][C]-0.5787[/C][C]0.282753[/C][/ROW]
[ROW][C]11[/C][C]-0.134108[/C][C]-0.9291[/C][C]0.178736[/C][/ROW]
[ROW][C]12[/C][C]-0.193003[/C][C]-1.3372[/C][C]0.093736[/C][/ROW]
[ROW][C]13[/C][C]-0.165259[/C][C]-1.1449[/C][C]0.128954[/C][/ROW]
[ROW][C]14[/C][C]-0.087009[/C][C]-0.6028[/C][C]0.274734[/C][/ROW]
[ROW][C]15[/C][C]-0.110014[/C][C]-0.7622[/C][C]0.224836[/C][/ROW]
[ROW][C]16[/C][C]-0.142342[/C][C]-0.9862[/C][C]0.164496[/C][/ROW]
[ROW][C]17[/C][C]-0.203519[/C][C]-1.41[/C][C]0.08249[/C][/ROW]
[ROW][C]18[/C][C]-0.244013[/C][C]-1.6906[/C][C]0.048702[/C][/ROW]
[ROW][C]19[/C][C]-0.272605[/C][C]-1.8887[/C][C]0.032494[/C][/ROW]
[ROW][C]20[/C][C]-0.177128[/C][C]-1.2272[/C][C]0.11287[/C][/ROW]
[ROW][C]21[/C][C]-0.138525[/C][C]-0.9597[/C][C]0.171001[/C][/ROW]
[ROW][C]22[/C][C]-0.131291[/C][C]-0.9096[/C][C]0.183786[/C][/ROW]
[ROW][C]23[/C][C]-0.119734[/C][C]-0.8295[/C][C]0.205452[/C][/ROW]
[ROW][C]24[/C][C]-0.092571[/C][C]-0.6414[/C][C]0.262172[/C][/ROW]
[ROW][C]25[/C][C]-0.028543[/C][C]-0.1977[/C][C]0.422038[/C][/ROW]
[ROW][C]26[/C][C]0.013538[/C][C]0.0938[/C][C]0.46283[/C][/ROW]
[ROW][C]27[/C][C]0.083945[/C][C]0.5816[/C][C]0.281782[/C][/ROW]
[ROW][C]28[/C][C]0.113349[/C][C]0.7853[/C][C]0.218067[/C][/ROW]
[ROW][C]29[/C][C]0.106722[/C][C]0.7394[/C][C]0.231634[/C][/ROW]
[ROW][C]30[/C][C]0.076988[/C][C]0.5334[/C][C]0.298113[/C][/ROW]
[ROW][C]31[/C][C]0.073569[/C][C]0.5097[/C][C]0.306299[/C][/ROW]
[ROW][C]32[/C][C]0.064344[/C][C]0.4458[/C][C]0.328878[/C][/ROW]
[ROW][C]33[/C][C]0.004684[/C][C]0.0325[/C][C]0.487122[/C][/ROW]
[ROW][C]34[/C][C]-0.063633[/C][C]-0.4409[/C][C]0.330646[/C][/ROW]
[ROW][C]35[/C][C]-0.126222[/C][C]-0.8745[/C][C]0.193102[/C][/ROW]
[ROW][C]36[/C][C]-0.094081[/C][C]-0.6518[/C][C]0.258816[/C][/ROW]
[/TABLE]
Source: https://freestatistics.org/blog/index.php?pk=60617&T=1

Globally Unique Identifier (entire table): ba.freestatistics.org/blog/index.php?pk=60617&T=1

As an alternative you can also use a QR Code:  

The GUIDs for individual cells are displayed in the table below:

Autocorrelation Function
Time lag kACF(k)T-STATP-value
10.7313335.06683e-06
20.4486333.10820.00158
30.2627691.82050.037459
40.2190431.51760.06784
50.1291960.89510.187601
60.0865110.59940.275873
70.060040.4160.339644
8-0.000739-0.00510.497969
9-0.042858-0.29690.383901
10-0.083526-0.57870.282753
11-0.134108-0.92910.178736
12-0.193003-1.33720.093736
13-0.165259-1.14490.128954
14-0.087009-0.60280.274734
15-0.110014-0.76220.224836
16-0.142342-0.98620.164496
17-0.203519-1.410.08249
18-0.244013-1.69060.048702
19-0.272605-1.88870.032494
20-0.177128-1.22720.11287
21-0.138525-0.95970.171001
22-0.131291-0.90960.183786
23-0.119734-0.82950.205452
24-0.092571-0.64140.262172
25-0.028543-0.19770.422038
260.0135380.09380.46283
270.0839450.58160.281782
280.1133490.78530.218067
290.1067220.73940.231634
300.0769880.53340.298113
310.0735690.50970.306299
320.0643440.44580.328878
330.0046840.03250.487122
34-0.063633-0.44090.330646
35-0.126222-0.87450.193102
36-0.094081-0.65180.258816


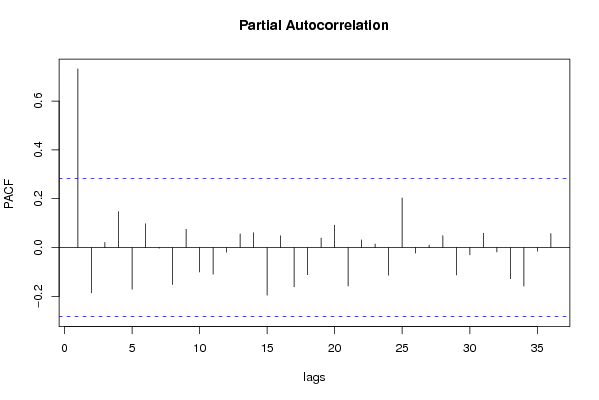
Partial Autocorrelation Function
Time lag kPACF(k)T-STATP-value
10.7313335.06683e-06
2-0.185348-1.28410.10263
30.0209420.14510.442624
40.1474811.02180.156003
5-0.170565-1.18170.121571
60.0970270.67220.252334
7-0.002699-0.01870.49258
8-0.151465-1.04940.149629
90.0748760.51880.303158
10-0.099835-0.69170.246237
11-0.108842-0.75410.227242
12-0.018986-0.13150.447951
130.0556970.38590.350646
140.0610060.42270.337215
15-0.194943-1.35060.091577
160.0479860.33250.370496
17-0.160585-1.11260.135718
18-0.110867-0.76810.223093
190.0388060.26890.394596
200.0918790.63660.26372
21-0.157384-1.09040.140493
220.0311730.2160.414961
230.0143320.09930.460658
24-0.113012-0.7830.218746
250.2030091.40650.08301
26-0.022748-0.15760.437716
270.0099260.06880.47273
280.0484040.33540.36941
29-0.112027-0.77610.220736
30-0.029522-0.20450.419401
310.0587680.40720.342852
32-0.017862-0.12380.451014
33-0.12756-0.88380.190616
34-0.157601-1.09190.140166
35-0.015117-0.10470.458513
360.0570760.39540.347137

\begin{tabular}{lllllllll}
\hline
Partial Autocorrelation Function \tabularnewline
Time lag k & PACF(k) & T-STAT & P-value \tabularnewline
1 & 0.731333 & 5.0668 & 3e-06 \tabularnewline
2 & -0.185348 & -1.2841 & 0.10263 \tabularnewline
3 & 0.020942 & 0.1451 & 0.442624 \tabularnewline
4 & 0.147481 & 1.0218 & 0.156003 \tabularnewline
5 & -0.170565 & -1.1817 & 0.121571 \tabularnewline
6 & 0.097027 & 0.6722 & 0.252334 \tabularnewline
7 & -0.002699 & -0.0187 & 0.49258 \tabularnewline
8 & -0.151465 & -1.0494 & 0.149629 \tabularnewline
9 & 0.074876 & 0.5188 & 0.303158 \tabularnewline
10 & -0.099835 & -0.6917 & 0.246237 \tabularnewline
11 & -0.108842 & -0.7541 & 0.227242 \tabularnewline
12 & -0.018986 & -0.1315 & 0.447951 \tabularnewline
13 & 0.055697 & 0.3859 & 0.350646 \tabularnewline
14 & 0.061006 & 0.4227 & 0.337215 \tabularnewline
15 & -0.194943 & -1.3506 & 0.091577 \tabularnewline
16 & 0.047986 & 0.3325 & 0.370496 \tabularnewline
17 & -0.160585 & -1.1126 & 0.135718 \tabularnewline
18 & -0.110867 & -0.7681 & 0.223093 \tabularnewline
19 & 0.038806 & 0.2689 & 0.394596 \tabularnewline
20 & 0.091879 & 0.6366 & 0.26372 \tabularnewline
21 & -0.157384 & -1.0904 & 0.140493 \tabularnewline
22 & 0.031173 & 0.216 & 0.414961 \tabularnewline
23 & 0.014332 & 0.0993 & 0.460658 \tabularnewline
24 & -0.113012 & -0.783 & 0.218746 \tabularnewline
25 & 0.203009 & 1.4065 & 0.08301 \tabularnewline
26 & -0.022748 & -0.1576 & 0.437716 \tabularnewline
27 & 0.009926 & 0.0688 & 0.47273 \tabularnewline
28 & 0.048404 & 0.3354 & 0.36941 \tabularnewline
29 & -0.112027 & -0.7761 & 0.220736 \tabularnewline
30 & -0.029522 & -0.2045 & 0.419401 \tabularnewline
31 & 0.058768 & 0.4072 & 0.342852 \tabularnewline
32 & -0.017862 & -0.1238 & 0.451014 \tabularnewline
33 & -0.12756 & -0.8838 & 0.190616 \tabularnewline
34 & -0.157601 & -1.0919 & 0.140166 \tabularnewline
35 & -0.015117 & -0.1047 & 0.458513 \tabularnewline
36 & 0.057076 & 0.3954 & 0.347137 \tabularnewline
\hline
\end{tabular}
%Source: https://freestatistics.org/blog/index.php?pk=60617&T=2

[TABLE]
[ROW][C]Partial Autocorrelation Function[/C][/ROW]
[ROW][C]Time lag k[/C][C]PACF(k)[/C][C]T-STAT[/C][C]P-value[/C][/ROW]
[ROW][C]1[/C][C]0.731333[/C][C]5.0668[/C][C]3e-06[/C][/ROW]
[ROW][C]2[/C][C]-0.185348[/C][C]-1.2841[/C][C]0.10263[/C][/ROW]
[ROW][C]3[/C][C]0.020942[/C][C]0.1451[/C][C]0.442624[/C][/ROW]
[ROW][C]4[/C][C]0.147481[/C][C]1.0218[/C][C]0.156003[/C][/ROW]
[ROW][C]5[/C][C]-0.170565[/C][C]-1.1817[/C][C]0.121571[/C][/ROW]
[ROW][C]6[/C][C]0.097027[/C][C]0.6722[/C][C]0.252334[/C][/ROW]
[ROW][C]7[/C][C]-0.002699[/C][C]-0.0187[/C][C]0.49258[/C][/ROW]
[ROW][C]8[/C][C]-0.151465[/C][C]-1.0494[/C][C]0.149629[/C][/ROW]
[ROW][C]9[/C][C]0.074876[/C][C]0.5188[/C][C]0.303158[/C][/ROW]
[ROW][C]10[/C][C]-0.099835[/C][C]-0.6917[/C][C]0.246237[/C][/ROW]
[ROW][C]11[/C][C]-0.108842[/C][C]-0.7541[/C][C]0.227242[/C][/ROW]
[ROW][C]12[/C][C]-0.018986[/C][C]-0.1315[/C][C]0.447951[/C][/ROW]
[ROW][C]13[/C][C]0.055697[/C][C]0.3859[/C][C]0.350646[/C][/ROW]
[ROW][C]14[/C][C]0.061006[/C][C]0.4227[/C][C]0.337215[/C][/ROW]
[ROW][C]15[/C][C]-0.194943[/C][C]-1.3506[/C][C]0.091577[/C][/ROW]
[ROW][C]16[/C][C]0.047986[/C][C]0.3325[/C][C]0.370496[/C][/ROW]
[ROW][C]17[/C][C]-0.160585[/C][C]-1.1126[/C][C]0.135718[/C][/ROW]
[ROW][C]18[/C][C]-0.110867[/C][C]-0.7681[/C][C]0.223093[/C][/ROW]
[ROW][C]19[/C][C]0.038806[/C][C]0.2689[/C][C]0.394596[/C][/ROW]
[ROW][C]20[/C][C]0.091879[/C][C]0.6366[/C][C]0.26372[/C][/ROW]
[ROW][C]21[/C][C]-0.157384[/C][C]-1.0904[/C][C]0.140493[/C][/ROW]
[ROW][C]22[/C][C]0.031173[/C][C]0.216[/C][C]0.414961[/C][/ROW]
[ROW][C]23[/C][C]0.014332[/C][C]0.0993[/C][C]0.460658[/C][/ROW]
[ROW][C]24[/C][C]-0.113012[/C][C]-0.783[/C][C]0.218746[/C][/ROW]
[ROW][C]25[/C][C]0.203009[/C][C]1.4065[/C][C]0.08301[/C][/ROW]
[ROW][C]26[/C][C]-0.022748[/C][C]-0.1576[/C][C]0.437716[/C][/ROW]
[ROW][C]27[/C][C]0.009926[/C][C]0.0688[/C][C]0.47273[/C][/ROW]
[ROW][C]28[/C][C]0.048404[/C][C]0.3354[/C][C]0.36941[/C][/ROW]
[ROW][C]29[/C][C]-0.112027[/C][C]-0.7761[/C][C]0.220736[/C][/ROW]
[ROW][C]30[/C][C]-0.029522[/C][C]-0.2045[/C][C]0.419401[/C][/ROW]
[ROW][C]31[/C][C]0.058768[/C][C]0.4072[/C][C]0.342852[/C][/ROW]
[ROW][C]32[/C][C]-0.017862[/C][C]-0.1238[/C][C]0.451014[/C][/ROW]
[ROW][C]33[/C][C]-0.12756[/C][C]-0.8838[/C][C]0.190616[/C][/ROW]
[ROW][C]34[/C][C]-0.157601[/C][C]-1.0919[/C][C]0.140166[/C][/ROW]
[ROW][C]35[/C][C]-0.015117[/C][C]-0.1047[/C][C]0.458513[/C][/ROW]
[ROW][C]36[/C][C]0.057076[/C][C]0.3954[/C][C]0.347137[/C][/ROW]
[/TABLE]
Source: https://freestatistics.org/blog/index.php?pk=60617&T=2

Globally Unique Identifier (entire table): ba.freestatistics.org/blog/index.php?pk=60617&T=2

As an alternative you can also use a QR Code:  

The GUIDs for individual cells are displayed in the table below:

Partial Autocorrelation Function
Time lag kPACF(k)T-STATP-value
10.7313335.06683e-06
2-0.185348-1.28410.10263
30.0209420.14510.442624
40.1474811.02180.156003
5-0.170565-1.18170.121571
60.0970270.67220.252334
7-0.002699-0.01870.49258
8-0.151465-1.04940.149629
90.0748760.51880.303158
10-0.099835-0.69170.246237
11-0.108842-0.75410.227242
12-0.018986-0.13150.447951
130.0556970.38590.350646
140.0610060.42270.337215
15-0.194943-1.35060.091577
160.0479860.33250.370496
17-0.160585-1.11260.135718
18-0.110867-0.76810.223093
190.0388060.26890.394596
200.0918790.63660.26372
21-0.157384-1.09040.140493
220.0311730.2160.414961
230.0143320.09930.460658
24-0.113012-0.7830.218746
250.2030091.40650.08301
26-0.022748-0.15760.437716
270.0099260.06880.47273
280.0484040.33540.36941
29-0.112027-0.77610.220736
30-0.029522-0.20450.419401
310.0587680.40720.342852
32-0.017862-0.12380.451014
33-0.12756-0.88380.190616
34-0.157601-1.09190.140166
35-0.015117-0.10470.458513
360.0570760.39540.347137


Parameters (Session):
par1 = 36 ; par2 = 1 ; par3 = 0 ; par4 = 1 ; par5 = 12 ; par6 = MA ; par7 = 0.95 ;
Parameters (R input):
par1 = 36 ; par2 = 1 ; par3 = 0 ; par4 = 1 ; par5 = 12 ; par6 = MA ; par7 = 0.95 ;
R code (references can be found in the software module):
if (par1 == 'Default') {
par1 = 10*log10(length(x))
} else {
par1 <- as.numeric(par1)
}
par2 <- as.numeric(par2)
par3 <- as.numeric(par3)
par4 <- as.numeric(par4)
par5 <- as.numeric(par5)
if (par6 == 'White Noise') par6 <- 'white' else par6 <- 'ma'
par7 <- as.numeric(par7)
if (par2 == 0) {
x <- log(x)
} else {
x <- (x ^ par2 - 1) / par2
}
if (par3 > 0) x <- diff(x,lag=1,difference=par3)
if (par4 > 0) x <- diff(x,lag=par5,difference=par4)
bitmap(file='pic1.png')
racf <- acf(x, par1, main='Autocorrelation', xlab='time lag', ylab='ACF', ci.type=par6, ci=par7, sub=paste('(lambda=',par2,', d=',par3,', D=',par4,', CI=', par7, ', CI type=',par6,')',sep=''))
dev.off()
bitmap(file='pic2.png')
rpacf <- pacf(x,par1,main='Partial Autocorrelation',xlab='lags',ylab='PACF')
dev.off()
(myacf <- c(racf$acf))
(mypacf <- c(rpacf$acf))
lengthx <- length(x)
sqrtn <- sqrt(lengthx)
load(file='createtable')
a<-table.start()
a<-table.row.start(a)
a<-table.element(a,'Autocorrelation Function',4,TRUE)
a<-table.row.end(a)
a<-table.row.start(a)
a<-table.element(a,'Time lag k',header=TRUE)
a<-table.element(a,hyperlink('basics.htm','ACF(k)','click here for more information about the Autocorrelation Function'),header=TRUE)
a<-table.element(a,'T-STAT',header=TRUE)
a<-table.element(a,'P-value',header=TRUE)
a<-table.row.end(a)
for (i in 2:(par1+1)) {
a<-table.row.start(a)
a<-table.element(a,i-1,header=TRUE)
a<-table.element(a,round(myacf[i],6))
mytstat <- myacf[i]*sqrtn
a<-table.element(a,round(mytstat,4))
a<-table.element(a,round(1-pt(abs(mytstat),lengthx),6))
a<-table.row.end(a)
}
a<-table.end(a)
table.save(a,file='mytable.tab')
a<-table.start()
a<-table.row.start(a)
a<-table.element(a,'Partial Autocorrelation Function',4,TRUE)
a<-table.row.end(a)
a<-table.row.start(a)
a<-table.element(a,'Time lag k',header=TRUE)
a<-table.element(a,hyperlink('basics.htm','PACF(k)','click here for more information about the Partial Autocorrelation Function'),header=TRUE)
a<-table.element(a,'T-STAT',header=TRUE)
a<-table.element(a,'P-value',header=TRUE)
a<-table.row.end(a)
for (i in 1:par1) {
a<-table.row.start(a)
a<-table.element(a,i,header=TRUE)
a<-table.element(a,round(mypacf[i],6))
mytstat <- mypacf[i]*sqrtn
a<-table.element(a,round(mytstat,4))
a<-table.element(a,round(1-pt(abs(mytstat),lengthx),6))
a<-table.row.end(a)
}
a<-table.end(a)
table.save(a,file='mytable1.tab')