Free Statistics

of Irreproducible Research!

Author's title

Author*The author of this computation has been verified*
R Software Modulerwasp_autocorrelation.wasp
Title produced by software(Partial) Autocorrelation Function
Date of computationFri, 27 Nov 2009 06:08:35 -0700
Cite this page as followsStatistical Computations at FreeStatistics.org, Office for Research Development and Education, URL https://freestatistics.org/blog/index.php?v=date/2009/Nov/27/t1259327455x2siza21bmky2v5.htm/, Retrieved Mon, 29 Apr 2024 04:17:49 +0000
Statistical Computations at FreeStatistics.org, Office for Research Development and Education, URL https://freestatistics.org/blog/index.php?pk=60711, Retrieved Mon, 29 Apr 2024 04:17:49 +0000
QR Codes:

Original text written by user:
IsPrivate?No (this computation is public)
User-defined keywordsWSH8 d=1
Estimated Impact124
Family? (F = Feedback message, R = changed R code, M = changed R Module, P = changed Parameters, D = changed Data)
-     [Univariate Explorative Data Analysis] [Run Sequence gebo...] [2008-12-12 13:32:37] [76963dc1903f0f612b6153510a3818cf]
- R  D  [Univariate Explorative Data Analysis] [Run Sequence gebo...] [2008-12-17 12:14:40] [76963dc1903f0f612b6153510a3818cf]
-         [Univariate Explorative Data Analysis] [Run Sequence Plot...] [2008-12-22 18:19:51] [1ce0d16c8f4225c977b42c8fa93bc163]
- RMP       [(Partial) Autocorrelation Function] [Identifying Integ...] [2009-11-22 12:16:10] [b98453cac15ba1066b407e146608df68]
-   PD          [(Partial) Autocorrelation Function] [Workshop 8] [2009-11-27 13:08:35] [e7a989b306049c061a54f626f1127c12] [Current]
Feedback Forum

Post a new message
Dataseries X:
130.7
117.2
110.8
111.4
108.2
108.8
110.2
109.5
109.5
116
111.2
112.1
114
119.1
114.1
115.1
115.4
110.8
116
119.2
126.5
127.8
131.3
140.3
137.3
143
134.5
139.9
159.3
170.4
175
175.8
180.9
180.3
169.6
172.3
184.8
177.7
184.6
211.4
215.3
215.9
244.7
259.3
289
310.9
321
315.1
333.2
314.1
284.7
273.9
216
196.4
190.9
206.4
196.3
199.5
198.9
214.4


Summary of computational transaction
Raw Inputview raw input (R code)
Raw Outputview raw output of R engine
Computing time1 seconds
R Server'Gwilym Jenkins' @ 72.249.127.135

\begin{tabular}{lllllllll}
\hline
Summary of computational transaction \tabularnewline
Raw Input & view raw input (R code)  \tabularnewline
Raw Output & view raw output of R engine  \tabularnewline
Computing time & 1 seconds \tabularnewline
R Server & 'Gwilym Jenkins' @ 72.249.127.135 \tabularnewline
\hline
\end{tabular}
%Source: https://freestatistics.org/blog/index.php?pk=60711&T=0

[TABLE]
[ROW][C]Summary of computational transaction[/C][/ROW]
[ROW][C]Raw Input[/C][C]view raw input (R code) [/C][/ROW]
[ROW][C]Raw Output[/C][C]view raw output of R engine [/C][/ROW]
[ROW][C]Computing time[/C][C]1 seconds[/C][/ROW]
[ROW][C]R Server[/C][C]'Gwilym Jenkins' @ 72.249.127.135[/C][/ROW]
[/TABLE]
Source: https://freestatistics.org/blog/index.php?pk=60711&T=0

Globally Unique Identifier (entire table): ba.freestatistics.org/blog/index.php?pk=60711&T=0

As an alternative you can also use a QR Code:  

The GUIDs for individual cells are displayed in the table below:

Summary of computational transaction
Raw Inputview raw input (R code)
Raw Outputview raw output of R engine
Computing time1 seconds
R Server'Gwilym Jenkins' @ 72.249.127.135


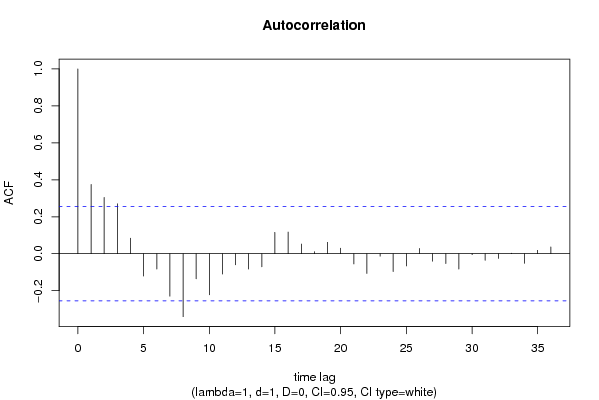
Autocorrelation Function
Time lag kACF(k)T-STATP-value
10.3753612.88320.002743
20.3049082.3420.011287
30.2699862.07380.021236
40.0844850.64890.259447
5-0.120705-0.92710.178813
6-0.08283-0.63620.263543
7-0.229931-1.76610.041273
8-0.340461-2.61510.005653
9-0.135461-1.04050.151177
10-0.222336-1.70780.046466
11-0.110045-0.84530.200688
12-0.059827-0.45950.323767
13-0.08279-0.63590.263643
14-0.070536-0.54180.294999
150.115620.88810.189049
160.1173080.90110.18561
170.0521640.40070.345053
180.0108080.0830.467058
190.0616050.47320.318909
200.0303060.23280.408368
21-0.055299-0.42480.336277
22-0.106756-0.820.207756
23-0.013615-0.10460.458534
24-0.09658-0.74180.230562
25-0.066125-0.50790.306703
260.0289450.22230.412413
27-0.040038-0.30750.379759
28-0.053186-0.40850.342183
29-0.082744-0.63560.263758
30-0.005255-0.04040.483968
31-0.035353-0.27160.393456
32-0.025467-0.19560.422791
330.0033150.02550.489887
34-0.051764-0.39760.346179
350.0188910.14510.442562
360.0369440.28380.388788

\begin{tabular}{lllllllll}
\hline
Autocorrelation Function \tabularnewline
Time lag k & ACF(k) & T-STAT & P-value \tabularnewline
1 & 0.375361 & 2.8832 & 0.002743 \tabularnewline
2 & 0.304908 & 2.342 & 0.011287 \tabularnewline
3 & 0.269986 & 2.0738 & 0.021236 \tabularnewline
4 & 0.084485 & 0.6489 & 0.259447 \tabularnewline
5 & -0.120705 & -0.9271 & 0.178813 \tabularnewline
6 & -0.08283 & -0.6362 & 0.263543 \tabularnewline
7 & -0.229931 & -1.7661 & 0.041273 \tabularnewline
8 & -0.340461 & -2.6151 & 0.005653 \tabularnewline
9 & -0.135461 & -1.0405 & 0.151177 \tabularnewline
10 & -0.222336 & -1.7078 & 0.046466 \tabularnewline
11 & -0.110045 & -0.8453 & 0.200688 \tabularnewline
12 & -0.059827 & -0.4595 & 0.323767 \tabularnewline
13 & -0.08279 & -0.6359 & 0.263643 \tabularnewline
14 & -0.070536 & -0.5418 & 0.294999 \tabularnewline
15 & 0.11562 & 0.8881 & 0.189049 \tabularnewline
16 & 0.117308 & 0.9011 & 0.18561 \tabularnewline
17 & 0.052164 & 0.4007 & 0.345053 \tabularnewline
18 & 0.010808 & 0.083 & 0.467058 \tabularnewline
19 & 0.061605 & 0.4732 & 0.318909 \tabularnewline
20 & 0.030306 & 0.2328 & 0.408368 \tabularnewline
21 & -0.055299 & -0.4248 & 0.336277 \tabularnewline
22 & -0.106756 & -0.82 & 0.207756 \tabularnewline
23 & -0.013615 & -0.1046 & 0.458534 \tabularnewline
24 & -0.09658 & -0.7418 & 0.230562 \tabularnewline
25 & -0.066125 & -0.5079 & 0.306703 \tabularnewline
26 & 0.028945 & 0.2223 & 0.412413 \tabularnewline
27 & -0.040038 & -0.3075 & 0.379759 \tabularnewline
28 & -0.053186 & -0.4085 & 0.342183 \tabularnewline
29 & -0.082744 & -0.6356 & 0.263758 \tabularnewline
30 & -0.005255 & -0.0404 & 0.483968 \tabularnewline
31 & -0.035353 & -0.2716 & 0.393456 \tabularnewline
32 & -0.025467 & -0.1956 & 0.422791 \tabularnewline
33 & 0.003315 & 0.0255 & 0.489887 \tabularnewline
34 & -0.051764 & -0.3976 & 0.346179 \tabularnewline
35 & 0.018891 & 0.1451 & 0.442562 \tabularnewline
36 & 0.036944 & 0.2838 & 0.388788 \tabularnewline
\hline
\end{tabular}
%Source: https://freestatistics.org/blog/index.php?pk=60711&T=1

[TABLE]
[ROW][C]Autocorrelation Function[/C][/ROW]
[ROW][C]Time lag k[/C][C]ACF(k)[/C][C]T-STAT[/C][C]P-value[/C][/ROW]
[ROW][C]1[/C][C]0.375361[/C][C]2.8832[/C][C]0.002743[/C][/ROW]
[ROW][C]2[/C][C]0.304908[/C][C]2.342[/C][C]0.011287[/C][/ROW]
[ROW][C]3[/C][C]0.269986[/C][C]2.0738[/C][C]0.021236[/C][/ROW]
[ROW][C]4[/C][C]0.084485[/C][C]0.6489[/C][C]0.259447[/C][/ROW]
[ROW][C]5[/C][C]-0.120705[/C][C]-0.9271[/C][C]0.178813[/C][/ROW]
[ROW][C]6[/C][C]-0.08283[/C][C]-0.6362[/C][C]0.263543[/C][/ROW]
[ROW][C]7[/C][C]-0.229931[/C][C]-1.7661[/C][C]0.041273[/C][/ROW]
[ROW][C]8[/C][C]-0.340461[/C][C]-2.6151[/C][C]0.005653[/C][/ROW]
[ROW][C]9[/C][C]-0.135461[/C][C]-1.0405[/C][C]0.151177[/C][/ROW]
[ROW][C]10[/C][C]-0.222336[/C][C]-1.7078[/C][C]0.046466[/C][/ROW]
[ROW][C]11[/C][C]-0.110045[/C][C]-0.8453[/C][C]0.200688[/C][/ROW]
[ROW][C]12[/C][C]-0.059827[/C][C]-0.4595[/C][C]0.323767[/C][/ROW]
[ROW][C]13[/C][C]-0.08279[/C][C]-0.6359[/C][C]0.263643[/C][/ROW]
[ROW][C]14[/C][C]-0.070536[/C][C]-0.5418[/C][C]0.294999[/C][/ROW]
[ROW][C]15[/C][C]0.11562[/C][C]0.8881[/C][C]0.189049[/C][/ROW]
[ROW][C]16[/C][C]0.117308[/C][C]0.9011[/C][C]0.18561[/C][/ROW]
[ROW][C]17[/C][C]0.052164[/C][C]0.4007[/C][C]0.345053[/C][/ROW]
[ROW][C]18[/C][C]0.010808[/C][C]0.083[/C][C]0.467058[/C][/ROW]
[ROW][C]19[/C][C]0.061605[/C][C]0.4732[/C][C]0.318909[/C][/ROW]
[ROW][C]20[/C][C]0.030306[/C][C]0.2328[/C][C]0.408368[/C][/ROW]
[ROW][C]21[/C][C]-0.055299[/C][C]-0.4248[/C][C]0.336277[/C][/ROW]
[ROW][C]22[/C][C]-0.106756[/C][C]-0.82[/C][C]0.207756[/C][/ROW]
[ROW][C]23[/C][C]-0.013615[/C][C]-0.1046[/C][C]0.458534[/C][/ROW]
[ROW][C]24[/C][C]-0.09658[/C][C]-0.7418[/C][C]0.230562[/C][/ROW]
[ROW][C]25[/C][C]-0.066125[/C][C]-0.5079[/C][C]0.306703[/C][/ROW]
[ROW][C]26[/C][C]0.028945[/C][C]0.2223[/C][C]0.412413[/C][/ROW]
[ROW][C]27[/C][C]-0.040038[/C][C]-0.3075[/C][C]0.379759[/C][/ROW]
[ROW][C]28[/C][C]-0.053186[/C][C]-0.4085[/C][C]0.342183[/C][/ROW]
[ROW][C]29[/C][C]-0.082744[/C][C]-0.6356[/C][C]0.263758[/C][/ROW]
[ROW][C]30[/C][C]-0.005255[/C][C]-0.0404[/C][C]0.483968[/C][/ROW]
[ROW][C]31[/C][C]-0.035353[/C][C]-0.2716[/C][C]0.393456[/C][/ROW]
[ROW][C]32[/C][C]-0.025467[/C][C]-0.1956[/C][C]0.422791[/C][/ROW]
[ROW][C]33[/C][C]0.003315[/C][C]0.0255[/C][C]0.489887[/C][/ROW]
[ROW][C]34[/C][C]-0.051764[/C][C]-0.3976[/C][C]0.346179[/C][/ROW]
[ROW][C]35[/C][C]0.018891[/C][C]0.1451[/C][C]0.442562[/C][/ROW]
[ROW][C]36[/C][C]0.036944[/C][C]0.2838[/C][C]0.388788[/C][/ROW]
[/TABLE]
Source: https://freestatistics.org/blog/index.php?pk=60711&T=1

Globally Unique Identifier (entire table): ba.freestatistics.org/blog/index.php?pk=60711&T=1

As an alternative you can also use a QR Code:  

The GUIDs for individual cells are displayed in the table below:

Autocorrelation Function
Time lag kACF(k)T-STATP-value
10.3753612.88320.002743
20.3049082.3420.011287
30.2699862.07380.021236
40.0844850.64890.259447
5-0.120705-0.92710.178813
6-0.08283-0.63620.263543
7-0.229931-1.76610.041273
8-0.340461-2.61510.005653
9-0.135461-1.04050.151177
10-0.222336-1.70780.046466
11-0.110045-0.84530.200688
12-0.059827-0.45950.323767
13-0.08279-0.63590.263643
14-0.070536-0.54180.294999
150.115620.88810.189049
160.1173080.90110.18561
170.0521640.40070.345053
180.0108080.0830.467058
190.0616050.47320.318909
200.0303060.23280.408368
21-0.055299-0.42480.336277
22-0.106756-0.820.207756
23-0.013615-0.10460.458534
24-0.09658-0.74180.230562
25-0.066125-0.50790.306703
260.0289450.22230.412413
27-0.040038-0.30750.379759
28-0.053186-0.40850.342183
29-0.082744-0.63560.263758
30-0.005255-0.04040.483968
31-0.035353-0.27160.393456
32-0.025467-0.19560.422791
330.0033150.02550.489887
34-0.051764-0.39760.346179
350.0188910.14510.442562
360.0369440.28380.388788


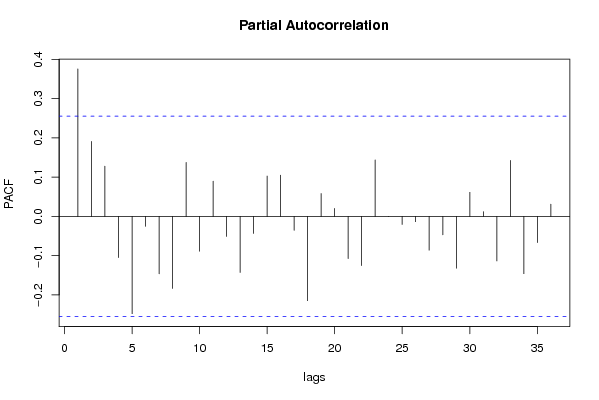
Partial Autocorrelation Function
Time lag kPACF(k)T-STATP-value
10.3753612.88320.002743
20.1909111.46640.073923
30.1277190.9810.165292
4-0.104694-0.80420.212264
5-0.247545-1.90140.031066
6-0.025092-0.19270.423915
7-0.146267-1.12350.132888
8-0.183342-1.40830.082148
90.1374651.05590.147662
10-0.08854-0.68010.249554
110.0896230.68840.246947
12-0.050903-0.3910.348606
13-0.1427-1.09610.138745
14-0.043323-0.33280.370243
150.1026470.78840.216797
160.1048510.80540.211919
17-0.035411-0.2720.393286
18-0.214383-1.64670.052467
190.0581340.44650.328422
200.0204490.15710.437863
21-0.107457-0.82540.206236
22-0.125189-0.96160.170088
230.1438311.10480.136868
245e-054e-040.499847
25-0.020337-0.15620.4382
26-0.013561-0.10420.458695
27-0.08607-0.66110.255556
28-0.046895-0.36020.35999
29-0.131694-1.01160.157939
300.061480.47220.319249
310.0120580.09260.463261
32-0.113337-0.87060.193761
330.1425431.09490.139007
34-0.145724-1.11930.133768
35-0.066568-0.51130.305519
360.0311610.23940.405831

\begin{tabular}{lllllllll}
\hline
Partial Autocorrelation Function \tabularnewline
Time lag k & PACF(k) & T-STAT & P-value \tabularnewline
1 & 0.375361 & 2.8832 & 0.002743 \tabularnewline
2 & 0.190911 & 1.4664 & 0.073923 \tabularnewline
3 & 0.127719 & 0.981 & 0.165292 \tabularnewline
4 & -0.104694 & -0.8042 & 0.212264 \tabularnewline
5 & -0.247545 & -1.9014 & 0.031066 \tabularnewline
6 & -0.025092 & -0.1927 & 0.423915 \tabularnewline
7 & -0.146267 & -1.1235 & 0.132888 \tabularnewline
8 & -0.183342 & -1.4083 & 0.082148 \tabularnewline
9 & 0.137465 & 1.0559 & 0.147662 \tabularnewline
10 & -0.08854 & -0.6801 & 0.249554 \tabularnewline
11 & 0.089623 & 0.6884 & 0.246947 \tabularnewline
12 & -0.050903 & -0.391 & 0.348606 \tabularnewline
13 & -0.1427 & -1.0961 & 0.138745 \tabularnewline
14 & -0.043323 & -0.3328 & 0.370243 \tabularnewline
15 & 0.102647 & 0.7884 & 0.216797 \tabularnewline
16 & 0.104851 & 0.8054 & 0.211919 \tabularnewline
17 & -0.035411 & -0.272 & 0.393286 \tabularnewline
18 & -0.214383 & -1.6467 & 0.052467 \tabularnewline
19 & 0.058134 & 0.4465 & 0.328422 \tabularnewline
20 & 0.020449 & 0.1571 & 0.437863 \tabularnewline
21 & -0.107457 & -0.8254 & 0.206236 \tabularnewline
22 & -0.125189 & -0.9616 & 0.170088 \tabularnewline
23 & 0.143831 & 1.1048 & 0.136868 \tabularnewline
24 & 5e-05 & 4e-04 & 0.499847 \tabularnewline
25 & -0.020337 & -0.1562 & 0.4382 \tabularnewline
26 & -0.013561 & -0.1042 & 0.458695 \tabularnewline
27 & -0.08607 & -0.6611 & 0.255556 \tabularnewline
28 & -0.046895 & -0.3602 & 0.35999 \tabularnewline
29 & -0.131694 & -1.0116 & 0.157939 \tabularnewline
30 & 0.06148 & 0.4722 & 0.319249 \tabularnewline
31 & 0.012058 & 0.0926 & 0.463261 \tabularnewline
32 & -0.113337 & -0.8706 & 0.193761 \tabularnewline
33 & 0.142543 & 1.0949 & 0.139007 \tabularnewline
34 & -0.145724 & -1.1193 & 0.133768 \tabularnewline
35 & -0.066568 & -0.5113 & 0.305519 \tabularnewline
36 & 0.031161 & 0.2394 & 0.405831 \tabularnewline
\hline
\end{tabular}
%Source: https://freestatistics.org/blog/index.php?pk=60711&T=2

[TABLE]
[ROW][C]Partial Autocorrelation Function[/C][/ROW]
[ROW][C]Time lag k[/C][C]PACF(k)[/C][C]T-STAT[/C][C]P-value[/C][/ROW]
[ROW][C]1[/C][C]0.375361[/C][C]2.8832[/C][C]0.002743[/C][/ROW]
[ROW][C]2[/C][C]0.190911[/C][C]1.4664[/C][C]0.073923[/C][/ROW]
[ROW][C]3[/C][C]0.127719[/C][C]0.981[/C][C]0.165292[/C][/ROW]
[ROW][C]4[/C][C]-0.104694[/C][C]-0.8042[/C][C]0.212264[/C][/ROW]
[ROW][C]5[/C][C]-0.247545[/C][C]-1.9014[/C][C]0.031066[/C][/ROW]
[ROW][C]6[/C][C]-0.025092[/C][C]-0.1927[/C][C]0.423915[/C][/ROW]
[ROW][C]7[/C][C]-0.146267[/C][C]-1.1235[/C][C]0.132888[/C][/ROW]
[ROW][C]8[/C][C]-0.183342[/C][C]-1.4083[/C][C]0.082148[/C][/ROW]
[ROW][C]9[/C][C]0.137465[/C][C]1.0559[/C][C]0.147662[/C][/ROW]
[ROW][C]10[/C][C]-0.08854[/C][C]-0.6801[/C][C]0.249554[/C][/ROW]
[ROW][C]11[/C][C]0.089623[/C][C]0.6884[/C][C]0.246947[/C][/ROW]
[ROW][C]12[/C][C]-0.050903[/C][C]-0.391[/C][C]0.348606[/C][/ROW]
[ROW][C]13[/C][C]-0.1427[/C][C]-1.0961[/C][C]0.138745[/C][/ROW]
[ROW][C]14[/C][C]-0.043323[/C][C]-0.3328[/C][C]0.370243[/C][/ROW]
[ROW][C]15[/C][C]0.102647[/C][C]0.7884[/C][C]0.216797[/C][/ROW]
[ROW][C]16[/C][C]0.104851[/C][C]0.8054[/C][C]0.211919[/C][/ROW]
[ROW][C]17[/C][C]-0.035411[/C][C]-0.272[/C][C]0.393286[/C][/ROW]
[ROW][C]18[/C][C]-0.214383[/C][C]-1.6467[/C][C]0.052467[/C][/ROW]
[ROW][C]19[/C][C]0.058134[/C][C]0.4465[/C][C]0.328422[/C][/ROW]
[ROW][C]20[/C][C]0.020449[/C][C]0.1571[/C][C]0.437863[/C][/ROW]
[ROW][C]21[/C][C]-0.107457[/C][C]-0.8254[/C][C]0.206236[/C][/ROW]
[ROW][C]22[/C][C]-0.125189[/C][C]-0.9616[/C][C]0.170088[/C][/ROW]
[ROW][C]23[/C][C]0.143831[/C][C]1.1048[/C][C]0.136868[/C][/ROW]
[ROW][C]24[/C][C]5e-05[/C][C]4e-04[/C][C]0.499847[/C][/ROW]
[ROW][C]25[/C][C]-0.020337[/C][C]-0.1562[/C][C]0.4382[/C][/ROW]
[ROW][C]26[/C][C]-0.013561[/C][C]-0.1042[/C][C]0.458695[/C][/ROW]
[ROW][C]27[/C][C]-0.08607[/C][C]-0.6611[/C][C]0.255556[/C][/ROW]
[ROW][C]28[/C][C]-0.046895[/C][C]-0.3602[/C][C]0.35999[/C][/ROW]
[ROW][C]29[/C][C]-0.131694[/C][C]-1.0116[/C][C]0.157939[/C][/ROW]
[ROW][C]30[/C][C]0.06148[/C][C]0.4722[/C][C]0.319249[/C][/ROW]
[ROW][C]31[/C][C]0.012058[/C][C]0.0926[/C][C]0.463261[/C][/ROW]
[ROW][C]32[/C][C]-0.113337[/C][C]-0.8706[/C][C]0.193761[/C][/ROW]
[ROW][C]33[/C][C]0.142543[/C][C]1.0949[/C][C]0.139007[/C][/ROW]
[ROW][C]34[/C][C]-0.145724[/C][C]-1.1193[/C][C]0.133768[/C][/ROW]
[ROW][C]35[/C][C]-0.066568[/C][C]-0.5113[/C][C]0.305519[/C][/ROW]
[ROW][C]36[/C][C]0.031161[/C][C]0.2394[/C][C]0.405831[/C][/ROW]
[/TABLE]
Source: https://freestatistics.org/blog/index.php?pk=60711&T=2

Globally Unique Identifier (entire table): ba.freestatistics.org/blog/index.php?pk=60711&T=2

As an alternative you can also use a QR Code:  

The GUIDs for individual cells are displayed in the table below:

Partial Autocorrelation Function
Time lag kPACF(k)T-STATP-value
10.3753612.88320.002743
20.1909111.46640.073923
30.1277190.9810.165292
4-0.104694-0.80420.212264
5-0.247545-1.90140.031066
6-0.025092-0.19270.423915
7-0.146267-1.12350.132888
8-0.183342-1.40830.082148
90.1374651.05590.147662
10-0.08854-0.68010.249554
110.0896230.68840.246947
12-0.050903-0.3910.348606
13-0.1427-1.09610.138745
14-0.043323-0.33280.370243
150.1026470.78840.216797
160.1048510.80540.211919
17-0.035411-0.2720.393286
18-0.214383-1.64670.052467
190.0581340.44650.328422
200.0204490.15710.437863
21-0.107457-0.82540.206236
22-0.125189-0.96160.170088
230.1438311.10480.136868
245e-054e-040.499847
25-0.020337-0.15620.4382
26-0.013561-0.10420.458695
27-0.08607-0.66110.255556
28-0.046895-0.36020.35999
29-0.131694-1.01160.157939
300.061480.47220.319249
310.0120580.09260.463261
32-0.113337-0.87060.193761
330.1425431.09490.139007
34-0.145724-1.11930.133768
35-0.066568-0.51130.305519
360.0311610.23940.405831


Parameters (Session):
par1 = 36 ; par2 = 1 ; par3 = 1 ; par4 = 0 ; par5 = 12 ; par6 = White Noise ; par7 = 0.95 ;
Parameters (R input):
par1 = 36 ; par2 = 1 ; par3 = 1 ; par4 = 0 ; par5 = 12 ; par6 = White Noise ; par7 = 0.95 ;
R code (references can be found in the software module):
if (par1 == 'Default') {
par1 = 10*log10(length(x))
} else {
par1 <- as.numeric(par1)
}
par2 <- as.numeric(par2)
par3 <- as.numeric(par3)
par4 <- as.numeric(par4)
par5 <- as.numeric(par5)
if (par6 == 'White Noise') par6 <- 'white' else par6 <- 'ma'
par7 <- as.numeric(par7)
if (par2 == 0) {
x <- log(x)
} else {
x <- (x ^ par2 - 1) / par2
}
if (par3 > 0) x <- diff(x,lag=1,difference=par3)
if (par4 > 0) x <- diff(x,lag=par5,difference=par4)
bitmap(file='pic1.png')
racf <- acf(x, par1, main='Autocorrelation', xlab='time lag', ylab='ACF', ci.type=par6, ci=par7, sub=paste('(lambda=',par2,', d=',par3,', D=',par4,', CI=', par7, ', CI type=',par6,')',sep=''))
dev.off()
bitmap(file='pic2.png')
rpacf <- pacf(x,par1,main='Partial Autocorrelation',xlab='lags',ylab='PACF')
dev.off()
(myacf <- c(racf$acf))
(mypacf <- c(rpacf$acf))
lengthx <- length(x)
sqrtn <- sqrt(lengthx)
load(file='createtable')
a<-table.start()
a<-table.row.start(a)
a<-table.element(a,'Autocorrelation Function',4,TRUE)
a<-table.row.end(a)
a<-table.row.start(a)
a<-table.element(a,'Time lag k',header=TRUE)
a<-table.element(a,hyperlink('basics.htm','ACF(k)','click here for more information about the Autocorrelation Function'),header=TRUE)
a<-table.element(a,'T-STAT',header=TRUE)
a<-table.element(a,'P-value',header=TRUE)
a<-table.row.end(a)
for (i in 2:(par1+1)) {
a<-table.row.start(a)
a<-table.element(a,i-1,header=TRUE)
a<-table.element(a,round(myacf[i],6))
mytstat <- myacf[i]*sqrtn
a<-table.element(a,round(mytstat,4))
a<-table.element(a,round(1-pt(abs(mytstat),lengthx),6))
a<-table.row.end(a)
}
a<-table.end(a)
table.save(a,file='mytable.tab')
a<-table.start()
a<-table.row.start(a)
a<-table.element(a,'Partial Autocorrelation Function',4,TRUE)
a<-table.row.end(a)
a<-table.row.start(a)
a<-table.element(a,'Time lag k',header=TRUE)
a<-table.element(a,hyperlink('basics.htm','PACF(k)','click here for more information about the Partial Autocorrelation Function'),header=TRUE)
a<-table.element(a,'T-STAT',header=TRUE)
a<-table.element(a,'P-value',header=TRUE)
a<-table.row.end(a)
for (i in 1:par1) {
a<-table.row.start(a)
a<-table.element(a,i,header=TRUE)
a<-table.element(a,round(mypacf[i],6))
mytstat <- mypacf[i]*sqrtn
a<-table.element(a,round(mytstat,4))
a<-table.element(a,round(1-pt(abs(mytstat),lengthx),6))
a<-table.row.end(a)
}
a<-table.end(a)
table.save(a,file='mytable1.tab')