Free Statistics

of Irreproducible Research!

Author's title

Author*The author of this computation has been verified*
R Software Modulerwasp_autocorrelation.wasp
Title produced by software(Partial) Autocorrelation Function
Date of computationFri, 27 Nov 2009 08:49:14 -0700
Cite this page as followsStatistical Computations at FreeStatistics.org, Office for Research Development and Education, URL https://freestatistics.org/blog/index.php?v=date/2009/Nov/27/t1259337239d0gi3krayqm0vxi.htm/, Retrieved Mon, 29 Apr 2024 00:05:50 +0000
Statistical Computations at FreeStatistics.org, Office for Research Development and Education, URL https://freestatistics.org/blog/index.php?pk=60917, Retrieved Mon, 29 Apr 2024 00:05:50 +0000
QR Codes:

Original text written by user:
IsPrivate?No (this computation is public)
User-defined keywords
Estimated Impact115
Family? (F = Feedback message, R = changed R code, M = changed R Module, P = changed Parameters, D = changed Data)
-     [Univariate Explorative Data Analysis] [Run Sequence gebo...] [2008-12-12 13:32:37] [76963dc1903f0f612b6153510a3818cf]
- R  D  [Univariate Explorative Data Analysis] [Run Sequence gebo...] [2008-12-17 12:14:40] [76963dc1903f0f612b6153510a3818cf]
-         [Univariate Explorative Data Analysis] [Run Sequence Plot...] [2008-12-22 18:19:51] [1ce0d16c8f4225c977b42c8fa93bc163]
- RMP       [(Partial) Autocorrelation Function] [Identifying Integ...] [2009-11-22 12:16:10] [b98453cac15ba1066b407e146608df68]
- R  D          [(Partial) Autocorrelation Function] [] [2009-11-27 15:49:14] [1c773da0103d9327c2f1f790e2d74438] [Current]
Feedback Forum

Post a new message
Dataseries X:
1.4816
1.4562
1.4268
1.4088
1.4016
1.3650
1.3190
1.3050
1.2785
1.3239
1.3449
1.2732
1.3322
1.4369
1.4975
1.5770
1.5553
1.5557
1.5750
1.5527
1.4748
1.4718
1.4570
1.4684
1.4227
1.3896
1.3622
1.3716
1.3419
1.3511
1.3516
1.3242
1.3074
1.2999
1.3213
1.2881


Summary of computational transaction
Raw Inputview raw input (R code)
Raw Outputview raw output of R engine
Computing time2 seconds
R Server'Gwilym Jenkins' @ 72.249.127.135

\begin{tabular}{lllllllll}
\hline
Summary of computational transaction \tabularnewline
Raw Input & view raw input (R code)  \tabularnewline
Raw Output & view raw output of R engine  \tabularnewline
Computing time & 2 seconds \tabularnewline
R Server & 'Gwilym Jenkins' @ 72.249.127.135 \tabularnewline
\hline
\end{tabular}
%Source: https://freestatistics.org/blog/index.php?pk=60917&T=0

[TABLE]
[ROW][C]Summary of computational transaction[/C][/ROW]
[ROW][C]Raw Input[/C][C]view raw input (R code) [/C][/ROW]
[ROW][C]Raw Output[/C][C]view raw output of R engine [/C][/ROW]
[ROW][C]Computing time[/C][C]2 seconds[/C][/ROW]
[ROW][C]R Server[/C][C]'Gwilym Jenkins' @ 72.249.127.135[/C][/ROW]
[/TABLE]
Source: https://freestatistics.org/blog/index.php?pk=60917&T=0

Globally Unique Identifier (entire table): ba.freestatistics.org/blog/index.php?pk=60917&T=0

As an alternative you can also use a QR Code:  

The GUIDs for individual cells are displayed in the table below:

Summary of computational transaction
Raw Inputview raw input (R code)
Raw Outputview raw output of R engine
Computing time2 seconds
R Server'Gwilym Jenkins' @ 72.249.127.135


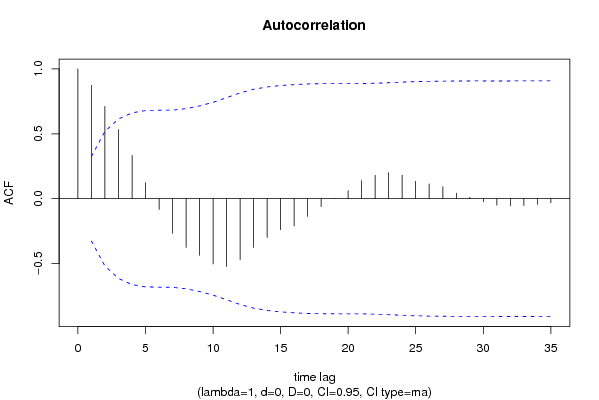
Autocorrelation Function
Time lag kACF(k)T-STATP-value
10.8735415.24124e-06
20.7110534.26636.9e-05
30.5326333.19580.00145
40.3334982.0010.026489
50.1240130.74410.230829
6-0.082498-0.4950.311809
7-0.266613-1.59970.059205
8-0.375998-2.2560.015121
9-0.436521-2.61910.00641
10-0.503204-3.01920.002319
11-0.523216-3.13930.001687
12-0.468944-2.81370.003944
13-0.375953-2.25570.01513
14-0.298637-1.79180.040785
15-0.2384-1.43040.080613
16-0.209422-1.25650.108508
17-0.136998-0.8220.208248
18-0.060518-0.36310.359323
190.0026680.0160.493658
200.0615220.36910.357096
210.1399040.83940.203386
220.1798631.07920.143843
230.2018981.21140.116819
240.1811371.08680.14217
250.1336160.80170.213995
260.1136660.6820.249803
270.0920530.55230.292072
280.0422850.25370.400582
290.0107390.06440.47449
30-0.02438-0.14630.442259
31-0.049762-0.29860.383492
32-0.054891-0.32930.371902
33-0.053097-0.31860.375943
34-0.043635-0.26180.39748
35-0.031404-0.18840.425802
36NANANA

\begin{tabular}{lllllllll}
\hline
Autocorrelation Function \tabularnewline
Time lag k & ACF(k) & T-STAT & P-value \tabularnewline
1 & 0.873541 & 5.2412 & 4e-06 \tabularnewline
2 & 0.711053 & 4.2663 & 6.9e-05 \tabularnewline
3 & 0.532633 & 3.1958 & 0.00145 \tabularnewline
4 & 0.333498 & 2.001 & 0.026489 \tabularnewline
5 & 0.124013 & 0.7441 & 0.230829 \tabularnewline
6 & -0.082498 & -0.495 & 0.311809 \tabularnewline
7 & -0.266613 & -1.5997 & 0.059205 \tabularnewline
8 & -0.375998 & -2.256 & 0.015121 \tabularnewline
9 & -0.436521 & -2.6191 & 0.00641 \tabularnewline
10 & -0.503204 & -3.0192 & 0.002319 \tabularnewline
11 & -0.523216 & -3.1393 & 0.001687 \tabularnewline
12 & -0.468944 & -2.8137 & 0.003944 \tabularnewline
13 & -0.375953 & -2.2557 & 0.01513 \tabularnewline
14 & -0.298637 & -1.7918 & 0.040785 \tabularnewline
15 & -0.2384 & -1.4304 & 0.080613 \tabularnewline
16 & -0.209422 & -1.2565 & 0.108508 \tabularnewline
17 & -0.136998 & -0.822 & 0.208248 \tabularnewline
18 & -0.060518 & -0.3631 & 0.359323 \tabularnewline
19 & 0.002668 & 0.016 & 0.493658 \tabularnewline
20 & 0.061522 & 0.3691 & 0.357096 \tabularnewline
21 & 0.139904 & 0.8394 & 0.203386 \tabularnewline
22 & 0.179863 & 1.0792 & 0.143843 \tabularnewline
23 & 0.201898 & 1.2114 & 0.116819 \tabularnewline
24 & 0.181137 & 1.0868 & 0.14217 \tabularnewline
25 & 0.133616 & 0.8017 & 0.213995 \tabularnewline
26 & 0.113666 & 0.682 & 0.249803 \tabularnewline
27 & 0.092053 & 0.5523 & 0.292072 \tabularnewline
28 & 0.042285 & 0.2537 & 0.400582 \tabularnewline
29 & 0.010739 & 0.0644 & 0.47449 \tabularnewline
30 & -0.02438 & -0.1463 & 0.442259 \tabularnewline
31 & -0.049762 & -0.2986 & 0.383492 \tabularnewline
32 & -0.054891 & -0.3293 & 0.371902 \tabularnewline
33 & -0.053097 & -0.3186 & 0.375943 \tabularnewline
34 & -0.043635 & -0.2618 & 0.39748 \tabularnewline
35 & -0.031404 & -0.1884 & 0.425802 \tabularnewline
36 & NA & NA & NA \tabularnewline
\hline
\end{tabular}
%Source: https://freestatistics.org/blog/index.php?pk=60917&T=1

[TABLE]
[ROW][C]Autocorrelation Function[/C][/ROW]
[ROW][C]Time lag k[/C][C]ACF(k)[/C][C]T-STAT[/C][C]P-value[/C][/ROW]
[ROW][C]1[/C][C]0.873541[/C][C]5.2412[/C][C]4e-06[/C][/ROW]
[ROW][C]2[/C][C]0.711053[/C][C]4.2663[/C][C]6.9e-05[/C][/ROW]
[ROW][C]3[/C][C]0.532633[/C][C]3.1958[/C][C]0.00145[/C][/ROW]
[ROW][C]4[/C][C]0.333498[/C][C]2.001[/C][C]0.026489[/C][/ROW]
[ROW][C]5[/C][C]0.124013[/C][C]0.7441[/C][C]0.230829[/C][/ROW]
[ROW][C]6[/C][C]-0.082498[/C][C]-0.495[/C][C]0.311809[/C][/ROW]
[ROW][C]7[/C][C]-0.266613[/C][C]-1.5997[/C][C]0.059205[/C][/ROW]
[ROW][C]8[/C][C]-0.375998[/C][C]-2.256[/C][C]0.015121[/C][/ROW]
[ROW][C]9[/C][C]-0.436521[/C][C]-2.6191[/C][C]0.00641[/C][/ROW]
[ROW][C]10[/C][C]-0.503204[/C][C]-3.0192[/C][C]0.002319[/C][/ROW]
[ROW][C]11[/C][C]-0.523216[/C][C]-3.1393[/C][C]0.001687[/C][/ROW]
[ROW][C]12[/C][C]-0.468944[/C][C]-2.8137[/C][C]0.003944[/C][/ROW]
[ROW][C]13[/C][C]-0.375953[/C][C]-2.2557[/C][C]0.01513[/C][/ROW]
[ROW][C]14[/C][C]-0.298637[/C][C]-1.7918[/C][C]0.040785[/C][/ROW]
[ROW][C]15[/C][C]-0.2384[/C][C]-1.4304[/C][C]0.080613[/C][/ROW]
[ROW][C]16[/C][C]-0.209422[/C][C]-1.2565[/C][C]0.108508[/C][/ROW]
[ROW][C]17[/C][C]-0.136998[/C][C]-0.822[/C][C]0.208248[/C][/ROW]
[ROW][C]18[/C][C]-0.060518[/C][C]-0.3631[/C][C]0.359323[/C][/ROW]
[ROW][C]19[/C][C]0.002668[/C][C]0.016[/C][C]0.493658[/C][/ROW]
[ROW][C]20[/C][C]0.061522[/C][C]0.3691[/C][C]0.357096[/C][/ROW]
[ROW][C]21[/C][C]0.139904[/C][C]0.8394[/C][C]0.203386[/C][/ROW]
[ROW][C]22[/C][C]0.179863[/C][C]1.0792[/C][C]0.143843[/C][/ROW]
[ROW][C]23[/C][C]0.201898[/C][C]1.2114[/C][C]0.116819[/C][/ROW]
[ROW][C]24[/C][C]0.181137[/C][C]1.0868[/C][C]0.14217[/C][/ROW]
[ROW][C]25[/C][C]0.133616[/C][C]0.8017[/C][C]0.213995[/C][/ROW]
[ROW][C]26[/C][C]0.113666[/C][C]0.682[/C][C]0.249803[/C][/ROW]
[ROW][C]27[/C][C]0.092053[/C][C]0.5523[/C][C]0.292072[/C][/ROW]
[ROW][C]28[/C][C]0.042285[/C][C]0.2537[/C][C]0.400582[/C][/ROW]
[ROW][C]29[/C][C]0.010739[/C][C]0.0644[/C][C]0.47449[/C][/ROW]
[ROW][C]30[/C][C]-0.02438[/C][C]-0.1463[/C][C]0.442259[/C][/ROW]
[ROW][C]31[/C][C]-0.049762[/C][C]-0.2986[/C][C]0.383492[/C][/ROW]
[ROW][C]32[/C][C]-0.054891[/C][C]-0.3293[/C][C]0.371902[/C][/ROW]
[ROW][C]33[/C][C]-0.053097[/C][C]-0.3186[/C][C]0.375943[/C][/ROW]
[ROW][C]34[/C][C]-0.043635[/C][C]-0.2618[/C][C]0.39748[/C][/ROW]
[ROW][C]35[/C][C]-0.031404[/C][C]-0.1884[/C][C]0.425802[/C][/ROW]
[ROW][C]36[/C][C]NA[/C][C]NA[/C][C]NA[/C][/ROW]
[/TABLE]
Source: https://freestatistics.org/blog/index.php?pk=60917&T=1

Globally Unique Identifier (entire table): ba.freestatistics.org/blog/index.php?pk=60917&T=1

As an alternative you can also use a QR Code:  

The GUIDs for individual cells are displayed in the table below:

Autocorrelation Function
Time lag kACF(k)T-STATP-value
10.8735415.24124e-06
20.7110534.26636.9e-05
30.5326333.19580.00145
40.3334982.0010.026489
50.1240130.74410.230829
6-0.082498-0.4950.311809
7-0.266613-1.59970.059205
8-0.375998-2.2560.015121
9-0.436521-2.61910.00641
10-0.503204-3.01920.002319
11-0.523216-3.13930.001687
12-0.468944-2.81370.003944
13-0.375953-2.25570.01513
14-0.298637-1.79180.040785
15-0.2384-1.43040.080613
16-0.209422-1.25650.108508
17-0.136998-0.8220.208248
18-0.060518-0.36310.359323
190.0026680.0160.493658
200.0615220.36910.357096
210.1399040.83940.203386
220.1798631.07920.143843
230.2018981.21140.116819
240.1811371.08680.14217
250.1336160.80170.213995
260.1136660.6820.249803
270.0920530.55230.292072
280.0422850.25370.400582
290.0107390.06440.47449
30-0.02438-0.14630.442259
31-0.049762-0.29860.383492
32-0.054891-0.32930.371902
33-0.053097-0.31860.375943
34-0.043635-0.26180.39748
35-0.031404-0.18840.425802
36NANANA


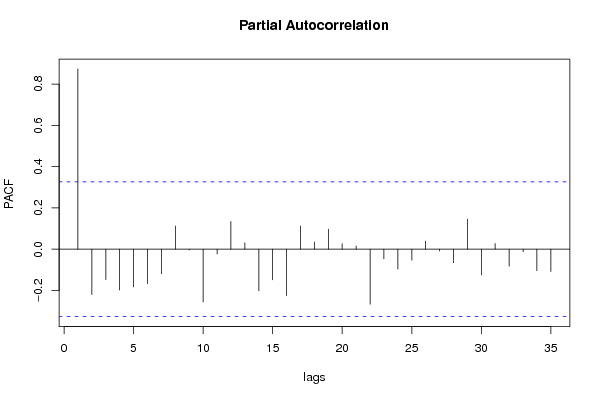
Partial Autocorrelation Function
Time lag kPACF(k)T-STATP-value
10.8735415.24124e-06
2-0.219569-1.31740.098011
3-0.146694-0.88020.192305
4-0.197769-1.18660.121576
5-0.182531-1.09520.140355
6-0.16759-1.00550.160674
7-0.118257-0.70950.24128
80.1124170.67450.252151
9-0.003251-0.01950.492272
10-0.255202-1.53120.067229
11-0.022527-0.13520.446618
120.1339750.80380.21338
130.0310250.18620.426685
14-0.201409-1.20850.117376
15-0.148063-0.88840.190117
16-0.224332-1.3460.09336
170.111970.67180.252993
180.0351210.21070.417144
190.0973670.58420.281364
200.026910.16150.436317
210.0159130.09550.462232
22-0.266219-1.59730.059469
23-0.046379-0.27830.391198
24-0.096009-0.57610.284082
25-0.052945-0.31770.376286
260.0393770.23630.407284
27-0.008387-0.05030.480072
28-0.065194-0.39120.348992
290.1454030.87240.194381
30-0.124733-0.74840.229541
310.0276040.16560.434689
32-0.082151-0.49290.312536
33-0.01181-0.07090.471952
34-0.103766-0.62260.268738
35-0.108081-0.64850.260394
36NANANA

\begin{tabular}{lllllllll}
\hline
Partial Autocorrelation Function \tabularnewline
Time lag k & PACF(k) & T-STAT & P-value \tabularnewline
1 & 0.873541 & 5.2412 & 4e-06 \tabularnewline
2 & -0.219569 & -1.3174 & 0.098011 \tabularnewline
3 & -0.146694 & -0.8802 & 0.192305 \tabularnewline
4 & -0.197769 & -1.1866 & 0.121576 \tabularnewline
5 & -0.182531 & -1.0952 & 0.140355 \tabularnewline
6 & -0.16759 & -1.0055 & 0.160674 \tabularnewline
7 & -0.118257 & -0.7095 & 0.24128 \tabularnewline
8 & 0.112417 & 0.6745 & 0.252151 \tabularnewline
9 & -0.003251 & -0.0195 & 0.492272 \tabularnewline
10 & -0.255202 & -1.5312 & 0.067229 \tabularnewline
11 & -0.022527 & -0.1352 & 0.446618 \tabularnewline
12 & 0.133975 & 0.8038 & 0.21338 \tabularnewline
13 & 0.031025 & 0.1862 & 0.426685 \tabularnewline
14 & -0.201409 & -1.2085 & 0.117376 \tabularnewline
15 & -0.148063 & -0.8884 & 0.190117 \tabularnewline
16 & -0.224332 & -1.346 & 0.09336 \tabularnewline
17 & 0.11197 & 0.6718 & 0.252993 \tabularnewline
18 & 0.035121 & 0.2107 & 0.417144 \tabularnewline
19 & 0.097367 & 0.5842 & 0.281364 \tabularnewline
20 & 0.02691 & 0.1615 & 0.436317 \tabularnewline
21 & 0.015913 & 0.0955 & 0.462232 \tabularnewline
22 & -0.266219 & -1.5973 & 0.059469 \tabularnewline
23 & -0.046379 & -0.2783 & 0.391198 \tabularnewline
24 & -0.096009 & -0.5761 & 0.284082 \tabularnewline
25 & -0.052945 & -0.3177 & 0.376286 \tabularnewline
26 & 0.039377 & 0.2363 & 0.407284 \tabularnewline
27 & -0.008387 & -0.0503 & 0.480072 \tabularnewline
28 & -0.065194 & -0.3912 & 0.348992 \tabularnewline
29 & 0.145403 & 0.8724 & 0.194381 \tabularnewline
30 & -0.124733 & -0.7484 & 0.229541 \tabularnewline
31 & 0.027604 & 0.1656 & 0.434689 \tabularnewline
32 & -0.082151 & -0.4929 & 0.312536 \tabularnewline
33 & -0.01181 & -0.0709 & 0.471952 \tabularnewline
34 & -0.103766 & -0.6226 & 0.268738 \tabularnewline
35 & -0.108081 & -0.6485 & 0.260394 \tabularnewline
36 & NA & NA & NA \tabularnewline
\hline
\end{tabular}
%Source: https://freestatistics.org/blog/index.php?pk=60917&T=2

[TABLE]
[ROW][C]Partial Autocorrelation Function[/C][/ROW]
[ROW][C]Time lag k[/C][C]PACF(k)[/C][C]T-STAT[/C][C]P-value[/C][/ROW]
[ROW][C]1[/C][C]0.873541[/C][C]5.2412[/C][C]4e-06[/C][/ROW]
[ROW][C]2[/C][C]-0.219569[/C][C]-1.3174[/C][C]0.098011[/C][/ROW]
[ROW][C]3[/C][C]-0.146694[/C][C]-0.8802[/C][C]0.192305[/C][/ROW]
[ROW][C]4[/C][C]-0.197769[/C][C]-1.1866[/C][C]0.121576[/C][/ROW]
[ROW][C]5[/C][C]-0.182531[/C][C]-1.0952[/C][C]0.140355[/C][/ROW]
[ROW][C]6[/C][C]-0.16759[/C][C]-1.0055[/C][C]0.160674[/C][/ROW]
[ROW][C]7[/C][C]-0.118257[/C][C]-0.7095[/C][C]0.24128[/C][/ROW]
[ROW][C]8[/C][C]0.112417[/C][C]0.6745[/C][C]0.252151[/C][/ROW]
[ROW][C]9[/C][C]-0.003251[/C][C]-0.0195[/C][C]0.492272[/C][/ROW]
[ROW][C]10[/C][C]-0.255202[/C][C]-1.5312[/C][C]0.067229[/C][/ROW]
[ROW][C]11[/C][C]-0.022527[/C][C]-0.1352[/C][C]0.446618[/C][/ROW]
[ROW][C]12[/C][C]0.133975[/C][C]0.8038[/C][C]0.21338[/C][/ROW]
[ROW][C]13[/C][C]0.031025[/C][C]0.1862[/C][C]0.426685[/C][/ROW]
[ROW][C]14[/C][C]-0.201409[/C][C]-1.2085[/C][C]0.117376[/C][/ROW]
[ROW][C]15[/C][C]-0.148063[/C][C]-0.8884[/C][C]0.190117[/C][/ROW]
[ROW][C]16[/C][C]-0.224332[/C][C]-1.346[/C][C]0.09336[/C][/ROW]
[ROW][C]17[/C][C]0.11197[/C][C]0.6718[/C][C]0.252993[/C][/ROW]
[ROW][C]18[/C][C]0.035121[/C][C]0.2107[/C][C]0.417144[/C][/ROW]
[ROW][C]19[/C][C]0.097367[/C][C]0.5842[/C][C]0.281364[/C][/ROW]
[ROW][C]20[/C][C]0.02691[/C][C]0.1615[/C][C]0.436317[/C][/ROW]
[ROW][C]21[/C][C]0.015913[/C][C]0.0955[/C][C]0.462232[/C][/ROW]
[ROW][C]22[/C][C]-0.266219[/C][C]-1.5973[/C][C]0.059469[/C][/ROW]
[ROW][C]23[/C][C]-0.046379[/C][C]-0.2783[/C][C]0.391198[/C][/ROW]
[ROW][C]24[/C][C]-0.096009[/C][C]-0.5761[/C][C]0.284082[/C][/ROW]
[ROW][C]25[/C][C]-0.052945[/C][C]-0.3177[/C][C]0.376286[/C][/ROW]
[ROW][C]26[/C][C]0.039377[/C][C]0.2363[/C][C]0.407284[/C][/ROW]
[ROW][C]27[/C][C]-0.008387[/C][C]-0.0503[/C][C]0.480072[/C][/ROW]
[ROW][C]28[/C][C]-0.065194[/C][C]-0.3912[/C][C]0.348992[/C][/ROW]
[ROW][C]29[/C][C]0.145403[/C][C]0.8724[/C][C]0.194381[/C][/ROW]
[ROW][C]30[/C][C]-0.124733[/C][C]-0.7484[/C][C]0.229541[/C][/ROW]
[ROW][C]31[/C][C]0.027604[/C][C]0.1656[/C][C]0.434689[/C][/ROW]
[ROW][C]32[/C][C]-0.082151[/C][C]-0.4929[/C][C]0.312536[/C][/ROW]
[ROW][C]33[/C][C]-0.01181[/C][C]-0.0709[/C][C]0.471952[/C][/ROW]
[ROW][C]34[/C][C]-0.103766[/C][C]-0.6226[/C][C]0.268738[/C][/ROW]
[ROW][C]35[/C][C]-0.108081[/C][C]-0.6485[/C][C]0.260394[/C][/ROW]
[ROW][C]36[/C][C]NA[/C][C]NA[/C][C]NA[/C][/ROW]
[/TABLE]
Source: https://freestatistics.org/blog/index.php?pk=60917&T=2

Globally Unique Identifier (entire table): ba.freestatistics.org/blog/index.php?pk=60917&T=2

As an alternative you can also use a QR Code:  

The GUIDs for individual cells are displayed in the table below:

Partial Autocorrelation Function
Time lag kPACF(k)T-STATP-value
10.8735415.24124e-06
2-0.219569-1.31740.098011
3-0.146694-0.88020.192305
4-0.197769-1.18660.121576
5-0.182531-1.09520.140355
6-0.16759-1.00550.160674
7-0.118257-0.70950.24128
80.1124170.67450.252151
9-0.003251-0.01950.492272
10-0.255202-1.53120.067229
11-0.022527-0.13520.446618
120.1339750.80380.21338
130.0310250.18620.426685
14-0.201409-1.20850.117376
15-0.148063-0.88840.190117
16-0.224332-1.3460.09336
170.111970.67180.252993
180.0351210.21070.417144
190.0973670.58420.281364
200.026910.16150.436317
210.0159130.09550.462232
22-0.266219-1.59730.059469
23-0.046379-0.27830.391198
24-0.096009-0.57610.284082
25-0.052945-0.31770.376286
260.0393770.23630.407284
27-0.008387-0.05030.480072
28-0.065194-0.39120.348992
290.1454030.87240.194381
30-0.124733-0.74840.229541
310.0276040.16560.434689
32-0.082151-0.49290.312536
33-0.01181-0.07090.471952
34-0.103766-0.62260.268738
35-0.108081-0.64850.260394
36NANANA


Parameters (Session):
par1 = 36 ; par2 = 1 ; par3 = 0 ; par4 = 0 ; par5 = 12 ; par6 = MA ; par7 = 0.95 ;
Parameters (R input):
par1 = 36 ; par2 = 1 ; par3 = 0 ; par4 = 0 ; par5 = 12 ; par6 = MA ; par7 = 0.95 ;
R code (references can be found in the software module):
if (par1 == 'Default') {
par1 = 10*log10(length(x))
} else {
par1 <- as.numeric(par1)
}
par2 <- as.numeric(par2)
par3 <- as.numeric(par3)
par4 <- as.numeric(par4)
par5 <- as.numeric(par5)
if (par6 == 'White Noise') par6 <- 'white' else par6 <- 'ma'
par7 <- as.numeric(par7)
if (par2 == 0) {
x <- log(x)
} else {
x <- (x ^ par2 - 1) / par2
}
if (par3 > 0) x <- diff(x,lag=1,difference=par3)
if (par4 > 0) x <- diff(x,lag=par5,difference=par4)
bitmap(file='pic1.png')
racf <- acf(x, par1, main='Autocorrelation', xlab='time lag', ylab='ACF', ci.type=par6, ci=par7, sub=paste('(lambda=',par2,', d=',par3,', D=',par4,', CI=', par7, ', CI type=',par6,')',sep=''))
dev.off()
bitmap(file='pic2.png')
rpacf <- pacf(x,par1,main='Partial Autocorrelation',xlab='lags',ylab='PACF')
dev.off()
(myacf <- c(racf$acf))
(mypacf <- c(rpacf$acf))
lengthx <- length(x)
sqrtn <- sqrt(lengthx)
load(file='createtable')
a<-table.start()
a<-table.row.start(a)
a<-table.element(a,'Autocorrelation Function',4,TRUE)
a<-table.row.end(a)
a<-table.row.start(a)
a<-table.element(a,'Time lag k',header=TRUE)
a<-table.element(a,hyperlink('basics.htm','ACF(k)','click here for more information about the Autocorrelation Function'),header=TRUE)
a<-table.element(a,'T-STAT',header=TRUE)
a<-table.element(a,'P-value',header=TRUE)
a<-table.row.end(a)
for (i in 2:(par1+1)) {
a<-table.row.start(a)
a<-table.element(a,i-1,header=TRUE)
a<-table.element(a,round(myacf[i],6))
mytstat <- myacf[i]*sqrtn
a<-table.element(a,round(mytstat,4))
a<-table.element(a,round(1-pt(abs(mytstat),lengthx),6))
a<-table.row.end(a)
}
a<-table.end(a)
table.save(a,file='mytable.tab')
a<-table.start()
a<-table.row.start(a)
a<-table.element(a,'Partial Autocorrelation Function',4,TRUE)
a<-table.row.end(a)
a<-table.row.start(a)
a<-table.element(a,'Time lag k',header=TRUE)
a<-table.element(a,hyperlink('basics.htm','PACF(k)','click here for more information about the Partial Autocorrelation Function'),header=TRUE)
a<-table.element(a,'T-STAT',header=TRUE)
a<-table.element(a,'P-value',header=TRUE)
a<-table.row.end(a)
for (i in 1:par1) {
a<-table.row.start(a)
a<-table.element(a,i,header=TRUE)
a<-table.element(a,round(mypacf[i],6))
mytstat <- mypacf[i]*sqrtn
a<-table.element(a,round(mytstat,4))
a<-table.element(a,round(1-pt(abs(mytstat),lengthx),6))
a<-table.row.end(a)
}
a<-table.end(a)
table.save(a,file='mytable1.tab')