Free Statistics

of Irreproducible Research!

Author's title

Author*The author of this computation has been verified*
R Software Modulerwasp_autocorrelation.wasp
Title produced by software(Partial) Autocorrelation Function
Date of computationFri, 27 Nov 2009 11:04:26 -0700
Cite this page as followsStatistical Computations at FreeStatistics.org, Office for Research Development and Education, URL https://freestatistics.org/blog/index.php?v=date/2009/Nov/27/t1259345122bxoewrdfh1fm1vm.htm/, Retrieved Mon, 29 Apr 2024 04:49:29 +0000
Statistical Computations at FreeStatistics.org, Office for Research Development and Education, URL https://freestatistics.org/blog/index.php?pk=61067, Retrieved Mon, 29 Apr 2024 04:49:29 +0000
QR Codes:

Original text written by user:
IsPrivate?No (this computation is public)
User-defined keywords
Estimated Impact106
Family? (F = Feedback message, R = changed R code, M = changed R Module, P = changed Parameters, D = changed Data)
-     [Univariate Explorative Data Analysis] [Run Sequence gebo...] [2008-12-12 13:32:37] [76963dc1903f0f612b6153510a3818cf]
- R  D  [Univariate Explorative Data Analysis] [Run Sequence gebo...] [2008-12-17 12:14:40] [76963dc1903f0f612b6153510a3818cf]
-         [Univariate Explorative Data Analysis] [Run Sequence Plot...] [2008-12-22 18:19:51] [1ce0d16c8f4225c977b42c8fa93bc163]
- RMP       [(Partial) Autocorrelation Function] [Identifying Integ...] [2009-11-22 12:16:10] [b98453cac15ba1066b407e146608df68]
-   PD        [(Partial) Autocorrelation Function] [ws8 methode 1] [2009-11-27 17:51:30] [74be16979710d4c4e7c6647856088456]
F   P             [(Partial) Autocorrelation Function] [ws8 methode 1 2] [2009-11-27 18:04:26] [d41d8cd98f00b204e9800998ecf8427e] [Current]
Feedback Forum
2009-12-05 15:49:08 [f1e24346ff4ab8a20729561498ad5c34] [reply
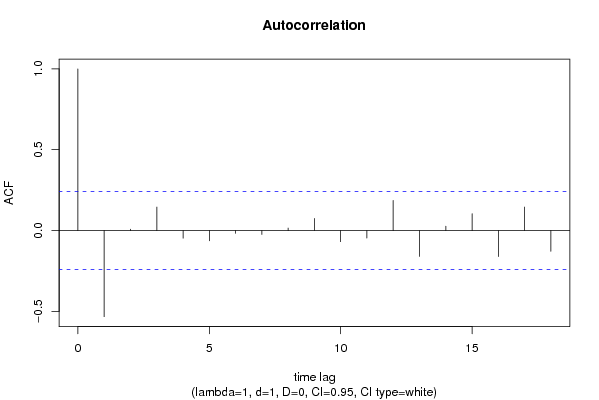
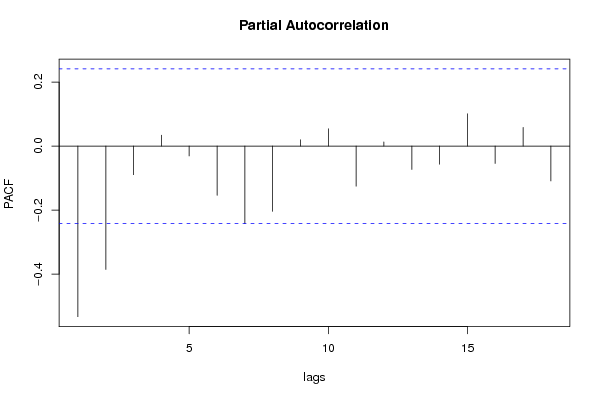
Het beste model voor jouw reeks is dus: ∇ Y[t]= e[t]

Post a new message
Dataseries X:
2360
2214
2825
2355
2333
3016
2155
2172
2150
2533
2058
2160
2260
2498
2695
2799
2947
2930
2318
2540
2570
2669
2450
2842
3440
2678
2981
2260
2844
2546
2456
2295
2379
2479
2057
2280
2351
2276
2548
2311
2201
2725
2408
2139
1898
2537
2069
2063
2524
2437
2189
2793
2074
2622
2278
2144
2427
2139
1828
2072
1800
1758
2246
1987
1868
2514
2121


Summary of computational transaction
Raw Inputview raw input (R code)
Raw Outputview raw output of R engine
Computing time0 seconds
R Server'Gwilym Jenkins' @ 72.249.127.135

\begin{tabular}{lllllllll}
\hline
Summary of computational transaction \tabularnewline
Raw Input & view raw input (R code)  \tabularnewline
Raw Output & view raw output of R engine  \tabularnewline
Computing time & 0 seconds \tabularnewline
R Server & 'Gwilym Jenkins' @ 72.249.127.135 \tabularnewline
\hline
\end{tabular}
%Source: https://freestatistics.org/blog/index.php?pk=61067&T=0

[TABLE]
[ROW][C]Summary of computational transaction[/C][/ROW]
[ROW][C]Raw Input[/C][C]view raw input (R code) [/C][/ROW]
[ROW][C]Raw Output[/C][C]view raw output of R engine [/C][/ROW]
[ROW][C]Computing time[/C][C]0 seconds[/C][/ROW]
[ROW][C]R Server[/C][C]'Gwilym Jenkins' @ 72.249.127.135[/C][/ROW]
[/TABLE]
Source: https://freestatistics.org/blog/index.php?pk=61067&T=0

Globally Unique Identifier (entire table): ba.freestatistics.org/blog/index.php?pk=61067&T=0

As an alternative you can also use a QR Code:  

The GUIDs for individual cells are displayed in the table below:

Summary of computational transaction
Raw Inputview raw input (R code)
Raw Outputview raw output of R engine
Computing time0 seconds
R Server'Gwilym Jenkins' @ 72.249.127.135


Autocorrelation Function
Time lag kACF(k)T-STATP-value
1-0.533196-4.33172.6e-05
20.0084220.06840.472829
30.1449221.17740.121641
4-0.047619-0.38690.350051
5-0.063677-0.51730.303334
6-0.017728-0.1440.442962
7-0.02459-0.19980.421137
80.0150240.12210.451614
90.0745830.60590.273325
10-0.069548-0.5650.286991
11-0.046818-0.38030.352454
120.1861041.51190.067664
13-0.160624-1.30490.098227
140.0265280.21550.415014
150.1044070.84820.199693
16-0.16107-1.30850.097615
170.1450911.17870.12137
18-0.128848-1.04680.149513

\begin{tabular}{lllllllll}
\hline
Autocorrelation Function \tabularnewline
Time lag k & ACF(k) & T-STAT & P-value \tabularnewline
1 & -0.533196 & -4.3317 & 2.6e-05 \tabularnewline
2 & 0.008422 & 0.0684 & 0.472829 \tabularnewline
3 & 0.144922 & 1.1774 & 0.121641 \tabularnewline
4 & -0.047619 & -0.3869 & 0.350051 \tabularnewline
5 & -0.063677 & -0.5173 & 0.303334 \tabularnewline
6 & -0.017728 & -0.144 & 0.442962 \tabularnewline
7 & -0.02459 & -0.1998 & 0.421137 \tabularnewline
8 & 0.015024 & 0.1221 & 0.451614 \tabularnewline
9 & 0.074583 & 0.6059 & 0.273325 \tabularnewline
10 & -0.069548 & -0.565 & 0.286991 \tabularnewline
11 & -0.046818 & -0.3803 & 0.352454 \tabularnewline
12 & 0.186104 & 1.5119 & 0.067664 \tabularnewline
13 & -0.160624 & -1.3049 & 0.098227 \tabularnewline
14 & 0.026528 & 0.2155 & 0.415014 \tabularnewline
15 & 0.104407 & 0.8482 & 0.199693 \tabularnewline
16 & -0.16107 & -1.3085 & 0.097615 \tabularnewline
17 & 0.145091 & 1.1787 & 0.12137 \tabularnewline
18 & -0.128848 & -1.0468 & 0.149513 \tabularnewline
\hline
\end{tabular}
%Source: https://freestatistics.org/blog/index.php?pk=61067&T=1

[TABLE]
[ROW][C]Autocorrelation Function[/C][/ROW]
[ROW][C]Time lag k[/C][C]ACF(k)[/C][C]T-STAT[/C][C]P-value[/C][/ROW]
[ROW][C]1[/C][C]-0.533196[/C][C]-4.3317[/C][C]2.6e-05[/C][/ROW]
[ROW][C]2[/C][C]0.008422[/C][C]0.0684[/C][C]0.472829[/C][/ROW]
[ROW][C]3[/C][C]0.144922[/C][C]1.1774[/C][C]0.121641[/C][/ROW]
[ROW][C]4[/C][C]-0.047619[/C][C]-0.3869[/C][C]0.350051[/C][/ROW]
[ROW][C]5[/C][C]-0.063677[/C][C]-0.5173[/C][C]0.303334[/C][/ROW]
[ROW][C]6[/C][C]-0.017728[/C][C]-0.144[/C][C]0.442962[/C][/ROW]
[ROW][C]7[/C][C]-0.02459[/C][C]-0.1998[/C][C]0.421137[/C][/ROW]
[ROW][C]8[/C][C]0.015024[/C][C]0.1221[/C][C]0.451614[/C][/ROW]
[ROW][C]9[/C][C]0.074583[/C][C]0.6059[/C][C]0.273325[/C][/ROW]
[ROW][C]10[/C][C]-0.069548[/C][C]-0.565[/C][C]0.286991[/C][/ROW]
[ROW][C]11[/C][C]-0.046818[/C][C]-0.3803[/C][C]0.352454[/C][/ROW]
[ROW][C]12[/C][C]0.186104[/C][C]1.5119[/C][C]0.067664[/C][/ROW]
[ROW][C]13[/C][C]-0.160624[/C][C]-1.3049[/C][C]0.098227[/C][/ROW]
[ROW][C]14[/C][C]0.026528[/C][C]0.2155[/C][C]0.415014[/C][/ROW]
[ROW][C]15[/C][C]0.104407[/C][C]0.8482[/C][C]0.199693[/C][/ROW]
[ROW][C]16[/C][C]-0.16107[/C][C]-1.3085[/C][C]0.097615[/C][/ROW]
[ROW][C]17[/C][C]0.145091[/C][C]1.1787[/C][C]0.12137[/C][/ROW]
[ROW][C]18[/C][C]-0.128848[/C][C]-1.0468[/C][C]0.149513[/C][/ROW]
[/TABLE]
Source: https://freestatistics.org/blog/index.php?pk=61067&T=1

Globally Unique Identifier (entire table): ba.freestatistics.org/blog/index.php?pk=61067&T=1

As an alternative you can also use a QR Code:  

The GUIDs for individual cells are displayed in the table below:

Autocorrelation Function
Time lag kACF(k)T-STATP-value
1-0.533196-4.33172.6e-05
20.0084220.06840.472829
30.1449221.17740.121641
4-0.047619-0.38690.350051
5-0.063677-0.51730.303334
6-0.017728-0.1440.442962
7-0.02459-0.19980.421137
80.0150240.12210.451614
90.0745830.60590.273325
10-0.069548-0.5650.286991
11-0.046818-0.38030.352454
120.1861041.51190.067664
13-0.160624-1.30490.098227
140.0265280.21550.415014
150.1044070.84820.199693
16-0.16107-1.30850.097615
170.1450911.17870.12137
18-0.128848-1.04680.149513


Partial Autocorrelation Function
Time lag kPACF(k)T-STATP-value
1-0.533196-4.33172.6e-05
2-0.385462-3.13150.001296
3-0.089246-0.7250.235496
40.0341420.27740.39118
5-0.030524-0.2480.402461
6-0.153964-1.25080.10771
7-0.242605-1.97090.026464
8-0.20395-1.65690.051144
90.0198070.16090.436328
100.0542270.44050.330492
11-0.125439-1.01910.155945
120.0131020.10640.457776
13-0.073028-0.59330.277509
14-0.056588-0.45970.323612
150.1011390.82170.207115
16-0.054131-0.43980.330774
170.058210.47290.318923
18-0.108909-0.88480.189743

\begin{tabular}{lllllllll}
\hline
Partial Autocorrelation Function \tabularnewline
Time lag k & PACF(k) & T-STAT & P-value \tabularnewline
1 & -0.533196 & -4.3317 & 2.6e-05 \tabularnewline
2 & -0.385462 & -3.1315 & 0.001296 \tabularnewline
3 & -0.089246 & -0.725 & 0.235496 \tabularnewline
4 & 0.034142 & 0.2774 & 0.39118 \tabularnewline
5 & -0.030524 & -0.248 & 0.402461 \tabularnewline
6 & -0.153964 & -1.2508 & 0.10771 \tabularnewline
7 & -0.242605 & -1.9709 & 0.026464 \tabularnewline
8 & -0.20395 & -1.6569 & 0.051144 \tabularnewline
9 & 0.019807 & 0.1609 & 0.436328 \tabularnewline
10 & 0.054227 & 0.4405 & 0.330492 \tabularnewline
11 & -0.125439 & -1.0191 & 0.155945 \tabularnewline
12 & 0.013102 & 0.1064 & 0.457776 \tabularnewline
13 & -0.073028 & -0.5933 & 0.277509 \tabularnewline
14 & -0.056588 & -0.4597 & 0.323612 \tabularnewline
15 & 0.101139 & 0.8217 & 0.207115 \tabularnewline
16 & -0.054131 & -0.4398 & 0.330774 \tabularnewline
17 & 0.05821 & 0.4729 & 0.318923 \tabularnewline
18 & -0.108909 & -0.8848 & 0.189743 \tabularnewline
\hline
\end{tabular}
%Source: https://freestatistics.org/blog/index.php?pk=61067&T=2

[TABLE]
[ROW][C]Partial Autocorrelation Function[/C][/ROW]
[ROW][C]Time lag k[/C][C]PACF(k)[/C][C]T-STAT[/C][C]P-value[/C][/ROW]
[ROW][C]1[/C][C]-0.533196[/C][C]-4.3317[/C][C]2.6e-05[/C][/ROW]
[ROW][C]2[/C][C]-0.385462[/C][C]-3.1315[/C][C]0.001296[/C][/ROW]
[ROW][C]3[/C][C]-0.089246[/C][C]-0.725[/C][C]0.235496[/C][/ROW]
[ROW][C]4[/C][C]0.034142[/C][C]0.2774[/C][C]0.39118[/C][/ROW]
[ROW][C]5[/C][C]-0.030524[/C][C]-0.248[/C][C]0.402461[/C][/ROW]
[ROW][C]6[/C][C]-0.153964[/C][C]-1.2508[/C][C]0.10771[/C][/ROW]
[ROW][C]7[/C][C]-0.242605[/C][C]-1.9709[/C][C]0.026464[/C][/ROW]
[ROW][C]8[/C][C]-0.20395[/C][C]-1.6569[/C][C]0.051144[/C][/ROW]
[ROW][C]9[/C][C]0.019807[/C][C]0.1609[/C][C]0.436328[/C][/ROW]
[ROW][C]10[/C][C]0.054227[/C][C]0.4405[/C][C]0.330492[/C][/ROW]
[ROW][C]11[/C][C]-0.125439[/C][C]-1.0191[/C][C]0.155945[/C][/ROW]
[ROW][C]12[/C][C]0.013102[/C][C]0.1064[/C][C]0.457776[/C][/ROW]
[ROW][C]13[/C][C]-0.073028[/C][C]-0.5933[/C][C]0.277509[/C][/ROW]
[ROW][C]14[/C][C]-0.056588[/C][C]-0.4597[/C][C]0.323612[/C][/ROW]
[ROW][C]15[/C][C]0.101139[/C][C]0.8217[/C][C]0.207115[/C][/ROW]
[ROW][C]16[/C][C]-0.054131[/C][C]-0.4398[/C][C]0.330774[/C][/ROW]
[ROW][C]17[/C][C]0.05821[/C][C]0.4729[/C][C]0.318923[/C][/ROW]
[ROW][C]18[/C][C]-0.108909[/C][C]-0.8848[/C][C]0.189743[/C][/ROW]
[/TABLE]
Source: https://freestatistics.org/blog/index.php?pk=61067&T=2

Globally Unique Identifier (entire table): ba.freestatistics.org/blog/index.php?pk=61067&T=2

As an alternative you can also use a QR Code:  

The GUIDs for individual cells are displayed in the table below:

Partial Autocorrelation Function
Time lag kPACF(k)T-STATP-value
1-0.533196-4.33172.6e-05
2-0.385462-3.13150.001296
3-0.089246-0.7250.235496
40.0341420.27740.39118
5-0.030524-0.2480.402461
6-0.153964-1.25080.10771
7-0.242605-1.97090.026464
8-0.20395-1.65690.051144
90.0198070.16090.436328
100.0542270.44050.330492
11-0.125439-1.01910.155945
120.0131020.10640.457776
13-0.073028-0.59330.277509
14-0.056588-0.45970.323612
150.1011390.82170.207115
16-0.054131-0.43980.330774
170.058210.47290.318923
18-0.108909-0.88480.189743


Parameters (Session):
par1 = Default ; par2 = 1 ; par3 = 1 ; par4 = 0 ; par5 = 12 ; par6 = White Noise ; par7 = 0.95 ;
Parameters (R input):
par1 = Default ; par2 = 1 ; par3 = 1 ; par4 = 0 ; par5 = 12 ; par6 = White Noise ; par7 = 0.95 ;
R code (references can be found in the software module):
if (par1 == 'Default') {
par1 = 10*log10(length(x))
} else {
par1 <- as.numeric(par1)
}
par2 <- as.numeric(par2)
par3 <- as.numeric(par3)
par4 <- as.numeric(par4)
par5 <- as.numeric(par5)
if (par6 == 'White Noise') par6 <- 'white' else par6 <- 'ma'
par7 <- as.numeric(par7)
if (par2 == 0) {
x <- log(x)
} else {
x <- (x ^ par2 - 1) / par2
}
if (par3 > 0) x <- diff(x,lag=1,difference=par3)
if (par4 > 0) x <- diff(x,lag=par5,difference=par4)
bitmap(file='pic1.png')
racf <- acf(x, par1, main='Autocorrelation', xlab='time lag', ylab='ACF', ci.type=par6, ci=par7, sub=paste('(lambda=',par2,', d=',par3,', D=',par4,', CI=', par7, ', CI type=',par6,')',sep=''))
dev.off()
bitmap(file='pic2.png')
rpacf <- pacf(x,par1,main='Partial Autocorrelation',xlab='lags',ylab='PACF')
dev.off()
(myacf <- c(racf$acf))
(mypacf <- c(rpacf$acf))
lengthx <- length(x)
sqrtn <- sqrt(lengthx)
load(file='createtable')
a<-table.start()
a<-table.row.start(a)
a<-table.element(a,'Autocorrelation Function',4,TRUE)
a<-table.row.end(a)
a<-table.row.start(a)
a<-table.element(a,'Time lag k',header=TRUE)
a<-table.element(a,hyperlink('basics.htm','ACF(k)','click here for more information about the Autocorrelation Function'),header=TRUE)
a<-table.element(a,'T-STAT',header=TRUE)
a<-table.element(a,'P-value',header=TRUE)
a<-table.row.end(a)
for (i in 2:(par1+1)) {
a<-table.row.start(a)
a<-table.element(a,i-1,header=TRUE)
a<-table.element(a,round(myacf[i],6))
mytstat <- myacf[i]*sqrtn
a<-table.element(a,round(mytstat,4))
a<-table.element(a,round(1-pt(abs(mytstat),lengthx),6))
a<-table.row.end(a)
}
a<-table.end(a)
table.save(a,file='mytable.tab')
a<-table.start()
a<-table.row.start(a)
a<-table.element(a,'Partial Autocorrelation Function',4,TRUE)
a<-table.row.end(a)
a<-table.row.start(a)
a<-table.element(a,'Time lag k',header=TRUE)
a<-table.element(a,hyperlink('basics.htm','PACF(k)','click here for more information about the Partial Autocorrelation Function'),header=TRUE)
a<-table.element(a,'T-STAT',header=TRUE)
a<-table.element(a,'P-value',header=TRUE)
a<-table.row.end(a)
for (i in 1:par1) {
a<-table.row.start(a)
a<-table.element(a,i,header=TRUE)
a<-table.element(a,round(mypacf[i],6))
mytstat <- mypacf[i]*sqrtn
a<-table.element(a,round(mytstat,4))
a<-table.element(a,round(1-pt(abs(mytstat),lengthx),6))
a<-table.row.end(a)
}
a<-table.end(a)
table.save(a,file='mytable1.tab')