Free Statistics

of Irreproducible Research!

Author's title

Author*The author of this computation has been verified*
R Software Modulerwasp_autocorrelation.wasp
Title produced by software(Partial) Autocorrelation Function
Date of computationFri, 27 Nov 2009 11:38:28 -0700
Cite this page as followsStatistical Computations at FreeStatistics.org, Office for Research Development and Education, URL https://freestatistics.org/blog/index.php?v=date/2009/Nov/27/t12593472267rxy5mk84y0cyir.htm/, Retrieved Mon, 29 Apr 2024 02:08:06 +0000
Statistical Computations at FreeStatistics.org, Office for Research Development and Education, URL https://freestatistics.org/blog/index.php?pk=61096, Retrieved Mon, 29 Apr 2024 02:08:06 +0000
QR Codes:

Original text written by user:
IsPrivate?No (this computation is public)
User-defined keywordsKVN WS8
Estimated Impact133
Family? (F = Feedback message, R = changed R code, M = changed R Module, P = changed Parameters, D = changed Data)
-     [Univariate Explorative Data Analysis] [Run Sequence gebo...] [2008-12-12 13:32:37] [76963dc1903f0f612b6153510a3818cf]
- R  D  [Univariate Explorative Data Analysis] [Run Sequence gebo...] [2008-12-17 12:14:40] [76963dc1903f0f612b6153510a3818cf]
-         [Univariate Explorative Data Analysis] [Run Sequence Plot...] [2008-12-22 18:19:51] [1ce0d16c8f4225c977b42c8fa93bc163]
- RMP       [(Partial) Autocorrelation Function] [Identifying Integ...] [2009-11-22 12:16:10] [b98453cac15ba1066b407e146608df68]
-    D          [(Partial) Autocorrelation Function] [ACF Autocorrelati...] [2009-11-27 18:38:28] [f1100e00818182135823a11ccbd0f3b9] [Current]
Feedback Forum

Post a new message
Dataseries X:
9487
8700
9627
8947
9283
8829
9947
9628
9318
9605
8640
9214
9567
8547
9185
9470
9123
9278
10170
9434
9655
9429
8739
9552
9687
9019
9672
9206
9069
9788
10312
10105
9863
9656
9295
9946
9701
9049
10190
9706
9765
9893
9994
10433
10073
10112
9266
9820
10097
9115
10411
9678
10408
10153
10368
10581
10597
10680
9738
9556


Summary of computational transaction
Raw Inputview raw input (R code)
Raw Outputview raw output of R engine
Computing time2 seconds
R Server'Gwilym Jenkins' @ 72.249.127.135

\begin{tabular}{lllllllll}
\hline
Summary of computational transaction \tabularnewline
Raw Input & view raw input (R code)  \tabularnewline
Raw Output & view raw output of R engine  \tabularnewline
Computing time & 2 seconds \tabularnewline
R Server & 'Gwilym Jenkins' @ 72.249.127.135 \tabularnewline
\hline
\end{tabular}
%Source: https://freestatistics.org/blog/index.php?pk=61096&T=0

[TABLE]
[ROW][C]Summary of computational transaction[/C][/ROW]
[ROW][C]Raw Input[/C][C]view raw input (R code) [/C][/ROW]
[ROW][C]Raw Output[/C][C]view raw output of R engine [/C][/ROW]
[ROW][C]Computing time[/C][C]2 seconds[/C][/ROW]
[ROW][C]R Server[/C][C]'Gwilym Jenkins' @ 72.249.127.135[/C][/ROW]
[/TABLE]
Source: https://freestatistics.org/blog/index.php?pk=61096&T=0

Globally Unique Identifier (entire table): ba.freestatistics.org/blog/index.php?pk=61096&T=0

As an alternative you can also use a QR Code:  

The GUIDs for individual cells are displayed in the table below:

Summary of computational transaction
Raw Inputview raw input (R code)
Raw Outputview raw output of R engine
Computing time2 seconds
R Server'Gwilym Jenkins' @ 72.249.127.135


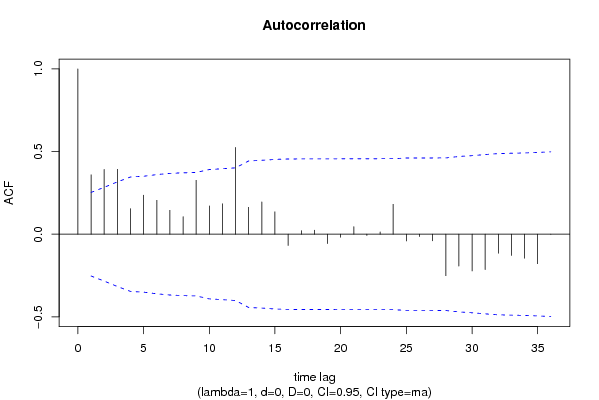
Autocorrelation Function
Time lag kACF(k)T-STATP-value
10.3590762.78140.003611
20.3917783.03470.001778
30.3926993.04180.001742
40.1542241.19460.11847
50.2363381.83070.036059
60.2047821.58620.058972
70.144411.11860.133886
80.1058590.820.207737
90.3263622.5280.007061
100.1712211.32630.094887
110.1837631.42340.079897
120.525164.06797e-05
130.1629381.26210.105896
140.1952111.51210.06788
150.1352371.04750.149526
16-0.067781-0.5250.30075
170.0215490.16690.433999
180.0240040.18590.426562
19-0.056909-0.44080.330467
20-0.018107-0.14030.444463
210.0451130.34940.36399
22-0.007526-0.05830.476854
230.0138640.10740.45742
240.1808581.40090.083195
25-0.041031-0.31780.37586
26-0.014067-0.1090.456798
27-0.040044-0.31020.378749
28-0.251226-1.9460.028172
29-0.193072-1.49550.070009
30-0.222395-1.72270.04505
31-0.213952-1.65730.051343
32-0.114836-0.88950.18864
33-0.128284-0.99370.162184
34-0.144954-1.12280.132995
35-0.178334-1.38140.086144
36-0.000598-0.00460.498159

\begin{tabular}{lllllllll}
\hline
Autocorrelation Function \tabularnewline
Time lag k & ACF(k) & T-STAT & P-value \tabularnewline
1 & 0.359076 & 2.7814 & 0.003611 \tabularnewline
2 & 0.391778 & 3.0347 & 0.001778 \tabularnewline
3 & 0.392699 & 3.0418 & 0.001742 \tabularnewline
4 & 0.154224 & 1.1946 & 0.11847 \tabularnewline
5 & 0.236338 & 1.8307 & 0.036059 \tabularnewline
6 & 0.204782 & 1.5862 & 0.058972 \tabularnewline
7 & 0.14441 & 1.1186 & 0.133886 \tabularnewline
8 & 0.105859 & 0.82 & 0.207737 \tabularnewline
9 & 0.326362 & 2.528 & 0.007061 \tabularnewline
10 & 0.171221 & 1.3263 & 0.094887 \tabularnewline
11 & 0.183763 & 1.4234 & 0.079897 \tabularnewline
12 & 0.52516 & 4.0679 & 7e-05 \tabularnewline
13 & 0.162938 & 1.2621 & 0.105896 \tabularnewline
14 & 0.195211 & 1.5121 & 0.06788 \tabularnewline
15 & 0.135237 & 1.0475 & 0.149526 \tabularnewline
16 & -0.067781 & -0.525 & 0.30075 \tabularnewline
17 & 0.021549 & 0.1669 & 0.433999 \tabularnewline
18 & 0.024004 & 0.1859 & 0.426562 \tabularnewline
19 & -0.056909 & -0.4408 & 0.330467 \tabularnewline
20 & -0.018107 & -0.1403 & 0.444463 \tabularnewline
21 & 0.045113 & 0.3494 & 0.36399 \tabularnewline
22 & -0.007526 & -0.0583 & 0.476854 \tabularnewline
23 & 0.013864 & 0.1074 & 0.45742 \tabularnewline
24 & 0.180858 & 1.4009 & 0.083195 \tabularnewline
25 & -0.041031 & -0.3178 & 0.37586 \tabularnewline
26 & -0.014067 & -0.109 & 0.456798 \tabularnewline
27 & -0.040044 & -0.3102 & 0.378749 \tabularnewline
28 & -0.251226 & -1.946 & 0.028172 \tabularnewline
29 & -0.193072 & -1.4955 & 0.070009 \tabularnewline
30 & -0.222395 & -1.7227 & 0.04505 \tabularnewline
31 & -0.213952 & -1.6573 & 0.051343 \tabularnewline
32 & -0.114836 & -0.8895 & 0.18864 \tabularnewline
33 & -0.128284 & -0.9937 & 0.162184 \tabularnewline
34 & -0.144954 & -1.1228 & 0.132995 \tabularnewline
35 & -0.178334 & -1.3814 & 0.086144 \tabularnewline
36 & -0.000598 & -0.0046 & 0.498159 \tabularnewline
\hline
\end{tabular}
%Source: https://freestatistics.org/blog/index.php?pk=61096&T=1

[TABLE]
[ROW][C]Autocorrelation Function[/C][/ROW]
[ROW][C]Time lag k[/C][C]ACF(k)[/C][C]T-STAT[/C][C]P-value[/C][/ROW]
[ROW][C]1[/C][C]0.359076[/C][C]2.7814[/C][C]0.003611[/C][/ROW]
[ROW][C]2[/C][C]0.391778[/C][C]3.0347[/C][C]0.001778[/C][/ROW]
[ROW][C]3[/C][C]0.392699[/C][C]3.0418[/C][C]0.001742[/C][/ROW]
[ROW][C]4[/C][C]0.154224[/C][C]1.1946[/C][C]0.11847[/C][/ROW]
[ROW][C]5[/C][C]0.236338[/C][C]1.8307[/C][C]0.036059[/C][/ROW]
[ROW][C]6[/C][C]0.204782[/C][C]1.5862[/C][C]0.058972[/C][/ROW]
[ROW][C]7[/C][C]0.14441[/C][C]1.1186[/C][C]0.133886[/C][/ROW]
[ROW][C]8[/C][C]0.105859[/C][C]0.82[/C][C]0.207737[/C][/ROW]
[ROW][C]9[/C][C]0.326362[/C][C]2.528[/C][C]0.007061[/C][/ROW]
[ROW][C]10[/C][C]0.171221[/C][C]1.3263[/C][C]0.094887[/C][/ROW]
[ROW][C]11[/C][C]0.183763[/C][C]1.4234[/C][C]0.079897[/C][/ROW]
[ROW][C]12[/C][C]0.52516[/C][C]4.0679[/C][C]7e-05[/C][/ROW]
[ROW][C]13[/C][C]0.162938[/C][C]1.2621[/C][C]0.105896[/C][/ROW]
[ROW][C]14[/C][C]0.195211[/C][C]1.5121[/C][C]0.06788[/C][/ROW]
[ROW][C]15[/C][C]0.135237[/C][C]1.0475[/C][C]0.149526[/C][/ROW]
[ROW][C]16[/C][C]-0.067781[/C][C]-0.525[/C][C]0.30075[/C][/ROW]
[ROW][C]17[/C][C]0.021549[/C][C]0.1669[/C][C]0.433999[/C][/ROW]
[ROW][C]18[/C][C]0.024004[/C][C]0.1859[/C][C]0.426562[/C][/ROW]
[ROW][C]19[/C][C]-0.056909[/C][C]-0.4408[/C][C]0.330467[/C][/ROW]
[ROW][C]20[/C][C]-0.018107[/C][C]-0.1403[/C][C]0.444463[/C][/ROW]
[ROW][C]21[/C][C]0.045113[/C][C]0.3494[/C][C]0.36399[/C][/ROW]
[ROW][C]22[/C][C]-0.007526[/C][C]-0.0583[/C][C]0.476854[/C][/ROW]
[ROW][C]23[/C][C]0.013864[/C][C]0.1074[/C][C]0.45742[/C][/ROW]
[ROW][C]24[/C][C]0.180858[/C][C]1.4009[/C][C]0.083195[/C][/ROW]
[ROW][C]25[/C][C]-0.041031[/C][C]-0.3178[/C][C]0.37586[/C][/ROW]
[ROW][C]26[/C][C]-0.014067[/C][C]-0.109[/C][C]0.456798[/C][/ROW]
[ROW][C]27[/C][C]-0.040044[/C][C]-0.3102[/C][C]0.378749[/C][/ROW]
[ROW][C]28[/C][C]-0.251226[/C][C]-1.946[/C][C]0.028172[/C][/ROW]
[ROW][C]29[/C][C]-0.193072[/C][C]-1.4955[/C][C]0.070009[/C][/ROW]
[ROW][C]30[/C][C]-0.222395[/C][C]-1.7227[/C][C]0.04505[/C][/ROW]
[ROW][C]31[/C][C]-0.213952[/C][C]-1.6573[/C][C]0.051343[/C][/ROW]
[ROW][C]32[/C][C]-0.114836[/C][C]-0.8895[/C][C]0.18864[/C][/ROW]
[ROW][C]33[/C][C]-0.128284[/C][C]-0.9937[/C][C]0.162184[/C][/ROW]
[ROW][C]34[/C][C]-0.144954[/C][C]-1.1228[/C][C]0.132995[/C][/ROW]
[ROW][C]35[/C][C]-0.178334[/C][C]-1.3814[/C][C]0.086144[/C][/ROW]
[ROW][C]36[/C][C]-0.000598[/C][C]-0.0046[/C][C]0.498159[/C][/ROW]
[/TABLE]
Source: https://freestatistics.org/blog/index.php?pk=61096&T=1

Globally Unique Identifier (entire table): ba.freestatistics.org/blog/index.php?pk=61096&T=1

As an alternative you can also use a QR Code:  

The GUIDs for individual cells are displayed in the table below:

Autocorrelation Function
Time lag kACF(k)T-STATP-value
10.3590762.78140.003611
20.3917783.03470.001778
30.3926993.04180.001742
40.1542241.19460.11847
50.2363381.83070.036059
60.2047821.58620.058972
70.144411.11860.133886
80.1058590.820.207737
90.3263622.5280.007061
100.1712211.32630.094887
110.1837631.42340.079897
120.525164.06797e-05
130.1629381.26210.105896
140.1952111.51210.06788
150.1352371.04750.149526
16-0.067781-0.5250.30075
170.0215490.16690.433999
180.0240040.18590.426562
19-0.056909-0.44080.330467
20-0.018107-0.14030.444463
210.0451130.34940.36399
22-0.007526-0.05830.476854
230.0138640.10740.45742
240.1808581.40090.083195
25-0.041031-0.31780.37586
26-0.014067-0.1090.456798
27-0.040044-0.31020.378749
28-0.251226-1.9460.028172
29-0.193072-1.49550.070009
30-0.222395-1.72270.04505
31-0.213952-1.65730.051343
32-0.114836-0.88950.18864
33-0.128284-0.99370.162184
34-0.144954-1.12280.132995
35-0.178334-1.38140.086144
36-0.000598-0.00460.498159


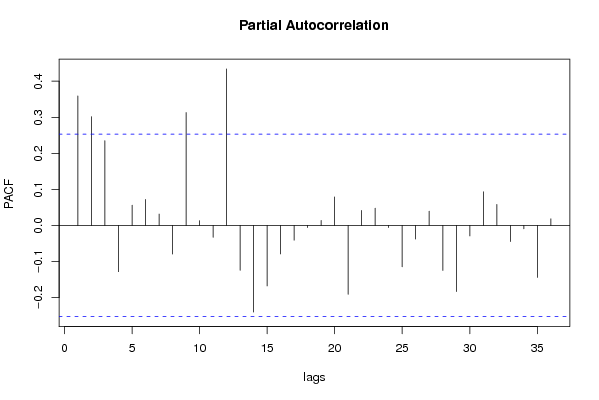
Partial Autocorrelation Function
Time lag kPACF(k)T-STATP-value
10.3590762.78140.003611
20.3017482.33730.011388
30.2350731.82090.036807
4-0.128231-0.99330.162283
50.0561360.43480.332625
60.0720240.55790.289497
70.031420.24340.404271
8-0.079339-0.61460.270585
90.3130942.42520.009163
100.013170.1020.459542
11-0.032961-0.25530.399678
120.4343.36180.000676
13-0.124508-0.96440.16935
14-0.240157-1.86020.033877
15-0.167906-1.30060.099185
16-0.079253-0.61390.270804
17-0.040914-0.31690.376204
18-0.005792-0.04490.482183
190.013950.10810.457157
200.0791080.61280.271173
21-0.191237-1.48130.071877
220.0415530.32190.374337
230.0478070.37030.356227
24-0.005928-0.04590.481765
25-0.114892-0.890.188523
26-0.037896-0.29350.38506
270.0396230.30690.379985
28-0.124892-0.96740.168611
29-0.183379-1.42040.080327
30-0.029052-0.2250.411359
310.0932570.72240.236439
320.0582320.45110.326786
33-0.044902-0.34780.364599
34-0.009516-0.07370.470742
35-0.144288-1.11760.134086
360.0185060.14330.443248

\begin{tabular}{lllllllll}
\hline
Partial Autocorrelation Function \tabularnewline
Time lag k & PACF(k) & T-STAT & P-value \tabularnewline
1 & 0.359076 & 2.7814 & 0.003611 \tabularnewline
2 & 0.301748 & 2.3373 & 0.011388 \tabularnewline
3 & 0.235073 & 1.8209 & 0.036807 \tabularnewline
4 & -0.128231 & -0.9933 & 0.162283 \tabularnewline
5 & 0.056136 & 0.4348 & 0.332625 \tabularnewline
6 & 0.072024 & 0.5579 & 0.289497 \tabularnewline
7 & 0.03142 & 0.2434 & 0.404271 \tabularnewline
8 & -0.079339 & -0.6146 & 0.270585 \tabularnewline
9 & 0.313094 & 2.4252 & 0.009163 \tabularnewline
10 & 0.01317 & 0.102 & 0.459542 \tabularnewline
11 & -0.032961 & -0.2553 & 0.399678 \tabularnewline
12 & 0.434 & 3.3618 & 0.000676 \tabularnewline
13 & -0.124508 & -0.9644 & 0.16935 \tabularnewline
14 & -0.240157 & -1.8602 & 0.033877 \tabularnewline
15 & -0.167906 & -1.3006 & 0.099185 \tabularnewline
16 & -0.079253 & -0.6139 & 0.270804 \tabularnewline
17 & -0.040914 & -0.3169 & 0.376204 \tabularnewline
18 & -0.005792 & -0.0449 & 0.482183 \tabularnewline
19 & 0.01395 & 0.1081 & 0.457157 \tabularnewline
20 & 0.079108 & 0.6128 & 0.271173 \tabularnewline
21 & -0.191237 & -1.4813 & 0.071877 \tabularnewline
22 & 0.041553 & 0.3219 & 0.374337 \tabularnewline
23 & 0.047807 & 0.3703 & 0.356227 \tabularnewline
24 & -0.005928 & -0.0459 & 0.481765 \tabularnewline
25 & -0.114892 & -0.89 & 0.188523 \tabularnewline
26 & -0.037896 & -0.2935 & 0.38506 \tabularnewline
27 & 0.039623 & 0.3069 & 0.379985 \tabularnewline
28 & -0.124892 & -0.9674 & 0.168611 \tabularnewline
29 & -0.183379 & -1.4204 & 0.080327 \tabularnewline
30 & -0.029052 & -0.225 & 0.411359 \tabularnewline
31 & 0.093257 & 0.7224 & 0.236439 \tabularnewline
32 & 0.058232 & 0.4511 & 0.326786 \tabularnewline
33 & -0.044902 & -0.3478 & 0.364599 \tabularnewline
34 & -0.009516 & -0.0737 & 0.470742 \tabularnewline
35 & -0.144288 & -1.1176 & 0.134086 \tabularnewline
36 & 0.018506 & 0.1433 & 0.443248 \tabularnewline
\hline
\end{tabular}
%Source: https://freestatistics.org/blog/index.php?pk=61096&T=2

[TABLE]
[ROW][C]Partial Autocorrelation Function[/C][/ROW]
[ROW][C]Time lag k[/C][C]PACF(k)[/C][C]T-STAT[/C][C]P-value[/C][/ROW]
[ROW][C]1[/C][C]0.359076[/C][C]2.7814[/C][C]0.003611[/C][/ROW]
[ROW][C]2[/C][C]0.301748[/C][C]2.3373[/C][C]0.011388[/C][/ROW]
[ROW][C]3[/C][C]0.235073[/C][C]1.8209[/C][C]0.036807[/C][/ROW]
[ROW][C]4[/C][C]-0.128231[/C][C]-0.9933[/C][C]0.162283[/C][/ROW]
[ROW][C]5[/C][C]0.056136[/C][C]0.4348[/C][C]0.332625[/C][/ROW]
[ROW][C]6[/C][C]0.072024[/C][C]0.5579[/C][C]0.289497[/C][/ROW]
[ROW][C]7[/C][C]0.03142[/C][C]0.2434[/C][C]0.404271[/C][/ROW]
[ROW][C]8[/C][C]-0.079339[/C][C]-0.6146[/C][C]0.270585[/C][/ROW]
[ROW][C]9[/C][C]0.313094[/C][C]2.4252[/C][C]0.009163[/C][/ROW]
[ROW][C]10[/C][C]0.01317[/C][C]0.102[/C][C]0.459542[/C][/ROW]
[ROW][C]11[/C][C]-0.032961[/C][C]-0.2553[/C][C]0.399678[/C][/ROW]
[ROW][C]12[/C][C]0.434[/C][C]3.3618[/C][C]0.000676[/C][/ROW]
[ROW][C]13[/C][C]-0.124508[/C][C]-0.9644[/C][C]0.16935[/C][/ROW]
[ROW][C]14[/C][C]-0.240157[/C][C]-1.8602[/C][C]0.033877[/C][/ROW]
[ROW][C]15[/C][C]-0.167906[/C][C]-1.3006[/C][C]0.099185[/C][/ROW]
[ROW][C]16[/C][C]-0.079253[/C][C]-0.6139[/C][C]0.270804[/C][/ROW]
[ROW][C]17[/C][C]-0.040914[/C][C]-0.3169[/C][C]0.376204[/C][/ROW]
[ROW][C]18[/C][C]-0.005792[/C][C]-0.0449[/C][C]0.482183[/C][/ROW]
[ROW][C]19[/C][C]0.01395[/C][C]0.1081[/C][C]0.457157[/C][/ROW]
[ROW][C]20[/C][C]0.079108[/C][C]0.6128[/C][C]0.271173[/C][/ROW]
[ROW][C]21[/C][C]-0.191237[/C][C]-1.4813[/C][C]0.071877[/C][/ROW]
[ROW][C]22[/C][C]0.041553[/C][C]0.3219[/C][C]0.374337[/C][/ROW]
[ROW][C]23[/C][C]0.047807[/C][C]0.3703[/C][C]0.356227[/C][/ROW]
[ROW][C]24[/C][C]-0.005928[/C][C]-0.0459[/C][C]0.481765[/C][/ROW]
[ROW][C]25[/C][C]-0.114892[/C][C]-0.89[/C][C]0.188523[/C][/ROW]
[ROW][C]26[/C][C]-0.037896[/C][C]-0.2935[/C][C]0.38506[/C][/ROW]
[ROW][C]27[/C][C]0.039623[/C][C]0.3069[/C][C]0.379985[/C][/ROW]
[ROW][C]28[/C][C]-0.124892[/C][C]-0.9674[/C][C]0.168611[/C][/ROW]
[ROW][C]29[/C][C]-0.183379[/C][C]-1.4204[/C][C]0.080327[/C][/ROW]
[ROW][C]30[/C][C]-0.029052[/C][C]-0.225[/C][C]0.411359[/C][/ROW]
[ROW][C]31[/C][C]0.093257[/C][C]0.7224[/C][C]0.236439[/C][/ROW]
[ROW][C]32[/C][C]0.058232[/C][C]0.4511[/C][C]0.326786[/C][/ROW]
[ROW][C]33[/C][C]-0.044902[/C][C]-0.3478[/C][C]0.364599[/C][/ROW]
[ROW][C]34[/C][C]-0.009516[/C][C]-0.0737[/C][C]0.470742[/C][/ROW]
[ROW][C]35[/C][C]-0.144288[/C][C]-1.1176[/C][C]0.134086[/C][/ROW]
[ROW][C]36[/C][C]0.018506[/C][C]0.1433[/C][C]0.443248[/C][/ROW]
[/TABLE]
Source: https://freestatistics.org/blog/index.php?pk=61096&T=2

Globally Unique Identifier (entire table): ba.freestatistics.org/blog/index.php?pk=61096&T=2

As an alternative you can also use a QR Code:  

The GUIDs for individual cells are displayed in the table below:

Partial Autocorrelation Function
Time lag kPACF(k)T-STATP-value
10.3590762.78140.003611
20.3017482.33730.011388
30.2350731.82090.036807
4-0.128231-0.99330.162283
50.0561360.43480.332625
60.0720240.55790.289497
70.031420.24340.404271
8-0.079339-0.61460.270585
90.3130942.42520.009163
100.013170.1020.459542
11-0.032961-0.25530.399678
120.4343.36180.000676
13-0.124508-0.96440.16935
14-0.240157-1.86020.033877
15-0.167906-1.30060.099185
16-0.079253-0.61390.270804
17-0.040914-0.31690.376204
18-0.005792-0.04490.482183
190.013950.10810.457157
200.0791080.61280.271173
21-0.191237-1.48130.071877
220.0415530.32190.374337
230.0478070.37030.356227
24-0.005928-0.04590.481765
25-0.114892-0.890.188523
26-0.037896-0.29350.38506
270.0396230.30690.379985
28-0.124892-0.96740.168611
29-0.183379-1.42040.080327
30-0.029052-0.2250.411359
310.0932570.72240.236439
320.0582320.45110.326786
33-0.044902-0.34780.364599
34-0.009516-0.07370.470742
35-0.144288-1.11760.134086
360.0185060.14330.443248


Parameters (Session):
par1 = 36 ; par2 = 1 ; par3 = 0 ; par4 = 0 ; par5 = 12 ; par6 = MA ; par7 = 0.95 ;
Parameters (R input):
par1 = 36 ; par2 = 1 ; par3 = 0 ; par4 = 0 ; par5 = 12 ; par6 = MA ; par7 = 0.95 ;
R code (references can be found in the software module):
if (par1 == 'Default') {
par1 = 10*log10(length(x))
} else {
par1 <- as.numeric(par1)
}
par2 <- as.numeric(par2)
par3 <- as.numeric(par3)
par4 <- as.numeric(par4)
par5 <- as.numeric(par5)
if (par6 == 'White Noise') par6 <- 'white' else par6 <- 'ma'
par7 <- as.numeric(par7)
if (par2 == 0) {
x <- log(x)
} else {
x <- (x ^ par2 - 1) / par2
}
if (par3 > 0) x <- diff(x,lag=1,difference=par3)
if (par4 > 0) x <- diff(x,lag=par5,difference=par4)
bitmap(file='pic1.png')
racf <- acf(x, par1, main='Autocorrelation', xlab='time lag', ylab='ACF', ci.type=par6, ci=par7, sub=paste('(lambda=',par2,', d=',par3,', D=',par4,', CI=', par7, ', CI type=',par6,')',sep=''))
dev.off()
bitmap(file='pic2.png')
rpacf <- pacf(x,par1,main='Partial Autocorrelation',xlab='lags',ylab='PACF')
dev.off()
(myacf <- c(racf$acf))
(mypacf <- c(rpacf$acf))
lengthx <- length(x)
sqrtn <- sqrt(lengthx)
load(file='createtable')
a<-table.start()
a<-table.row.start(a)
a<-table.element(a,'Autocorrelation Function',4,TRUE)
a<-table.row.end(a)
a<-table.row.start(a)
a<-table.element(a,'Time lag k',header=TRUE)
a<-table.element(a,hyperlink('basics.htm','ACF(k)','click here for more information about the Autocorrelation Function'),header=TRUE)
a<-table.element(a,'T-STAT',header=TRUE)
a<-table.element(a,'P-value',header=TRUE)
a<-table.row.end(a)
for (i in 2:(par1+1)) {
a<-table.row.start(a)
a<-table.element(a,i-1,header=TRUE)
a<-table.element(a,round(myacf[i],6))
mytstat <- myacf[i]*sqrtn
a<-table.element(a,round(mytstat,4))
a<-table.element(a,round(1-pt(abs(mytstat),lengthx),6))
a<-table.row.end(a)
}
a<-table.end(a)
table.save(a,file='mytable.tab')
a<-table.start()
a<-table.row.start(a)
a<-table.element(a,'Partial Autocorrelation Function',4,TRUE)
a<-table.row.end(a)
a<-table.row.start(a)
a<-table.element(a,'Time lag k',header=TRUE)
a<-table.element(a,hyperlink('basics.htm','PACF(k)','click here for more information about the Partial Autocorrelation Function'),header=TRUE)
a<-table.element(a,'T-STAT',header=TRUE)
a<-table.element(a,'P-value',header=TRUE)
a<-table.row.end(a)
for (i in 1:par1) {
a<-table.row.start(a)
a<-table.element(a,i,header=TRUE)
a<-table.element(a,round(mypacf[i],6))
mytstat <- mypacf[i]*sqrtn
a<-table.element(a,round(mytstat,4))
a<-table.element(a,round(1-pt(abs(mytstat),lengthx),6))
a<-table.row.end(a)
}
a<-table.end(a)
table.save(a,file='mytable1.tab')