Free Statistics

of Irreproducible Research!

Author's title

Author*The author of this computation has been verified*
R Software Modulerwasp_autocorrelation.wasp
Title produced by software(Partial) Autocorrelation Function
Date of computationFri, 27 Nov 2009 12:06:02 -0700
Cite this page as followsStatistical Computations at FreeStatistics.org, Office for Research Development and Education, URL https://freestatistics.org/blog/index.php?v=date/2009/Nov/27/t1259348870bvzvfcpsrlmm3l4.htm/, Retrieved Mon, 29 Apr 2024 00:05:08 +0000
Statistical Computations at FreeStatistics.org, Office for Research Development and Education, URL https://freestatistics.org/blog/index.php?pk=61143, Retrieved Mon, 29 Apr 2024 00:05:08 +0000
QR Codes:

Original text written by user:
IsPrivate?No (this computation is public)
User-defined keywords
Estimated Impact108
Family? (F = Feedback message, R = changed R code, M = changed R Module, P = changed Parameters, D = changed Data)
-     [Univariate Explorative Data Analysis] [Run Sequence gebo...] [2008-12-12 13:32:37] [76963dc1903f0f612b6153510a3818cf]
- R  D  [Univariate Explorative Data Analysis] [Run Sequence gebo...] [2008-12-17 12:14:40] [76963dc1903f0f612b6153510a3818cf]
-         [Univariate Explorative Data Analysis] [Run Sequence Plot...] [2008-12-22 18:19:51] [1ce0d16c8f4225c977b42c8fa93bc163]
- RMP       [(Partial) Autocorrelation Function] [Identifying Integ...] [2009-11-22 12:16:10] [b98453cac15ba1066b407e146608df68]
-   PD          [(Partial) Autocorrelation Function] [WS8] [2009-11-27 19:06:02] [48076ccf082563ab8a2c81e57fdb5364] [Current]
Feedback Forum

Post a new message
Dataseries X:
10414,9
12476,8
12384,6
12266,7
12919,9
11497,3
12142
13919,4
12656,8
12034,1
13199,7
10881,3
11301,2
13643,9
12517
13981,1
14275,7
13435
13565,7
16216,3
12970
14079,9
14235
12213,4
12581
14130,4
14210,8
14378,5
13142,8
13714,7
13621,9
15379,8
13306,3
14391,2
14909,9
14025,4
12951,2
14344,3
16093,4
15413,6
14705,7
15972,8
16241,4
16626,4
17136,2
15622,9
18003,9
16136,1
14423,7
16789,4
16782,2
14133,8
12607
12004,5
12175,4
13268
12299,3
11800,6
13873,3
12269,6


Summary of computational transaction
Raw Inputview raw input (R code)
Raw Outputview raw output of R engine
Computing time1 seconds
R Server'Gwilym Jenkins' @ 72.249.127.135

\begin{tabular}{lllllllll}
\hline
Summary of computational transaction \tabularnewline
Raw Input & view raw input (R code)  \tabularnewline
Raw Output & view raw output of R engine  \tabularnewline
Computing time & 1 seconds \tabularnewline
R Server & 'Gwilym Jenkins' @ 72.249.127.135 \tabularnewline
\hline
\end{tabular}
%Source: https://freestatistics.org/blog/index.php?pk=61143&T=0

[TABLE]
[ROW][C]Summary of computational transaction[/C][/ROW]
[ROW][C]Raw Input[/C][C]view raw input (R code) [/C][/ROW]
[ROW][C]Raw Output[/C][C]view raw output of R engine [/C][/ROW]
[ROW][C]Computing time[/C][C]1 seconds[/C][/ROW]
[ROW][C]R Server[/C][C]'Gwilym Jenkins' @ 72.249.127.135[/C][/ROW]
[/TABLE]
Source: https://freestatistics.org/blog/index.php?pk=61143&T=0

Globally Unique Identifier (entire table): ba.freestatistics.org/blog/index.php?pk=61143&T=0

As an alternative you can also use a QR Code:  

The GUIDs for individual cells are displayed in the table below:

Summary of computational transaction
Raw Inputview raw input (R code)
Raw Outputview raw output of R engine
Computing time1 seconds
R Server'Gwilym Jenkins' @ 72.249.127.135


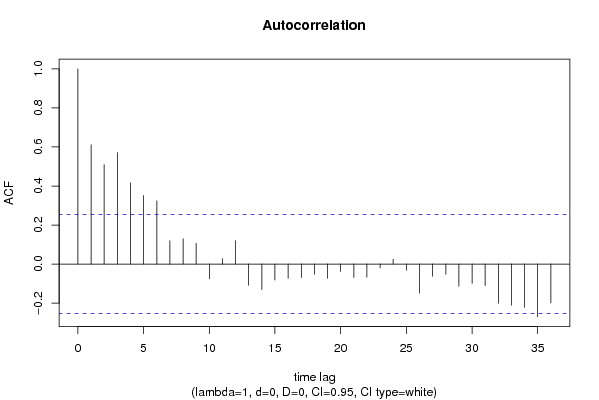
Autocorrelation Function
Time lag kACF(k)T-STATP-value
10.6117474.73867e-06
20.5094543.94620.000105
30.5713774.42592.1e-05
40.4161873.22380.001024
50.3519482.72620.004193
60.323862.50860.00742
70.1198380.92830.178496
80.1300411.00730.158919
90.1060670.82160.207281
10-0.075791-0.58710.279678
110.0280250.21710.41444
120.1200550.92990.178064
13-0.108536-0.84070.201923
14-0.131066-1.01520.157036
15-0.081526-0.63150.265056
16-0.073033-0.56570.286849
17-0.069303-0.53680.296688
18-0.05281-0.40910.341975
19-0.073368-0.56830.285974
20-0.038301-0.29670.383869
21-0.068677-0.5320.298356
22-0.067102-0.51980.302568
23-0.019876-0.1540.43908
240.0249960.19360.423565
25-0.031743-0.24590.403308
26-0.148909-1.15340.126652
27-0.062015-0.48040.316357
28-0.05222-0.40450.343643
29-0.114064-0.88350.190237
30-0.098839-0.76560.223457
31-0.11042-0.85530.197891
32-0.200692-1.55460.062656
33-0.210872-1.63340.05381
34-0.221652-1.71690.045577
35-0.2697-2.08910.020475
36-0.199641-1.54640.063632

\begin{tabular}{lllllllll}
\hline
Autocorrelation Function \tabularnewline
Time lag k & ACF(k) & T-STAT & P-value \tabularnewline
1 & 0.611747 & 4.7386 & 7e-06 \tabularnewline
2 & 0.509454 & 3.9462 & 0.000105 \tabularnewline
3 & 0.571377 & 4.4259 & 2.1e-05 \tabularnewline
4 & 0.416187 & 3.2238 & 0.001024 \tabularnewline
5 & 0.351948 & 2.7262 & 0.004193 \tabularnewline
6 & 0.32386 & 2.5086 & 0.00742 \tabularnewline
7 & 0.119838 & 0.9283 & 0.178496 \tabularnewline
8 & 0.130041 & 1.0073 & 0.158919 \tabularnewline
9 & 0.106067 & 0.8216 & 0.207281 \tabularnewline
10 & -0.075791 & -0.5871 & 0.279678 \tabularnewline
11 & 0.028025 & 0.2171 & 0.41444 \tabularnewline
12 & 0.120055 & 0.9299 & 0.178064 \tabularnewline
13 & -0.108536 & -0.8407 & 0.201923 \tabularnewline
14 & -0.131066 & -1.0152 & 0.157036 \tabularnewline
15 & -0.081526 & -0.6315 & 0.265056 \tabularnewline
16 & -0.073033 & -0.5657 & 0.286849 \tabularnewline
17 & -0.069303 & -0.5368 & 0.296688 \tabularnewline
18 & -0.05281 & -0.4091 & 0.341975 \tabularnewline
19 & -0.073368 & -0.5683 & 0.285974 \tabularnewline
20 & -0.038301 & -0.2967 & 0.383869 \tabularnewline
21 & -0.068677 & -0.532 & 0.298356 \tabularnewline
22 & -0.067102 & -0.5198 & 0.302568 \tabularnewline
23 & -0.019876 & -0.154 & 0.43908 \tabularnewline
24 & 0.024996 & 0.1936 & 0.423565 \tabularnewline
25 & -0.031743 & -0.2459 & 0.403308 \tabularnewline
26 & -0.148909 & -1.1534 & 0.126652 \tabularnewline
27 & -0.062015 & -0.4804 & 0.316357 \tabularnewline
28 & -0.05222 & -0.4045 & 0.343643 \tabularnewline
29 & -0.114064 & -0.8835 & 0.190237 \tabularnewline
30 & -0.098839 & -0.7656 & 0.223457 \tabularnewline
31 & -0.11042 & -0.8553 & 0.197891 \tabularnewline
32 & -0.200692 & -1.5546 & 0.062656 \tabularnewline
33 & -0.210872 & -1.6334 & 0.05381 \tabularnewline
34 & -0.221652 & -1.7169 & 0.045577 \tabularnewline
35 & -0.2697 & -2.0891 & 0.020475 \tabularnewline
36 & -0.199641 & -1.5464 & 0.063632 \tabularnewline
\hline
\end{tabular}
%Source: https://freestatistics.org/blog/index.php?pk=61143&T=1

[TABLE]
[ROW][C]Autocorrelation Function[/C][/ROW]
[ROW][C]Time lag k[/C][C]ACF(k)[/C][C]T-STAT[/C][C]P-value[/C][/ROW]
[ROW][C]1[/C][C]0.611747[/C][C]4.7386[/C][C]7e-06[/C][/ROW]
[ROW][C]2[/C][C]0.509454[/C][C]3.9462[/C][C]0.000105[/C][/ROW]
[ROW][C]3[/C][C]0.571377[/C][C]4.4259[/C][C]2.1e-05[/C][/ROW]
[ROW][C]4[/C][C]0.416187[/C][C]3.2238[/C][C]0.001024[/C][/ROW]
[ROW][C]5[/C][C]0.351948[/C][C]2.7262[/C][C]0.004193[/C][/ROW]
[ROW][C]6[/C][C]0.32386[/C][C]2.5086[/C][C]0.00742[/C][/ROW]
[ROW][C]7[/C][C]0.119838[/C][C]0.9283[/C][C]0.178496[/C][/ROW]
[ROW][C]8[/C][C]0.130041[/C][C]1.0073[/C][C]0.158919[/C][/ROW]
[ROW][C]9[/C][C]0.106067[/C][C]0.8216[/C][C]0.207281[/C][/ROW]
[ROW][C]10[/C][C]-0.075791[/C][C]-0.5871[/C][C]0.279678[/C][/ROW]
[ROW][C]11[/C][C]0.028025[/C][C]0.2171[/C][C]0.41444[/C][/ROW]
[ROW][C]12[/C][C]0.120055[/C][C]0.9299[/C][C]0.178064[/C][/ROW]
[ROW][C]13[/C][C]-0.108536[/C][C]-0.8407[/C][C]0.201923[/C][/ROW]
[ROW][C]14[/C][C]-0.131066[/C][C]-1.0152[/C][C]0.157036[/C][/ROW]
[ROW][C]15[/C][C]-0.081526[/C][C]-0.6315[/C][C]0.265056[/C][/ROW]
[ROW][C]16[/C][C]-0.073033[/C][C]-0.5657[/C][C]0.286849[/C][/ROW]
[ROW][C]17[/C][C]-0.069303[/C][C]-0.5368[/C][C]0.296688[/C][/ROW]
[ROW][C]18[/C][C]-0.05281[/C][C]-0.4091[/C][C]0.341975[/C][/ROW]
[ROW][C]19[/C][C]-0.073368[/C][C]-0.5683[/C][C]0.285974[/C][/ROW]
[ROW][C]20[/C][C]-0.038301[/C][C]-0.2967[/C][C]0.383869[/C][/ROW]
[ROW][C]21[/C][C]-0.068677[/C][C]-0.532[/C][C]0.298356[/C][/ROW]
[ROW][C]22[/C][C]-0.067102[/C][C]-0.5198[/C][C]0.302568[/C][/ROW]
[ROW][C]23[/C][C]-0.019876[/C][C]-0.154[/C][C]0.43908[/C][/ROW]
[ROW][C]24[/C][C]0.024996[/C][C]0.1936[/C][C]0.423565[/C][/ROW]
[ROW][C]25[/C][C]-0.031743[/C][C]-0.2459[/C][C]0.403308[/C][/ROW]
[ROW][C]26[/C][C]-0.148909[/C][C]-1.1534[/C][C]0.126652[/C][/ROW]
[ROW][C]27[/C][C]-0.062015[/C][C]-0.4804[/C][C]0.316357[/C][/ROW]
[ROW][C]28[/C][C]-0.05222[/C][C]-0.4045[/C][C]0.343643[/C][/ROW]
[ROW][C]29[/C][C]-0.114064[/C][C]-0.8835[/C][C]0.190237[/C][/ROW]
[ROW][C]30[/C][C]-0.098839[/C][C]-0.7656[/C][C]0.223457[/C][/ROW]
[ROW][C]31[/C][C]-0.11042[/C][C]-0.8553[/C][C]0.197891[/C][/ROW]
[ROW][C]32[/C][C]-0.200692[/C][C]-1.5546[/C][C]0.062656[/C][/ROW]
[ROW][C]33[/C][C]-0.210872[/C][C]-1.6334[/C][C]0.05381[/C][/ROW]
[ROW][C]34[/C][C]-0.221652[/C][C]-1.7169[/C][C]0.045577[/C][/ROW]
[ROW][C]35[/C][C]-0.2697[/C][C]-2.0891[/C][C]0.020475[/C][/ROW]
[ROW][C]36[/C][C]-0.199641[/C][C]-1.5464[/C][C]0.063632[/C][/ROW]
[/TABLE]
Source: https://freestatistics.org/blog/index.php?pk=61143&T=1

Globally Unique Identifier (entire table): ba.freestatistics.org/blog/index.php?pk=61143&T=1

As an alternative you can also use a QR Code:  

The GUIDs for individual cells are displayed in the table below:

Autocorrelation Function
Time lag kACF(k)T-STATP-value
10.6117474.73867e-06
20.5094543.94620.000105
30.5713774.42592.1e-05
40.4161873.22380.001024
50.3519482.72620.004193
60.323862.50860.00742
70.1198380.92830.178496
80.1300411.00730.158919
90.1060670.82160.207281
10-0.075791-0.58710.279678
110.0280250.21710.41444
120.1200550.92990.178064
13-0.108536-0.84070.201923
14-0.131066-1.01520.157036
15-0.081526-0.63150.265056
16-0.073033-0.56570.286849
17-0.069303-0.53680.296688
18-0.05281-0.40910.341975
19-0.073368-0.56830.285974
20-0.038301-0.29670.383869
21-0.068677-0.5320.298356
22-0.067102-0.51980.302568
23-0.019876-0.1540.43908
240.0249960.19360.423565
25-0.031743-0.24590.403308
26-0.148909-1.15340.126652
27-0.062015-0.48040.316357
28-0.05222-0.40450.343643
29-0.114064-0.88350.190237
30-0.098839-0.76560.223457
31-0.11042-0.85530.197891
32-0.200692-1.55460.062656
33-0.210872-1.63340.05381
34-0.221652-1.71690.045577
35-0.2697-2.08910.020475
36-0.199641-1.54640.063632


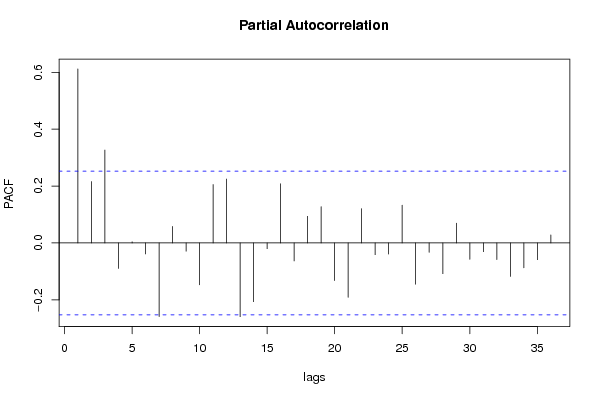
Partial Autocorrelation Function
Time lag kPACF(k)T-STATP-value
10.6117474.73867e-06
20.2160871.67380.049688
30.3266712.53040.007018
4-0.089332-0.6920.245815
50.0041960.03250.48709
6-0.03836-0.29710.383695
7-0.258841-2.0050.024742
80.0579620.4490.327534
9-0.028819-0.22320.412056
10-0.146972-1.13840.129731
110.2054711.59160.058369
120.2247861.74120.043388
13-0.258946-2.00580.024697
14-0.206571-1.60010.057415
15-0.019904-0.15420.438994
160.2081691.61250.056054
17-0.063072-0.48860.31347
180.0937370.72610.235305
190.1274030.98690.163837
20-0.132064-1.0230.155215
21-0.19104-1.47980.07208
220.1207280.93520.176728
23-0.041262-0.31960.375185
24-0.039094-0.30280.381537
250.1327051.02790.154055
26-0.145005-1.12320.132912
27-0.032733-0.25360.400354
28-0.107727-0.83450.203669
290.0693940.53750.296448
30-0.057292-0.44380.329399
31-0.030501-0.23630.407019
32-0.058459-0.45280.326155
33-0.117394-0.90930.183408
34-0.087389-0.67690.250532
35-0.058534-0.45340.325946
360.0283330.21950.413516

\begin{tabular}{lllllllll}
\hline
Partial Autocorrelation Function \tabularnewline
Time lag k & PACF(k) & T-STAT & P-value \tabularnewline
1 & 0.611747 & 4.7386 & 7e-06 \tabularnewline
2 & 0.216087 & 1.6738 & 0.049688 \tabularnewline
3 & 0.326671 & 2.5304 & 0.007018 \tabularnewline
4 & -0.089332 & -0.692 & 0.245815 \tabularnewline
5 & 0.004196 & 0.0325 & 0.48709 \tabularnewline
6 & -0.03836 & -0.2971 & 0.383695 \tabularnewline
7 & -0.258841 & -2.005 & 0.024742 \tabularnewline
8 & 0.057962 & 0.449 & 0.327534 \tabularnewline
9 & -0.028819 & -0.2232 & 0.412056 \tabularnewline
10 & -0.146972 & -1.1384 & 0.129731 \tabularnewline
11 & 0.205471 & 1.5916 & 0.058369 \tabularnewline
12 & 0.224786 & 1.7412 & 0.043388 \tabularnewline
13 & -0.258946 & -2.0058 & 0.024697 \tabularnewline
14 & -0.206571 & -1.6001 & 0.057415 \tabularnewline
15 & -0.019904 & -0.1542 & 0.438994 \tabularnewline
16 & 0.208169 & 1.6125 & 0.056054 \tabularnewline
17 & -0.063072 & -0.4886 & 0.31347 \tabularnewline
18 & 0.093737 & 0.7261 & 0.235305 \tabularnewline
19 & 0.127403 & 0.9869 & 0.163837 \tabularnewline
20 & -0.132064 & -1.023 & 0.155215 \tabularnewline
21 & -0.19104 & -1.4798 & 0.07208 \tabularnewline
22 & 0.120728 & 0.9352 & 0.176728 \tabularnewline
23 & -0.041262 & -0.3196 & 0.375185 \tabularnewline
24 & -0.039094 & -0.3028 & 0.381537 \tabularnewline
25 & 0.132705 & 1.0279 & 0.154055 \tabularnewline
26 & -0.145005 & -1.1232 & 0.132912 \tabularnewline
27 & -0.032733 & -0.2536 & 0.400354 \tabularnewline
28 & -0.107727 & -0.8345 & 0.203669 \tabularnewline
29 & 0.069394 & 0.5375 & 0.296448 \tabularnewline
30 & -0.057292 & -0.4438 & 0.329399 \tabularnewline
31 & -0.030501 & -0.2363 & 0.407019 \tabularnewline
32 & -0.058459 & -0.4528 & 0.326155 \tabularnewline
33 & -0.117394 & -0.9093 & 0.183408 \tabularnewline
34 & -0.087389 & -0.6769 & 0.250532 \tabularnewline
35 & -0.058534 & -0.4534 & 0.325946 \tabularnewline
36 & 0.028333 & 0.2195 & 0.413516 \tabularnewline
\hline
\end{tabular}
%Source: https://freestatistics.org/blog/index.php?pk=61143&T=2

[TABLE]
[ROW][C]Partial Autocorrelation Function[/C][/ROW]
[ROW][C]Time lag k[/C][C]PACF(k)[/C][C]T-STAT[/C][C]P-value[/C][/ROW]
[ROW][C]1[/C][C]0.611747[/C][C]4.7386[/C][C]7e-06[/C][/ROW]
[ROW][C]2[/C][C]0.216087[/C][C]1.6738[/C][C]0.049688[/C][/ROW]
[ROW][C]3[/C][C]0.326671[/C][C]2.5304[/C][C]0.007018[/C][/ROW]
[ROW][C]4[/C][C]-0.089332[/C][C]-0.692[/C][C]0.245815[/C][/ROW]
[ROW][C]5[/C][C]0.004196[/C][C]0.0325[/C][C]0.48709[/C][/ROW]
[ROW][C]6[/C][C]-0.03836[/C][C]-0.2971[/C][C]0.383695[/C][/ROW]
[ROW][C]7[/C][C]-0.258841[/C][C]-2.005[/C][C]0.024742[/C][/ROW]
[ROW][C]8[/C][C]0.057962[/C][C]0.449[/C][C]0.327534[/C][/ROW]
[ROW][C]9[/C][C]-0.028819[/C][C]-0.2232[/C][C]0.412056[/C][/ROW]
[ROW][C]10[/C][C]-0.146972[/C][C]-1.1384[/C][C]0.129731[/C][/ROW]
[ROW][C]11[/C][C]0.205471[/C][C]1.5916[/C][C]0.058369[/C][/ROW]
[ROW][C]12[/C][C]0.224786[/C][C]1.7412[/C][C]0.043388[/C][/ROW]
[ROW][C]13[/C][C]-0.258946[/C][C]-2.0058[/C][C]0.024697[/C][/ROW]
[ROW][C]14[/C][C]-0.206571[/C][C]-1.6001[/C][C]0.057415[/C][/ROW]
[ROW][C]15[/C][C]-0.019904[/C][C]-0.1542[/C][C]0.438994[/C][/ROW]
[ROW][C]16[/C][C]0.208169[/C][C]1.6125[/C][C]0.056054[/C][/ROW]
[ROW][C]17[/C][C]-0.063072[/C][C]-0.4886[/C][C]0.31347[/C][/ROW]
[ROW][C]18[/C][C]0.093737[/C][C]0.7261[/C][C]0.235305[/C][/ROW]
[ROW][C]19[/C][C]0.127403[/C][C]0.9869[/C][C]0.163837[/C][/ROW]
[ROW][C]20[/C][C]-0.132064[/C][C]-1.023[/C][C]0.155215[/C][/ROW]
[ROW][C]21[/C][C]-0.19104[/C][C]-1.4798[/C][C]0.07208[/C][/ROW]
[ROW][C]22[/C][C]0.120728[/C][C]0.9352[/C][C]0.176728[/C][/ROW]
[ROW][C]23[/C][C]-0.041262[/C][C]-0.3196[/C][C]0.375185[/C][/ROW]
[ROW][C]24[/C][C]-0.039094[/C][C]-0.3028[/C][C]0.381537[/C][/ROW]
[ROW][C]25[/C][C]0.132705[/C][C]1.0279[/C][C]0.154055[/C][/ROW]
[ROW][C]26[/C][C]-0.145005[/C][C]-1.1232[/C][C]0.132912[/C][/ROW]
[ROW][C]27[/C][C]-0.032733[/C][C]-0.2536[/C][C]0.400354[/C][/ROW]
[ROW][C]28[/C][C]-0.107727[/C][C]-0.8345[/C][C]0.203669[/C][/ROW]
[ROW][C]29[/C][C]0.069394[/C][C]0.5375[/C][C]0.296448[/C][/ROW]
[ROW][C]30[/C][C]-0.057292[/C][C]-0.4438[/C][C]0.329399[/C][/ROW]
[ROW][C]31[/C][C]-0.030501[/C][C]-0.2363[/C][C]0.407019[/C][/ROW]
[ROW][C]32[/C][C]-0.058459[/C][C]-0.4528[/C][C]0.326155[/C][/ROW]
[ROW][C]33[/C][C]-0.117394[/C][C]-0.9093[/C][C]0.183408[/C][/ROW]
[ROW][C]34[/C][C]-0.087389[/C][C]-0.6769[/C][C]0.250532[/C][/ROW]
[ROW][C]35[/C][C]-0.058534[/C][C]-0.4534[/C][C]0.325946[/C][/ROW]
[ROW][C]36[/C][C]0.028333[/C][C]0.2195[/C][C]0.413516[/C][/ROW]
[/TABLE]
Source: https://freestatistics.org/blog/index.php?pk=61143&T=2

Globally Unique Identifier (entire table): ba.freestatistics.org/blog/index.php?pk=61143&T=2

As an alternative you can also use a QR Code:  

The GUIDs for individual cells are displayed in the table below:

Partial Autocorrelation Function
Time lag kPACF(k)T-STATP-value
10.6117474.73867e-06
20.2160871.67380.049688
30.3266712.53040.007018
4-0.089332-0.6920.245815
50.0041960.03250.48709
6-0.03836-0.29710.383695
7-0.258841-2.0050.024742
80.0579620.4490.327534
9-0.028819-0.22320.412056
10-0.146972-1.13840.129731
110.2054711.59160.058369
120.2247861.74120.043388
13-0.258946-2.00580.024697
14-0.206571-1.60010.057415
15-0.019904-0.15420.438994
160.2081691.61250.056054
17-0.063072-0.48860.31347
180.0937370.72610.235305
190.1274030.98690.163837
20-0.132064-1.0230.155215
21-0.19104-1.47980.07208
220.1207280.93520.176728
23-0.041262-0.31960.375185
24-0.039094-0.30280.381537
250.1327051.02790.154055
26-0.145005-1.12320.132912
27-0.032733-0.25360.400354
28-0.107727-0.83450.203669
290.0693940.53750.296448
30-0.057292-0.44380.329399
31-0.030501-0.23630.407019
32-0.058459-0.45280.326155
33-0.117394-0.90930.183408
34-0.087389-0.67690.250532
35-0.058534-0.45340.325946
360.0283330.21950.413516


Parameters (Session):
par1 = 36 ; par2 = 1 ; par3 = 0 ; par4 = 0 ; par5 = 12 ; par6 = White Noise ; par7 = 0.95 ;
Parameters (R input):
par1 = 36 ; par2 = 1 ; par3 = 0 ; par4 = 0 ; par5 = 12 ; par6 = White Noise ; par7 = 0.95 ;
R code (references can be found in the software module):
if (par1 == 'Default') {
par1 = 10*log10(length(x))
} else {
par1 <- as.numeric(par1)
}
par2 <- as.numeric(par2)
par3 <- as.numeric(par3)
par4 <- as.numeric(par4)
par5 <- as.numeric(par5)
if (par6 == 'White Noise') par6 <- 'white' else par6 <- 'ma'
par7 <- as.numeric(par7)
if (par2 == 0) {
x <- log(x)
} else {
x <- (x ^ par2 - 1) / par2
}
if (par3 > 0) x <- diff(x,lag=1,difference=par3)
if (par4 > 0) x <- diff(x,lag=par5,difference=par4)
bitmap(file='pic1.png')
racf <- acf(x, par1, main='Autocorrelation', xlab='time lag', ylab='ACF', ci.type=par6, ci=par7, sub=paste('(lambda=',par2,', d=',par3,', D=',par4,', CI=', par7, ', CI type=',par6,')',sep=''))
dev.off()
bitmap(file='pic2.png')
rpacf <- pacf(x,par1,main='Partial Autocorrelation',xlab='lags',ylab='PACF')
dev.off()
(myacf <- c(racf$acf))
(mypacf <- c(rpacf$acf))
lengthx <- length(x)
sqrtn <- sqrt(lengthx)
load(file='createtable')
a<-table.start()
a<-table.row.start(a)
a<-table.element(a,'Autocorrelation Function',4,TRUE)
a<-table.row.end(a)
a<-table.row.start(a)
a<-table.element(a,'Time lag k',header=TRUE)
a<-table.element(a,hyperlink('basics.htm','ACF(k)','click here for more information about the Autocorrelation Function'),header=TRUE)
a<-table.element(a,'T-STAT',header=TRUE)
a<-table.element(a,'P-value',header=TRUE)
a<-table.row.end(a)
for (i in 2:(par1+1)) {
a<-table.row.start(a)
a<-table.element(a,i-1,header=TRUE)
a<-table.element(a,round(myacf[i],6))
mytstat <- myacf[i]*sqrtn
a<-table.element(a,round(mytstat,4))
a<-table.element(a,round(1-pt(abs(mytstat),lengthx),6))
a<-table.row.end(a)
}
a<-table.end(a)
table.save(a,file='mytable.tab')
a<-table.start()
a<-table.row.start(a)
a<-table.element(a,'Partial Autocorrelation Function',4,TRUE)
a<-table.row.end(a)
a<-table.row.start(a)
a<-table.element(a,'Time lag k',header=TRUE)
a<-table.element(a,hyperlink('basics.htm','PACF(k)','click here for more information about the Partial Autocorrelation Function'),header=TRUE)
a<-table.element(a,'T-STAT',header=TRUE)
a<-table.element(a,'P-value',header=TRUE)
a<-table.row.end(a)
for (i in 1:par1) {
a<-table.row.start(a)
a<-table.element(a,i,header=TRUE)
a<-table.element(a,round(mypacf[i],6))
mytstat <- mypacf[i]*sqrtn
a<-table.element(a,round(mytstat,4))
a<-table.element(a,round(1-pt(abs(mytstat),lengthx),6))
a<-table.row.end(a)
}
a<-table.end(a)
table.save(a,file='mytable1.tab')