Free Statistics

of Irreproducible Research!

Author's title

Author*The author of this computation has been verified*
R Software Modulerwasp_autocorrelation.wasp
Title produced by software(Partial) Autocorrelation Function
Date of computationFri, 27 Nov 2009 13:15:32 -0700
Cite this page as followsStatistical Computations at FreeStatistics.org, Office for Research Development and Education, URL https://freestatistics.org/blog/index.php?v=date/2009/Nov/27/t1259352966bpo54ij1g3b338k.htm/, Retrieved Sun, 28 Apr 2024 19:14:58 +0000
Statistical Computations at FreeStatistics.org, Office for Research Development and Education, URL https://freestatistics.org/blog/index.php?pk=61234, Retrieved Sun, 28 Apr 2024 19:14:58 +0000
QR Codes:

Original text written by user:
IsPrivate?No (this computation is public)
User-defined keywords
Estimated Impact123
Family? (F = Feedback message, R = changed R code, M = changed R Module, P = changed Parameters, D = changed Data)
-     [Univariate Explorative Data Analysis] [Run Sequence gebo...] [2008-12-12 13:32:37] [76963dc1903f0f612b6153510a3818cf]
- R  D  [Univariate Explorative Data Analysis] [Run Sequence gebo...] [2008-12-17 12:14:40] [76963dc1903f0f612b6153510a3818cf]
-         [Univariate Explorative Data Analysis] [Run Sequence Plot...] [2008-12-22 18:19:51] [1ce0d16c8f4225c977b42c8fa93bc163]
- RMP       [(Partial) Autocorrelation Function] [Identifying Integ...] [2009-11-22 12:26:39] [b98453cac15ba1066b407e146608df68]
- R  D          [(Partial) Autocorrelation Function] [] [2009-11-27 20:15:32] [8af916b6a531ec49628252b0a0ece045] [Current]
Feedback Forum

Post a new message
Dataseries X:
100,6
104,3
120,4
107,5
102,9
125,6
107,5
108,8
128,4
121,1
119,5
128,7
108,7
105,5
119,8
111,3
110,6
120,1
97,5
107,7
127,3
117,2
119,8
116,2
111
112,4
130,6
109,1
118,8
123,9
101,6
112,8
128
129,6
125,8
119,5
115,7
113,6
129,7
112
116,8
127
112,1
114,2
121,1
131,6
125
120,4
117,7
117,5
120,6
127,5
112,3
124,5
115,2
104,7
130,9
129,2
113,5
125,6
107,6


Summary of computational transaction
Raw Inputview raw input (R code)
Raw Outputview raw output of R engine
Computing time1 seconds
R Server'Gwilym Jenkins' @ 72.249.127.135

\begin{tabular}{lllllllll}
\hline
Summary of computational transaction \tabularnewline
Raw Input & view raw input (R code)  \tabularnewline
Raw Output & view raw output of R engine  \tabularnewline
Computing time & 1 seconds \tabularnewline
R Server & 'Gwilym Jenkins' @ 72.249.127.135 \tabularnewline
\hline
\end{tabular}
%Source: https://freestatistics.org/blog/index.php?pk=61234&T=0

[TABLE]
[ROW][C]Summary of computational transaction[/C][/ROW]
[ROW][C]Raw Input[/C][C]view raw input (R code) [/C][/ROW]
[ROW][C]Raw Output[/C][C]view raw output of R engine [/C][/ROW]
[ROW][C]Computing time[/C][C]1 seconds[/C][/ROW]
[ROW][C]R Server[/C][C]'Gwilym Jenkins' @ 72.249.127.135[/C][/ROW]
[/TABLE]
Source: https://freestatistics.org/blog/index.php?pk=61234&T=0

Globally Unique Identifier (entire table): ba.freestatistics.org/blog/index.php?pk=61234&T=0

As an alternative you can also use a QR Code:  

The GUIDs for individual cells are displayed in the table below:

Summary of computational transaction
Raw Inputview raw input (R code)
Raw Outputview raw output of R engine
Computing time1 seconds
R Server'Gwilym Jenkins' @ 72.249.127.135


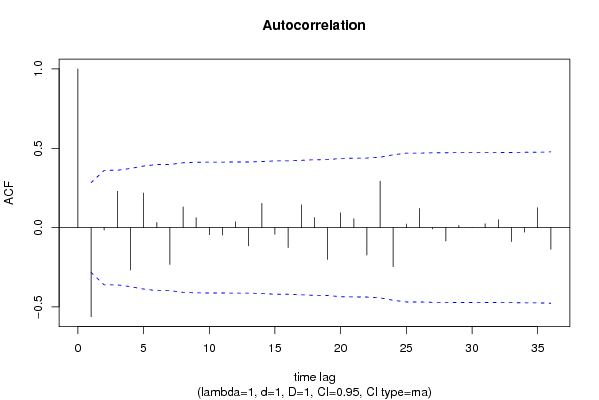
Autocorrelation Function
Time lag kACF(k)T-STATP-value
1-0.561735-3.89180.000153
2-0.015808-0.10950.456622
30.2285971.58380.059907
4-0.268264-1.85860.034611
50.2176441.50790.06907
60.0320540.22210.412599
7-0.232704-1.61220.056735
80.1299240.90010.18627
90.0623070.43170.333956
10-0.045362-0.31430.377337
11-0.047084-0.32620.372842
120.0365290.25310.400643
13-0.114994-0.79670.214773
140.1521391.0540.148569
15-0.042109-0.29170.38587
16-0.125792-0.87150.193907
170.1430630.99120.163286
180.0632080.43790.331705
19-0.201352-1.3950.084717
200.0932940.64640.260562
210.0555410.38480.351042
22-0.173301-1.20070.117887
230.2925732.0270.024118
24-0.246378-1.7070.047146
250.0218440.15130.440171
260.120510.83490.20395
27-0.008832-0.06120.47573
28-0.084903-0.58820.279569
290.012740.08830.465017
30-0.000875-0.00610.497593
310.0239840.16620.434362
320.049390.34220.366853
33-0.088505-0.61320.271325
34-0.028423-0.19690.42236
350.1242080.86050.196885
36-0.137339-0.95150.173056

\begin{tabular}{lllllllll}
\hline
Autocorrelation Function \tabularnewline
Time lag k & ACF(k) & T-STAT & P-value \tabularnewline
1 & -0.561735 & -3.8918 & 0.000153 \tabularnewline
2 & -0.015808 & -0.1095 & 0.456622 \tabularnewline
3 & 0.228597 & 1.5838 & 0.059907 \tabularnewline
4 & -0.268264 & -1.8586 & 0.034611 \tabularnewline
5 & 0.217644 & 1.5079 & 0.06907 \tabularnewline
6 & 0.032054 & 0.2221 & 0.412599 \tabularnewline
7 & -0.232704 & -1.6122 & 0.056735 \tabularnewline
8 & 0.129924 & 0.9001 & 0.18627 \tabularnewline
9 & 0.062307 & 0.4317 & 0.333956 \tabularnewline
10 & -0.045362 & -0.3143 & 0.377337 \tabularnewline
11 & -0.047084 & -0.3262 & 0.372842 \tabularnewline
12 & 0.036529 & 0.2531 & 0.400643 \tabularnewline
13 & -0.114994 & -0.7967 & 0.214773 \tabularnewline
14 & 0.152139 & 1.054 & 0.148569 \tabularnewline
15 & -0.042109 & -0.2917 & 0.38587 \tabularnewline
16 & -0.125792 & -0.8715 & 0.193907 \tabularnewline
17 & 0.143063 & 0.9912 & 0.163286 \tabularnewline
18 & 0.063208 & 0.4379 & 0.331705 \tabularnewline
19 & -0.201352 & -1.395 & 0.084717 \tabularnewline
20 & 0.093294 & 0.6464 & 0.260562 \tabularnewline
21 & 0.055541 & 0.3848 & 0.351042 \tabularnewline
22 & -0.173301 & -1.2007 & 0.117887 \tabularnewline
23 & 0.292573 & 2.027 & 0.024118 \tabularnewline
24 & -0.246378 & -1.707 & 0.047146 \tabularnewline
25 & 0.021844 & 0.1513 & 0.440171 \tabularnewline
26 & 0.12051 & 0.8349 & 0.20395 \tabularnewline
27 & -0.008832 & -0.0612 & 0.47573 \tabularnewline
28 & -0.084903 & -0.5882 & 0.279569 \tabularnewline
29 & 0.01274 & 0.0883 & 0.465017 \tabularnewline
30 & -0.000875 & -0.0061 & 0.497593 \tabularnewline
31 & 0.023984 & 0.1662 & 0.434362 \tabularnewline
32 & 0.04939 & 0.3422 & 0.366853 \tabularnewline
33 & -0.088505 & -0.6132 & 0.271325 \tabularnewline
34 & -0.028423 & -0.1969 & 0.42236 \tabularnewline
35 & 0.124208 & 0.8605 & 0.196885 \tabularnewline
36 & -0.137339 & -0.9515 & 0.173056 \tabularnewline
\hline
\end{tabular}
%Source: https://freestatistics.org/blog/index.php?pk=61234&T=1

[TABLE]
[ROW][C]Autocorrelation Function[/C][/ROW]
[ROW][C]Time lag k[/C][C]ACF(k)[/C][C]T-STAT[/C][C]P-value[/C][/ROW]
[ROW][C]1[/C][C]-0.561735[/C][C]-3.8918[/C][C]0.000153[/C][/ROW]
[ROW][C]2[/C][C]-0.015808[/C][C]-0.1095[/C][C]0.456622[/C][/ROW]
[ROW][C]3[/C][C]0.228597[/C][C]1.5838[/C][C]0.059907[/C][/ROW]
[ROW][C]4[/C][C]-0.268264[/C][C]-1.8586[/C][C]0.034611[/C][/ROW]
[ROW][C]5[/C][C]0.217644[/C][C]1.5079[/C][C]0.06907[/C][/ROW]
[ROW][C]6[/C][C]0.032054[/C][C]0.2221[/C][C]0.412599[/C][/ROW]
[ROW][C]7[/C][C]-0.232704[/C][C]-1.6122[/C][C]0.056735[/C][/ROW]
[ROW][C]8[/C][C]0.129924[/C][C]0.9001[/C][C]0.18627[/C][/ROW]
[ROW][C]9[/C][C]0.062307[/C][C]0.4317[/C][C]0.333956[/C][/ROW]
[ROW][C]10[/C][C]-0.045362[/C][C]-0.3143[/C][C]0.377337[/C][/ROW]
[ROW][C]11[/C][C]-0.047084[/C][C]-0.3262[/C][C]0.372842[/C][/ROW]
[ROW][C]12[/C][C]0.036529[/C][C]0.2531[/C][C]0.400643[/C][/ROW]
[ROW][C]13[/C][C]-0.114994[/C][C]-0.7967[/C][C]0.214773[/C][/ROW]
[ROW][C]14[/C][C]0.152139[/C][C]1.054[/C][C]0.148569[/C][/ROW]
[ROW][C]15[/C][C]-0.042109[/C][C]-0.2917[/C][C]0.38587[/C][/ROW]
[ROW][C]16[/C][C]-0.125792[/C][C]-0.8715[/C][C]0.193907[/C][/ROW]
[ROW][C]17[/C][C]0.143063[/C][C]0.9912[/C][C]0.163286[/C][/ROW]
[ROW][C]18[/C][C]0.063208[/C][C]0.4379[/C][C]0.331705[/C][/ROW]
[ROW][C]19[/C][C]-0.201352[/C][C]-1.395[/C][C]0.084717[/C][/ROW]
[ROW][C]20[/C][C]0.093294[/C][C]0.6464[/C][C]0.260562[/C][/ROW]
[ROW][C]21[/C][C]0.055541[/C][C]0.3848[/C][C]0.351042[/C][/ROW]
[ROW][C]22[/C][C]-0.173301[/C][C]-1.2007[/C][C]0.117887[/C][/ROW]
[ROW][C]23[/C][C]0.292573[/C][C]2.027[/C][C]0.024118[/C][/ROW]
[ROW][C]24[/C][C]-0.246378[/C][C]-1.707[/C][C]0.047146[/C][/ROW]
[ROW][C]25[/C][C]0.021844[/C][C]0.1513[/C][C]0.440171[/C][/ROW]
[ROW][C]26[/C][C]0.12051[/C][C]0.8349[/C][C]0.20395[/C][/ROW]
[ROW][C]27[/C][C]-0.008832[/C][C]-0.0612[/C][C]0.47573[/C][/ROW]
[ROW][C]28[/C][C]-0.084903[/C][C]-0.5882[/C][C]0.279569[/C][/ROW]
[ROW][C]29[/C][C]0.01274[/C][C]0.0883[/C][C]0.465017[/C][/ROW]
[ROW][C]30[/C][C]-0.000875[/C][C]-0.0061[/C][C]0.497593[/C][/ROW]
[ROW][C]31[/C][C]0.023984[/C][C]0.1662[/C][C]0.434362[/C][/ROW]
[ROW][C]32[/C][C]0.04939[/C][C]0.3422[/C][C]0.366853[/C][/ROW]
[ROW][C]33[/C][C]-0.088505[/C][C]-0.6132[/C][C]0.271325[/C][/ROW]
[ROW][C]34[/C][C]-0.028423[/C][C]-0.1969[/C][C]0.42236[/C][/ROW]
[ROW][C]35[/C][C]0.124208[/C][C]0.8605[/C][C]0.196885[/C][/ROW]
[ROW][C]36[/C][C]-0.137339[/C][C]-0.9515[/C][C]0.173056[/C][/ROW]
[/TABLE]
Source: https://freestatistics.org/blog/index.php?pk=61234&T=1

Globally Unique Identifier (entire table): ba.freestatistics.org/blog/index.php?pk=61234&T=1

As an alternative you can also use a QR Code:  

The GUIDs for individual cells are displayed in the table below:

Autocorrelation Function
Time lag kACF(k)T-STATP-value
1-0.561735-3.89180.000153
2-0.015808-0.10950.456622
30.2285971.58380.059907
4-0.268264-1.85860.034611
50.2176441.50790.06907
60.0320540.22210.412599
7-0.232704-1.61220.056735
80.1299240.90010.18627
90.0623070.43170.333956
10-0.045362-0.31430.377337
11-0.047084-0.32620.372842
120.0365290.25310.400643
13-0.114994-0.79670.214773
140.1521391.0540.148569
15-0.042109-0.29170.38587
16-0.125792-0.87150.193907
170.1430630.99120.163286
180.0632080.43790.331705
19-0.201352-1.3950.084717
200.0932940.64640.260562
210.0555410.38480.351042
22-0.173301-1.20070.117887
230.2925732.0270.024118
24-0.246378-1.7070.047146
250.0218440.15130.440171
260.120510.83490.20395
27-0.008832-0.06120.47573
28-0.084903-0.58820.279569
290.012740.08830.465017
30-0.000875-0.00610.497593
310.0239840.16620.434362
320.049390.34220.366853
33-0.088505-0.61320.271325
34-0.028423-0.19690.42236
350.1242080.86050.196885
36-0.137339-0.95150.173056


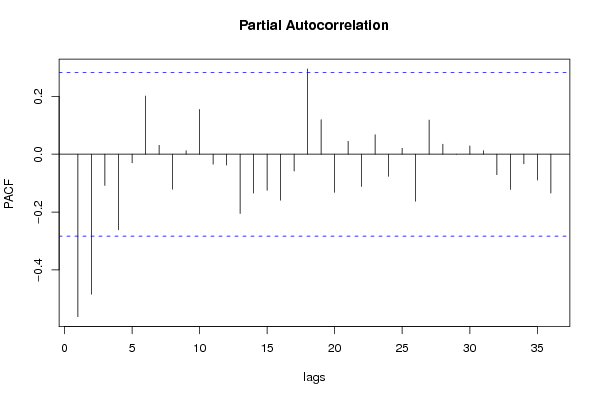
Partial Autocorrelation Function
Time lag kPACF(k)T-STATP-value
1-0.561735-3.89180.000153
2-0.484115-3.3540.000781
3-0.107865-0.74730.229262
4-0.261449-1.81140.038171
5-0.029585-0.2050.419232
60.2013161.39480.084755
70.0306690.21250.416316
8-0.12104-0.83860.202928
90.0121740.08430.466566
100.1547841.07240.144457
11-0.034506-0.23910.406037
12-0.037676-0.2610.397594
13-0.204612-1.41760.081384
14-0.134507-0.93190.178029
15-0.124675-0.86380.196003
16-0.159038-1.10180.138011
17-0.058327-0.40410.343967
180.2948682.04290.023287
190.1194820.82780.205941
20-0.131586-0.91170.183253
210.0446560.30940.379185
22-0.111839-0.77480.221116
230.0676020.46840.320824
24-0.0764-0.52930.299514
250.0204440.14160.443978
26-0.162433-1.12540.133014
270.118050.81790.208736
280.0347330.24060.405432
290.0001047e-040.499713
300.028580.1980.421939
310.0120220.08330.466985
32-0.070617-0.48930.313446
33-0.122014-0.84530.201058
34-0.033273-0.23050.409333
35-0.089264-0.61840.269605
36-0.134421-0.93130.17818

\begin{tabular}{lllllllll}
\hline
Partial Autocorrelation Function \tabularnewline
Time lag k & PACF(k) & T-STAT & P-value \tabularnewline
1 & -0.561735 & -3.8918 & 0.000153 \tabularnewline
2 & -0.484115 & -3.354 & 0.000781 \tabularnewline
3 & -0.107865 & -0.7473 & 0.229262 \tabularnewline
4 & -0.261449 & -1.8114 & 0.038171 \tabularnewline
5 & -0.029585 & -0.205 & 0.419232 \tabularnewline
6 & 0.201316 & 1.3948 & 0.084755 \tabularnewline
7 & 0.030669 & 0.2125 & 0.416316 \tabularnewline
8 & -0.12104 & -0.8386 & 0.202928 \tabularnewline
9 & 0.012174 & 0.0843 & 0.466566 \tabularnewline
10 & 0.154784 & 1.0724 & 0.144457 \tabularnewline
11 & -0.034506 & -0.2391 & 0.406037 \tabularnewline
12 & -0.037676 & -0.261 & 0.397594 \tabularnewline
13 & -0.204612 & -1.4176 & 0.081384 \tabularnewline
14 & -0.134507 & -0.9319 & 0.178029 \tabularnewline
15 & -0.124675 & -0.8638 & 0.196003 \tabularnewline
16 & -0.159038 & -1.1018 & 0.138011 \tabularnewline
17 & -0.058327 & -0.4041 & 0.343967 \tabularnewline
18 & 0.294868 & 2.0429 & 0.023287 \tabularnewline
19 & 0.119482 & 0.8278 & 0.205941 \tabularnewline
20 & -0.131586 & -0.9117 & 0.183253 \tabularnewline
21 & 0.044656 & 0.3094 & 0.379185 \tabularnewline
22 & -0.111839 & -0.7748 & 0.221116 \tabularnewline
23 & 0.067602 & 0.4684 & 0.320824 \tabularnewline
24 & -0.0764 & -0.5293 & 0.299514 \tabularnewline
25 & 0.020444 & 0.1416 & 0.443978 \tabularnewline
26 & -0.162433 & -1.1254 & 0.133014 \tabularnewline
27 & 0.11805 & 0.8179 & 0.208736 \tabularnewline
28 & 0.034733 & 0.2406 & 0.405432 \tabularnewline
29 & 0.000104 & 7e-04 & 0.499713 \tabularnewline
30 & 0.02858 & 0.198 & 0.421939 \tabularnewline
31 & 0.012022 & 0.0833 & 0.466985 \tabularnewline
32 & -0.070617 & -0.4893 & 0.313446 \tabularnewline
33 & -0.122014 & -0.8453 & 0.201058 \tabularnewline
34 & -0.033273 & -0.2305 & 0.409333 \tabularnewline
35 & -0.089264 & -0.6184 & 0.269605 \tabularnewline
36 & -0.134421 & -0.9313 & 0.17818 \tabularnewline
\hline
\end{tabular}
%Source: https://freestatistics.org/blog/index.php?pk=61234&T=2

[TABLE]
[ROW][C]Partial Autocorrelation Function[/C][/ROW]
[ROW][C]Time lag k[/C][C]PACF(k)[/C][C]T-STAT[/C][C]P-value[/C][/ROW]
[ROW][C]1[/C][C]-0.561735[/C][C]-3.8918[/C][C]0.000153[/C][/ROW]
[ROW][C]2[/C][C]-0.484115[/C][C]-3.354[/C][C]0.000781[/C][/ROW]
[ROW][C]3[/C][C]-0.107865[/C][C]-0.7473[/C][C]0.229262[/C][/ROW]
[ROW][C]4[/C][C]-0.261449[/C][C]-1.8114[/C][C]0.038171[/C][/ROW]
[ROW][C]5[/C][C]-0.029585[/C][C]-0.205[/C][C]0.419232[/C][/ROW]
[ROW][C]6[/C][C]0.201316[/C][C]1.3948[/C][C]0.084755[/C][/ROW]
[ROW][C]7[/C][C]0.030669[/C][C]0.2125[/C][C]0.416316[/C][/ROW]
[ROW][C]8[/C][C]-0.12104[/C][C]-0.8386[/C][C]0.202928[/C][/ROW]
[ROW][C]9[/C][C]0.012174[/C][C]0.0843[/C][C]0.466566[/C][/ROW]
[ROW][C]10[/C][C]0.154784[/C][C]1.0724[/C][C]0.144457[/C][/ROW]
[ROW][C]11[/C][C]-0.034506[/C][C]-0.2391[/C][C]0.406037[/C][/ROW]
[ROW][C]12[/C][C]-0.037676[/C][C]-0.261[/C][C]0.397594[/C][/ROW]
[ROW][C]13[/C][C]-0.204612[/C][C]-1.4176[/C][C]0.081384[/C][/ROW]
[ROW][C]14[/C][C]-0.134507[/C][C]-0.9319[/C][C]0.178029[/C][/ROW]
[ROW][C]15[/C][C]-0.124675[/C][C]-0.8638[/C][C]0.196003[/C][/ROW]
[ROW][C]16[/C][C]-0.159038[/C][C]-1.1018[/C][C]0.138011[/C][/ROW]
[ROW][C]17[/C][C]-0.058327[/C][C]-0.4041[/C][C]0.343967[/C][/ROW]
[ROW][C]18[/C][C]0.294868[/C][C]2.0429[/C][C]0.023287[/C][/ROW]
[ROW][C]19[/C][C]0.119482[/C][C]0.8278[/C][C]0.205941[/C][/ROW]
[ROW][C]20[/C][C]-0.131586[/C][C]-0.9117[/C][C]0.183253[/C][/ROW]
[ROW][C]21[/C][C]0.044656[/C][C]0.3094[/C][C]0.379185[/C][/ROW]
[ROW][C]22[/C][C]-0.111839[/C][C]-0.7748[/C][C]0.221116[/C][/ROW]
[ROW][C]23[/C][C]0.067602[/C][C]0.4684[/C][C]0.320824[/C][/ROW]
[ROW][C]24[/C][C]-0.0764[/C][C]-0.5293[/C][C]0.299514[/C][/ROW]
[ROW][C]25[/C][C]0.020444[/C][C]0.1416[/C][C]0.443978[/C][/ROW]
[ROW][C]26[/C][C]-0.162433[/C][C]-1.1254[/C][C]0.133014[/C][/ROW]
[ROW][C]27[/C][C]0.11805[/C][C]0.8179[/C][C]0.208736[/C][/ROW]
[ROW][C]28[/C][C]0.034733[/C][C]0.2406[/C][C]0.405432[/C][/ROW]
[ROW][C]29[/C][C]0.000104[/C][C]7e-04[/C][C]0.499713[/C][/ROW]
[ROW][C]30[/C][C]0.02858[/C][C]0.198[/C][C]0.421939[/C][/ROW]
[ROW][C]31[/C][C]0.012022[/C][C]0.0833[/C][C]0.466985[/C][/ROW]
[ROW][C]32[/C][C]-0.070617[/C][C]-0.4893[/C][C]0.313446[/C][/ROW]
[ROW][C]33[/C][C]-0.122014[/C][C]-0.8453[/C][C]0.201058[/C][/ROW]
[ROW][C]34[/C][C]-0.033273[/C][C]-0.2305[/C][C]0.409333[/C][/ROW]
[ROW][C]35[/C][C]-0.089264[/C][C]-0.6184[/C][C]0.269605[/C][/ROW]
[ROW][C]36[/C][C]-0.134421[/C][C]-0.9313[/C][C]0.17818[/C][/ROW]
[/TABLE]
Source: https://freestatistics.org/blog/index.php?pk=61234&T=2

Globally Unique Identifier (entire table): ba.freestatistics.org/blog/index.php?pk=61234&T=2

As an alternative you can also use a QR Code:  

The GUIDs for individual cells are displayed in the table below:

Partial Autocorrelation Function
Time lag kPACF(k)T-STATP-value
1-0.561735-3.89180.000153
2-0.484115-3.3540.000781
3-0.107865-0.74730.229262
4-0.261449-1.81140.038171
5-0.029585-0.2050.419232
60.2013161.39480.084755
70.0306690.21250.416316
8-0.12104-0.83860.202928
90.0121740.08430.466566
100.1547841.07240.144457
11-0.034506-0.23910.406037
12-0.037676-0.2610.397594
13-0.204612-1.41760.081384
14-0.134507-0.93190.178029
15-0.124675-0.86380.196003
16-0.159038-1.10180.138011
17-0.058327-0.40410.343967
180.2948682.04290.023287
190.1194820.82780.205941
20-0.131586-0.91170.183253
210.0446560.30940.379185
22-0.111839-0.77480.221116
230.0676020.46840.320824
24-0.0764-0.52930.299514
250.0204440.14160.443978
26-0.162433-1.12540.133014
270.118050.81790.208736
280.0347330.24060.405432
290.0001047e-040.499713
300.028580.1980.421939
310.0120220.08330.466985
32-0.070617-0.48930.313446
33-0.122014-0.84530.201058
34-0.033273-0.23050.409333
35-0.089264-0.61840.269605
36-0.134421-0.93130.17818


Parameters (Session):
par1 = 36 ; par2 = 1 ; par3 = 1 ; par4 = 1 ; par5 = 12 ; par6 = MA ; par7 = 0.95 ;
Parameters (R input):
par1 = 36 ; par2 = 1 ; par3 = 1 ; par4 = 1 ; par5 = 12 ; par6 = MA ; par7 = 0.95 ;
R code (references can be found in the software module):
if (par1 == 'Default') {
par1 = 10*log10(length(x))
} else {
par1 <- as.numeric(par1)
}
par2 <- as.numeric(par2)
par3 <- as.numeric(par3)
par4 <- as.numeric(par4)
par5 <- as.numeric(par5)
if (par6 == 'White Noise') par6 <- 'white' else par6 <- 'ma'
par7 <- as.numeric(par7)
if (par2 == 0) {
x <- log(x)
} else {
x <- (x ^ par2 - 1) / par2
}
if (par3 > 0) x <- diff(x,lag=1,difference=par3)
if (par4 > 0) x <- diff(x,lag=par5,difference=par4)
bitmap(file='pic1.png')
racf <- acf(x, par1, main='Autocorrelation', xlab='time lag', ylab='ACF', ci.type=par6, ci=par7, sub=paste('(lambda=',par2,', d=',par3,', D=',par4,', CI=', par7, ', CI type=',par6,')',sep=''))
dev.off()
bitmap(file='pic2.png')
rpacf <- pacf(x,par1,main='Partial Autocorrelation',xlab='lags',ylab='PACF')
dev.off()
(myacf <- c(racf$acf))
(mypacf <- c(rpacf$acf))
lengthx <- length(x)
sqrtn <- sqrt(lengthx)
load(file='createtable')
a<-table.start()
a<-table.row.start(a)
a<-table.element(a,'Autocorrelation Function',4,TRUE)
a<-table.row.end(a)
a<-table.row.start(a)
a<-table.element(a,'Time lag k',header=TRUE)
a<-table.element(a,hyperlink('basics.htm','ACF(k)','click here for more information about the Autocorrelation Function'),header=TRUE)
a<-table.element(a,'T-STAT',header=TRUE)
a<-table.element(a,'P-value',header=TRUE)
a<-table.row.end(a)
for (i in 2:(par1+1)) {
a<-table.row.start(a)
a<-table.element(a,i-1,header=TRUE)
a<-table.element(a,round(myacf[i],6))
mytstat <- myacf[i]*sqrtn
a<-table.element(a,round(mytstat,4))
a<-table.element(a,round(1-pt(abs(mytstat),lengthx),6))
a<-table.row.end(a)
}
a<-table.end(a)
table.save(a,file='mytable.tab')
a<-table.start()
a<-table.row.start(a)
a<-table.element(a,'Partial Autocorrelation Function',4,TRUE)
a<-table.row.end(a)
a<-table.row.start(a)
a<-table.element(a,'Time lag k',header=TRUE)
a<-table.element(a,hyperlink('basics.htm','PACF(k)','click here for more information about the Partial Autocorrelation Function'),header=TRUE)
a<-table.element(a,'T-STAT',header=TRUE)
a<-table.element(a,'P-value',header=TRUE)
a<-table.row.end(a)
for (i in 1:par1) {
a<-table.row.start(a)
a<-table.element(a,i,header=TRUE)
a<-table.element(a,round(mypacf[i],6))
mytstat <- mypacf[i]*sqrtn
a<-table.element(a,round(mytstat,4))
a<-table.element(a,round(1-pt(abs(mytstat),lengthx),6))
a<-table.row.end(a)
}
a<-table.end(a)
table.save(a,file='mytable1.tab')