Free Statistics

of Irreproducible Research!

Author's title

Author*The author of this computation has been verified*
R Software Modulerwasp_smp.wasp
Title produced by softwareStandard Deviation-Mean Plot
Date of computationFri, 27 Nov 2009 13:30:45 -0700
Cite this page as followsStatistical Computations at FreeStatistics.org, Office for Research Development and Education, URL https://freestatistics.org/blog/index.php?v=date/2009/Nov/27/t1259353964gn790iw1plplfvj.htm/, Retrieved Mon, 29 Apr 2024 02:10:47 +0000
Statistical Computations at FreeStatistics.org, Office for Research Development and Education, URL https://freestatistics.org/blog/index.php?pk=61261, Retrieved Mon, 29 Apr 2024 02:10:47 +0000
QR Codes:

Original text written by user:
IsPrivate?No (this computation is public)
User-defined keywords
Estimated Impact101
Family? (F = Feedback message, R = changed R code, M = changed R Module, P = changed Parameters, D = changed Data)
-     [Univariate Explorative Data Analysis] [Run Sequence gebo...] [2008-12-12 13:32:37] [76963dc1903f0f612b6153510a3818cf]
- R  D  [Univariate Explorative Data Analysis] [Run Sequence gebo...] [2008-12-17 12:14:40] [76963dc1903f0f612b6153510a3818cf]
-         [Univariate Explorative Data Analysis] [Run Sequence Plot...] [2008-12-22 18:19:51] [1ce0d16c8f4225c977b42c8fa93bc163]
- RMP       [Standard Deviation-Mean Plot] [Identifying Integ...] [2009-11-22 12:50:05] [b98453cac15ba1066b407e146608df68]
-   PD          [Standard Deviation-Mean Plot] [] [2009-11-27 20:30:45] [c88a5f1b97e332c6387d668c465455af] [Current]
Feedback Forum

Post a new message
Dataseries X:
1258
1199
1158
1427
934
709
1186
986
1033
1257
1105
1179
1092
1092
1087
2028
2039
2010
754
760
715
855
971
815
915
843
761
1858
2968
4061
3661
3269
2857
2568
2274
1987
683
381
71
1772
3485
5181
4479
3782
3067
2489
1903
1330
736
483
242
1334
2423
3523
2986
2462
1908
1575
1237
904


Summary of computational transaction
Raw Inputview raw input (R code)
Raw Outputview raw output of R engine
Computing time1 seconds
R Server'Gwilym Jenkins' @ 72.249.127.135

\begin{tabular}{lllllllll}
\hline
Summary of computational transaction \tabularnewline
Raw Input & view raw input (R code)  \tabularnewline
Raw Output & view raw output of R engine  \tabularnewline
Computing time & 1 seconds \tabularnewline
R Server & 'Gwilym Jenkins' @ 72.249.127.135 \tabularnewline
\hline
\end{tabular}
%Source: https://freestatistics.org/blog/index.php?pk=61261&T=0

[TABLE]
[ROW][C]Summary of computational transaction[/C][/ROW]
[ROW][C]Raw Input[/C][C]view raw input (R code) [/C][/ROW]
[ROW][C]Raw Output[/C][C]view raw output of R engine [/C][/ROW]
[ROW][C]Computing time[/C][C]1 seconds[/C][/ROW]
[ROW][C]R Server[/C][C]'Gwilym Jenkins' @ 72.249.127.135[/C][/ROW]
[/TABLE]
Source: https://freestatistics.org/blog/index.php?pk=61261&T=0

Globally Unique Identifier (entire table): ba.freestatistics.org/blog/index.php?pk=61261&T=0

As an alternative you can also use a QR Code:  

The GUIDs for individual cells are displayed in the table below:

Summary of computational transaction
Raw Inputview raw input (R code)
Raw Outputview raw output of R engine
Computing time1 seconds
R Server'Gwilym Jenkins' @ 72.249.127.135


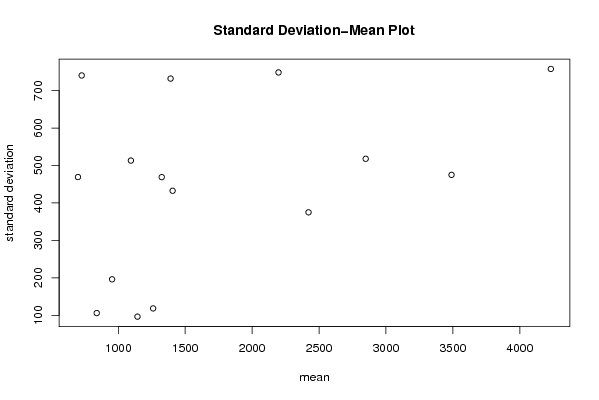
Standard Deviation-Mean Plot
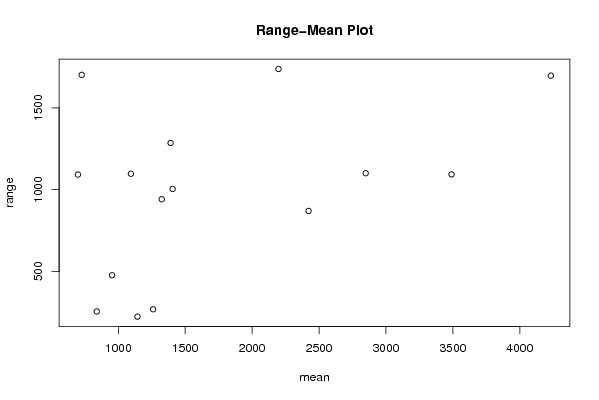
SectionMeanStandard DeviationRange
11260.5118.345539276589269
2953.75196.021044788563477
31143.596.3241056710797224
41324.75468.839258168511941
51390.75731.8913284543461285
6839105.880435712490256
71094.25513.0389036580621097
83489.75474.9058678657631093
92421.5374.908433265155870
10726.75740.2730915006971701
114231.75757.6539997474661696
122197.25748.3957843280521737
13698.75469.0766639544831092
142848.5517.7801978961091100
151406432.4850671795891004

\begin{tabular}{lllllllll}
\hline
Standard Deviation-Mean Plot \tabularnewline
Section & Mean & Standard Deviation & Range \tabularnewline
1 & 1260.5 & 118.345539276589 & 269 \tabularnewline
2 & 953.75 & 196.021044788563 & 477 \tabularnewline
3 & 1143.5 & 96.3241056710797 & 224 \tabularnewline
4 & 1324.75 & 468.839258168511 & 941 \tabularnewline
5 & 1390.75 & 731.891328454346 & 1285 \tabularnewline
6 & 839 & 105.880435712490 & 256 \tabularnewline
7 & 1094.25 & 513.038903658062 & 1097 \tabularnewline
8 & 3489.75 & 474.905867865763 & 1093 \tabularnewline
9 & 2421.5 & 374.908433265155 & 870 \tabularnewline
10 & 726.75 & 740.273091500697 & 1701 \tabularnewline
11 & 4231.75 & 757.653999747466 & 1696 \tabularnewline
12 & 2197.25 & 748.395784328052 & 1737 \tabularnewline
13 & 698.75 & 469.076663954483 & 1092 \tabularnewline
14 & 2848.5 & 517.780197896109 & 1100 \tabularnewline
15 & 1406 & 432.485067179589 & 1004 \tabularnewline
\hline
\end{tabular}
%Source: https://freestatistics.org/blog/index.php?pk=61261&T=1

[TABLE]
[ROW][C]Standard Deviation-Mean Plot[/C][/ROW]
[ROW][C]Section[/C][C]Mean[/C][C]Standard Deviation[/C][C]Range[/C][/ROW]
[ROW][C]1[/C][C]1260.5[/C][C]118.345539276589[/C][C]269[/C][/ROW]
[ROW][C]2[/C][C]953.75[/C][C]196.021044788563[/C][C]477[/C][/ROW]
[ROW][C]3[/C][C]1143.5[/C][C]96.3241056710797[/C][C]224[/C][/ROW]
[ROW][C]4[/C][C]1324.75[/C][C]468.839258168511[/C][C]941[/C][/ROW]
[ROW][C]5[/C][C]1390.75[/C][C]731.891328454346[/C][C]1285[/C][/ROW]
[ROW][C]6[/C][C]839[/C][C]105.880435712490[/C][C]256[/C][/ROW]
[ROW][C]7[/C][C]1094.25[/C][C]513.038903658062[/C][C]1097[/C][/ROW]
[ROW][C]8[/C][C]3489.75[/C][C]474.905867865763[/C][C]1093[/C][/ROW]
[ROW][C]9[/C][C]2421.5[/C][C]374.908433265155[/C][C]870[/C][/ROW]
[ROW][C]10[/C][C]726.75[/C][C]740.273091500697[/C][C]1701[/C][/ROW]
[ROW][C]11[/C][C]4231.75[/C][C]757.653999747466[/C][C]1696[/C][/ROW]
[ROW][C]12[/C][C]2197.25[/C][C]748.395784328052[/C][C]1737[/C][/ROW]
[ROW][C]13[/C][C]698.75[/C][C]469.076663954483[/C][C]1092[/C][/ROW]
[ROW][C]14[/C][C]2848.5[/C][C]517.780197896109[/C][C]1100[/C][/ROW]
[ROW][C]15[/C][C]1406[/C][C]432.485067179589[/C][C]1004[/C][/ROW]
[/TABLE]
Source: https://freestatistics.org/blog/index.php?pk=61261&T=1

Globally Unique Identifier (entire table): ba.freestatistics.org/blog/index.php?pk=61261&T=1

As an alternative you can also use a QR Code:  

The GUIDs for individual cells are displayed in the table below:

Standard Deviation-Mean Plot
SectionMeanStandard DeviationRange
11260.5118.345539276589269
2953.75196.021044788563477
31143.596.3241056710797224
41324.75468.839258168511941
51390.75731.8913284543461285
6839105.880435712490256
71094.25513.0389036580621097
83489.75474.9058678657631093
92421.5374.908433265155870
10726.75740.2730915006971701
114231.75757.6539997474661696
122197.25748.3957843280521737
13698.75469.0766639544831092
142848.5517.7801978961091100
151406432.4850671795891004


Regression: S.E.(k) = alpha + beta * Mean(k)
alpha299.565486290228
beta0.086539326927624
S.D.0.0561392007213232
T-STAT1.54151334211558
p-value0.147175121745445

\begin{tabular}{lllllllll}
\hline
Regression: S.E.(k) = alpha + beta * Mean(k) \tabularnewline
alpha & 299.565486290228 \tabularnewline
beta & 0.086539326927624 \tabularnewline
S.D. & 0.0561392007213232 \tabularnewline
T-STAT & 1.54151334211558 \tabularnewline
p-value & 0.147175121745445 \tabularnewline
\hline
\end{tabular}
%Source: https://freestatistics.org/blog/index.php?pk=61261&T=2

[TABLE]
[ROW][C]Regression: S.E.(k) = alpha + beta * Mean(k)[/C][/ROW]
[ROW][C]alpha[/C][C]299.565486290228[/C][/ROW]
[ROW][C]beta[/C][C]0.086539326927624[/C][/ROW]
[ROW][C]S.D.[/C][C]0.0561392007213232[/C][/ROW]
[ROW][C]T-STAT[/C][C]1.54151334211558[/C][/ROW]
[ROW][C]p-value[/C][C]0.147175121745445[/C][/ROW]
[/TABLE]
Source: https://freestatistics.org/blog/index.php?pk=61261&T=2

Globally Unique Identifier (entire table): ba.freestatistics.org/blog/index.php?pk=61261&T=2

As an alternative you can also use a QR Code:  

The GUIDs for individual cells are displayed in the table below:

Regression: S.E.(k) = alpha + beta * Mean(k)
alpha299.565486290228
beta0.086539326927624
S.D.0.0561392007213232
T-STAT1.54151334211558
p-value0.147175121745445


Regression: ln S.E.(k) = alpha + beta * ln Mean(k)
alpha2.39527360245538
beta0.481620183870253
S.D.0.333053496498081
T-STAT1.44607454638456
p-value0.171832420220575
Lambda0.518379816129747

\begin{tabular}{lllllllll}
\hline
Regression: ln S.E.(k) = alpha + beta * ln Mean(k) \tabularnewline
alpha & 2.39527360245538 \tabularnewline
beta & 0.481620183870253 \tabularnewline
S.D. & 0.333053496498081 \tabularnewline
T-STAT & 1.44607454638456 \tabularnewline
p-value & 0.171832420220575 \tabularnewline
Lambda & 0.518379816129747 \tabularnewline
\hline
\end{tabular}
%Source: https://freestatistics.org/blog/index.php?pk=61261&T=3

[TABLE]
[ROW][C]Regression: ln S.E.(k) = alpha + beta * ln Mean(k)[/C][/ROW]
[ROW][C]alpha[/C][C]2.39527360245538[/C][/ROW]
[ROW][C]beta[/C][C]0.481620183870253[/C][/ROW]
[ROW][C]S.D.[/C][C]0.333053496498081[/C][/ROW]
[ROW][C]T-STAT[/C][C]1.44607454638456[/C][/ROW]
[ROW][C]p-value[/C][C]0.171832420220575[/C][/ROW]
[ROW][C]Lambda[/C][C]0.518379816129747[/C][/ROW]
[/TABLE]
Source: https://freestatistics.org/blog/index.php?pk=61261&T=3

Globally Unique Identifier (entire table): ba.freestatistics.org/blog/index.php?pk=61261&T=3

As an alternative you can also use a QR Code:  

The GUIDs for individual cells are displayed in the table below:

Regression: ln S.E.(k) = alpha + beta * ln Mean(k)
alpha2.39527360245538
beta0.481620183870253
S.D.0.333053496498081
T-STAT1.44607454638456
p-value0.171832420220575
Lambda0.518379816129747


Parameters (Session):
par1 = 4 ;
Parameters (R input):
par1 = 4 ;
R code (references can be found in the software module):
par1 <- as.numeric(par1)
(n <- length(x))
(np <- floor(n / par1))
arr <- array(NA,dim=c(par1,np))
j <- 0
k <- 1
for (i in 1:(np*par1))
{
j = j + 1
arr[j,k] <- x[i]
if (j == par1) {
j = 0
k=k+1
}
}
arr
arr.mean <- array(NA,dim=np)
arr.sd <- array(NA,dim=np)
arr.range <- array(NA,dim=np)
for (j in 1:np)
{
arr.mean[j] <- mean(arr[,j],na.rm=TRUE)
arr.sd[j] <- sd(arr[,j],na.rm=TRUE)
arr.range[j] <- max(arr[,j],na.rm=TRUE) - min(arr[,j],na.rm=TRUE)
}
arr.mean
arr.sd
arr.range
(lm1 <- lm(arr.sd~arr.mean))
(lnlm1 <- lm(log(arr.sd)~log(arr.mean)))
(lm2 <- lm(arr.range~arr.mean))
bitmap(file='test1.png')
plot(arr.mean,arr.sd,main='Standard Deviation-Mean Plot',xlab='mean',ylab='standard deviation')
dev.off()
bitmap(file='test2.png')
plot(arr.mean,arr.range,main='Range-Mean Plot',xlab='mean',ylab='range')
dev.off()
load(file='createtable')
a<-table.start()
a<-table.row.start(a)
a<-table.element(a,'Standard Deviation-Mean Plot',4,TRUE)
a<-table.row.end(a)
a<-table.row.start(a)
a<-table.element(a,'Section',header=TRUE)
a<-table.element(a,'Mean',header=TRUE)
a<-table.element(a,'Standard Deviation',header=TRUE)
a<-table.element(a,'Range',header=TRUE)
a<-table.row.end(a)
for (j in 1:np) {
a<-table.row.start(a)
a<-table.element(a,j,header=TRUE)
a<-table.element(a,arr.mean[j])
a<-table.element(a,arr.sd[j] )
a<-table.element(a,arr.range[j] )
a<-table.row.end(a)
}
a<-table.end(a)
table.save(a,file='mytable.tab')
a<-table.start()
a<-table.row.start(a)
a<-table.element(a,'Regression: S.E.(k) = alpha + beta * Mean(k)',2,TRUE)
a<-table.row.end(a)
a<-table.row.start(a)
a<-table.element(a,'alpha',header=TRUE)
a<-table.element(a,lm1$coefficients[[1]])
a<-table.row.end(a)
a<-table.row.start(a)
a<-table.element(a,'beta',header=TRUE)
a<-table.element(a,lm1$coefficients[[2]])
a<-table.row.end(a)
a<-table.row.start(a)
a<-table.element(a,'S.D.',header=TRUE)
a<-table.element(a,summary(lm1)$coefficients[2,2])
a<-table.row.end(a)
a<-table.row.start(a)
a<-table.element(a,'T-STAT',header=TRUE)
a<-table.element(a,summary(lm1)$coefficients[2,3])
a<-table.row.end(a)
a<-table.row.start(a)
a<-table.element(a,'p-value',header=TRUE)
a<-table.element(a,summary(lm1)$coefficients[2,4])
a<-table.row.end(a)
a<-table.end(a)
table.save(a,file='mytable1.tab')
a<-table.start()
a<-table.row.start(a)
a<-table.element(a,'Regression: ln S.E.(k) = alpha + beta * ln Mean(k)',2,TRUE)
a<-table.row.end(a)
a<-table.row.start(a)
a<-table.element(a,'alpha',header=TRUE)
a<-table.element(a,lnlm1$coefficients[[1]])
a<-table.row.end(a)
a<-table.row.start(a)
a<-table.element(a,'beta',header=TRUE)
a<-table.element(a,lnlm1$coefficients[[2]])
a<-table.row.end(a)
a<-table.row.start(a)
a<-table.element(a,'S.D.',header=TRUE)
a<-table.element(a,summary(lnlm1)$coefficients[2,2])
a<-table.row.end(a)
a<-table.row.start(a)
a<-table.element(a,'T-STAT',header=TRUE)
a<-table.element(a,summary(lnlm1)$coefficients[2,3])
a<-table.row.end(a)
a<-table.row.start(a)
a<-table.element(a,'p-value',header=TRUE)
a<-table.element(a,summary(lnlm1)$coefficients[2,4])
a<-table.row.end(a)
a<-table.row.start(a)
a<-table.element(a,'Lambda',header=TRUE)
a<-table.element(a,1-lnlm1$coefficients[[2]])
a<-table.row.end(a)
a<-table.end(a)
table.save(a,file='mytable2.tab')