Free Statistics
of Irreproducible Research!
Description of Statistical Computation | |||||||||||||||||||||||||||||||||||||||||
|---|---|---|---|---|---|---|---|---|---|---|---|---|---|---|---|---|---|---|---|---|---|---|---|---|---|---|---|---|---|---|---|---|---|---|---|---|---|---|---|---|---|
| Author's title | |||||||||||||||||||||||||||||||||||||||||
| Author | *The author of this computation has been verified* | ||||||||||||||||||||||||||||||||||||||||
| R Software Module | rwasp_univariatedataseries.wasp | ||||||||||||||||||||||||||||||||||||||||
| Title produced by software | Univariate Data Series | ||||||||||||||||||||||||||||||||||||||||
| Date of computation | Sun, 25 Oct 2009 06:42:43 -0600 | ||||||||||||||||||||||||||||||||||||||||
| Cite this page as follows | Statistical Computations at FreeStatistics.org, Office for Research Development and Education, URL https://freestatistics.org/blog/index.php?v=date/2009/Oct/25/t1256474641pe0r0u431tembro.htm/, Retrieved Mon, 29 Apr 2024 08:53:34 +0000 | ||||||||||||||||||||||||||||||||||||||||
| Statistical Computations at FreeStatistics.org, Office for Research Development and Education, URL https://freestatistics.org/blog/index.php?pk=50304, Retrieved Mon, 29 Apr 2024 08:53:34 +0000 | |||||||||||||||||||||||||||||||||||||||||
| QR Codes: | |||||||||||||||||||||||||||||||||||||||||
|
| |||||||||||||||||||||||||||||||||||||||||
| Original text written by user: | |||||||||||||||||||||||||||||||||||||||||
| IsPrivate? | No (this computation is public) | ||||||||||||||||||||||||||||||||||||||||
| User-defined keywords | |||||||||||||||||||||||||||||||||||||||||
| Estimated Impact | 210 | ||||||||||||||||||||||||||||||||||||||||
Tree of Dependent Computations | |||||||||||||||||||||||||||||||||||||||||
| Family? (F = Feedback message, R = changed R code, M = changed R Module, P = changed Parameters, D = changed Data) | |||||||||||||||||||||||||||||||||||||||||
| - [Univariate Data Series] [SHW WS4 - Part 2 ...] [2009-10-25 12:42:43] [b7e46d23597387652ca7420fdeb9acca] [Current] | |||||||||||||||||||||||||||||||||||||||||
| Feedback Forum | |||||||||||||||||||||||||||||||||||||||||
Post a new message | |||||||||||||||||||||||||||||||||||||||||
Dataset | |||||||||||||||||||||||||||||||||||||||||
| Dataseries X: | |||||||||||||||||||||||||||||||||||||||||
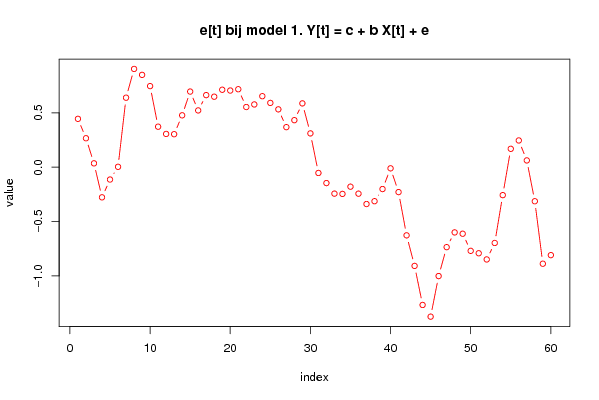
0.444543444 0.266277597 0.035445597 -0.277190709 -0.113543938 0.00344683 0.639022215 0.90344683 0.848897907 0.74574837 0.372225908 0.305818522 0.30344683 0.476969292 0.695553909 0.522031446 0.662739138 0.648120062 0.712155755 0.705040678 0.71689914 0.553252369 0.576969292 0.652863447 0.591199446 0.531907138 0.368260367 0.43229606 0.586844984 0.310950829 -0.053084863 -0.145969786 -0.243209172 -0.245580864 -0.179173479 -0.243598094 -0.33885471 -0.312766094 -0.200907632 -0.010394402 -0.228979018 -0.626607326 -0.907633787 -1.266926095 -1.374430094 -1.001296555 -0.735278092 -0.599702707 -0.611950091 -0.769259629 -0.791382704 -0.84830332 -0.696903933 -0.256974086 0.169114529 0.245786528 0.062388375 -0.313116857 -0.887844245 -0.808800554 | |||||||||||||||||||||||||||||||||||||||||
Tables (Output of Computation) | |||||||||||||||||||||||||||||||||||||||||
| |||||||||||||||||||||||||||||||||||||||||
Figures (Output of Computation) | |||||||||||||||||||||||||||||||||||||||||
Input Parameters & R Code | |||||||||||||||||||||||||||||||||||||||||
| Parameters (Session): | |||||||||||||||||||||||||||||||||||||||||
| par1 = e[t] bij model 1. Y[t] = c + b X[t] + e[t] ; | |||||||||||||||||||||||||||||||||||||||||
| Parameters (R input): | |||||||||||||||||||||||||||||||||||||||||
| par1 = e[t] bij model 1. Y[t] = c + b X[t] + e[t] ; par2 = ; par3 = ; | |||||||||||||||||||||||||||||||||||||||||
| R code (references can be found in the software module): | |||||||||||||||||||||||||||||||||||||||||
bitmap(file='test1.png') | |||||||||||||||||||||||||||||||||||||||||
