Free Statistics

of Irreproducible Research!

Author's title

Author*Unverified author*
R Software ModulePatrick.Wessarwasp_demand_forecasting_croston.wasp
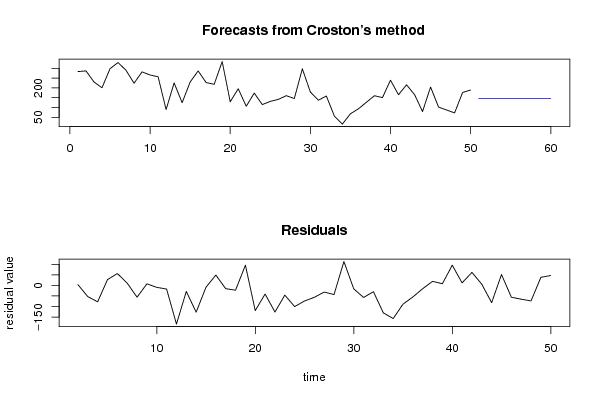
Title produced by softwareCroston Forecasting
Date of computationThu, 13 May 2010 11:30:54 +0000
Cite this page as followsStatistical Computations at FreeStatistics.org, Office for Research Development and Education, URL https://freestatistics.org/blog/index.php?v=date/2010/May/13/t1273750291zx6vjbwagcm67d2.htm/, Retrieved Mon, 06 May 2024 05:34:30 +0000
Statistical Computations at FreeStatistics.org, Office for Research Development and Education, URL https://freestatistics.org/blog/index.php?pk=75868, Retrieved Mon, 06 May 2024 05:34:30 +0000
QR Codes:

Original text written by user:
IsPrivate?No (this computation is public)
User-defined keywordsB382,steven,coomans,thesis,croston
Estimated Impact158
Family? (F = Feedback message, R = changed R code, M = changed R Module, P = changed Parameters, D = changed Data)
-       [Croston Forecasting] [B382,steven,cooma...] [2010-05-13 11:30:54] [d41d8cd98f00b204e9800998ecf8427e] [Current]
Feedback Forum

Post a new message
Dataseries X:
283,25
286,75
230,25
200,5
297,95
329,5
289,75
223,775
281,78
265,8
256,75
89,275
225,5
124,25
230
286,525
227
218,3
334,525
128,95
195,5
106,056
173,525
114,75
131,05
141,25
160,25
145,5
297,5
179,25
137
158,6
55,6
15,25
67,75
93
126,75
160
150,525
239,25
165,05
215,81
166
79,05
204,25
102
87,025
72,175
176,75
188,975


Summary of computational transaction
Raw Inputview raw input (R code)
Raw Outputview raw output of R engine
Computing time3 seconds
R Serverwessa.org @ wessa.org

\begin{tabular}{lllllllll}
\hline
Summary of computational transaction \tabularnewline
Raw Input & view raw input (R code)  \tabularnewline
Raw Output & view raw output of R engine  \tabularnewline
Computing time & 3 seconds \tabularnewline
R Server & wessa.org @ wessa.org \tabularnewline
\hline
\end{tabular}
%Source: https://freestatistics.org/blog/index.php?pk=75868&T=0

[TABLE]
[ROW][C]Summary of computational transaction[/C][/ROW]
[ROW][C]Raw Input[/C][C]view raw input (R code) [/C][/ROW]
[ROW][C]Raw Output[/C][C]view raw output of R engine [/C][/ROW]
[ROW][C]Computing time[/C][C]3 seconds[/C][/ROW]
[ROW][C]R Server[/C][C]wessa.org @ wessa.org[/C][/ROW]
[/TABLE]
Source: https://freestatistics.org/blog/index.php?pk=75868&T=0

Globally Unique Identifier (entire table): ba.freestatistics.org/blog/index.php?pk=75868&T=0

As an alternative you can also use a QR Code:  

The GUIDs for individual cells are displayed in the table below:

Summary of computational transaction
Raw Inputview raw input (R code)
Raw Outputview raw output of R engine
Computing time3 seconds
R Serverwessa.org @ wessa.org


Demand Forecast
PointForecast95% LB80% LB80% UB95% UB
51146.94517973955218.419656049532262.9068568945342230.98350258457275.470703429572
52146.94517973955217.778627017139462.4877105395489231.402648939555276.111732461965
53146.94517973955217.140763618259262.0706340810596231.819725398045276.749595860845
54146.94517973955216.506019411881761.6555971529222232.234762326182277.384340067222
55146.94517973955215.874349081523461.2425701242807232.647789354823278.016010397581
56146.94517973955215.245708397471360.8315240748805233.058835404224278.644651081633
57146.94517973955214.620054180641360.4224307714358233.467928707668279.270305298463
58146.94517973955213.997344267967760.015262645233.875096834104279.893015211136
59146.94517973955213.377537479244959.6099927692837234.280366709820280.512821999859
60146.94517973955212.760593585346959.2065948398754234.683764639229281.129765893757

\begin{tabular}{lllllllll}
\hline
Demand Forecast \tabularnewline
Point & Forecast & 95% LB & 80% LB & 80% UB & 95% UB \tabularnewline
51 & 146.945179739552 & 18.4196560495322 & 62.9068568945342 & 230.98350258457 & 275.470703429572 \tabularnewline
52 & 146.945179739552 & 17.7786270171394 & 62.4877105395489 & 231.402648939555 & 276.111732461965 \tabularnewline
53 & 146.945179739552 & 17.1407636182592 & 62.0706340810596 & 231.819725398045 & 276.749595860845 \tabularnewline
54 & 146.945179739552 & 16.5060194118817 & 61.6555971529222 & 232.234762326182 & 277.384340067222 \tabularnewline
55 & 146.945179739552 & 15.8743490815234 & 61.2425701242807 & 232.647789354823 & 278.016010397581 \tabularnewline
56 & 146.945179739552 & 15.2457083974713 & 60.8315240748805 & 233.058835404224 & 278.644651081633 \tabularnewline
57 & 146.945179739552 & 14.6200541806413 & 60.4224307714358 & 233.467928707668 & 279.270305298463 \tabularnewline
58 & 146.945179739552 & 13.9973442679677 & 60.015262645 & 233.875096834104 & 279.893015211136 \tabularnewline
59 & 146.945179739552 & 13.3775374792449 & 59.6099927692837 & 234.280366709820 & 280.512821999859 \tabularnewline
60 & 146.945179739552 & 12.7605935853469 & 59.2065948398754 & 234.683764639229 & 281.129765893757 \tabularnewline
\hline
\end{tabular}
%Source: https://freestatistics.org/blog/index.php?pk=75868&T=1

[TABLE]
[ROW][C]Demand Forecast[/C][/ROW]
[ROW][C]Point[/C][C]Forecast[/C][C]95% LB[/C][C]80% LB[/C][C]80% UB[/C][C]95% UB[/C][/ROW]
[ROW][C]51[/C][C]146.945179739552[/C][C]18.4196560495322[/C][C]62.9068568945342[/C][C]230.98350258457[/C][C]275.470703429572[/C][/ROW]
[ROW][C]52[/C][C]146.945179739552[/C][C]17.7786270171394[/C][C]62.4877105395489[/C][C]231.402648939555[/C][C]276.111732461965[/C][/ROW]
[ROW][C]53[/C][C]146.945179739552[/C][C]17.1407636182592[/C][C]62.0706340810596[/C][C]231.819725398045[/C][C]276.749595860845[/C][/ROW]
[ROW][C]54[/C][C]146.945179739552[/C][C]16.5060194118817[/C][C]61.6555971529222[/C][C]232.234762326182[/C][C]277.384340067222[/C][/ROW]
[ROW][C]55[/C][C]146.945179739552[/C][C]15.8743490815234[/C][C]61.2425701242807[/C][C]232.647789354823[/C][C]278.016010397581[/C][/ROW]
[ROW][C]56[/C][C]146.945179739552[/C][C]15.2457083974713[/C][C]60.8315240748805[/C][C]233.058835404224[/C][C]278.644651081633[/C][/ROW]
[ROW][C]57[/C][C]146.945179739552[/C][C]14.6200541806413[/C][C]60.4224307714358[/C][C]233.467928707668[/C][C]279.270305298463[/C][/ROW]
[ROW][C]58[/C][C]146.945179739552[/C][C]13.9973442679677[/C][C]60.015262645[/C][C]233.875096834104[/C][C]279.893015211136[/C][/ROW]
[ROW][C]59[/C][C]146.945179739552[/C][C]13.3775374792449[/C][C]59.6099927692837[/C][C]234.280366709820[/C][C]280.512821999859[/C][/ROW]
[ROW][C]60[/C][C]146.945179739552[/C][C]12.7605935853469[/C][C]59.2065948398754[/C][C]234.683764639229[/C][C]281.129765893757[/C][/ROW]
[/TABLE]
Source: https://freestatistics.org/blog/index.php?pk=75868&T=1

Globally Unique Identifier (entire table): ba.freestatistics.org/blog/index.php?pk=75868&T=1

As an alternative you can also use a QR Code:  

The GUIDs for individual cells are displayed in the table below:

Demand Forecast
PointForecast95% LB80% LB80% UB95% UB
51146.94517973955218.419656049532262.9068568945342230.98350258457275.470703429572
52146.94517973955217.778627017139462.4877105395489231.402648939555276.111732461965
53146.94517973955217.140763618259262.0706340810596231.819725398045276.749595860845
54146.94517973955216.506019411881761.6555971529222232.234762326182277.384340067222
55146.94517973955215.874349081523461.2425701242807232.647789354823278.016010397581
56146.94517973955215.245708397471360.8315240748805233.058835404224278.644651081633
57146.94517973955214.620054180641360.4224307714358233.467928707668279.270305298463
58146.94517973955213.997344267967760.015262645233.875096834104279.893015211136
59146.94517973955213.377537479244959.6099927692837234.280366709820280.512821999859
60146.94517973955212.760593585346959.2065948398754234.683764639229281.129765893757


Actuals and Interpolation
TimeActualForecast
1283.25NA
2286.75283.25
3230.25283.6
4200.5278.265
5297.95270.4885
6329.5273.23465
7289.75278.861185
8223.775279.9500665
9281.78274.33255985
10265.8275.077303865
11256.75274.1495734785
1289.275272.40961613065
13225.5254.096154517585
14124.25251.236539065827
15230238.537885159244
16286.525237.684096643320
17227242.568186978988
18218.3241.011368281089
19334.525238.74023145298
20128.95248.318708307682
21195.5236.381837476914
22106.056232.293653729222
23173.525219.669888356300
24114.75215.05539952067
25131.05205.024859568603
26141.25197.627373611743
27160.25191.989636250569
28145.5188.815672625512
29297.5184.484105362961
30179.25195.785694826665
31137194.132125343998
32158.6188.418912809598
3355.6185.437021528638
3415.25172.453319375775
3567.75156.732987438197
3693147.834688694377
37126.75142.351219824940
38160140.791097842446
39150.525142.711988058201
40239.25143.493289252381
41165.05153.068960327143
42215.81154.267064294429
43166160.421357864986
4479.05160.979222078487
45204.25152.786299870639
46102157.932669883575
4787.025152.339402895217
4872.175145.807962605696
49176.75138.444666345126
50188.975142.275199710613

\begin{tabular}{lllllllll}
\hline
Actuals and Interpolation \tabularnewline
Time & Actual & Forecast \tabularnewline
1 & 283.25 & NA \tabularnewline
2 & 286.75 & 283.25 \tabularnewline
3 & 230.25 & 283.6 \tabularnewline
4 & 200.5 & 278.265 \tabularnewline
5 & 297.95 & 270.4885 \tabularnewline
6 & 329.5 & 273.23465 \tabularnewline
7 & 289.75 & 278.861185 \tabularnewline
8 & 223.775 & 279.9500665 \tabularnewline
9 & 281.78 & 274.33255985 \tabularnewline
10 & 265.8 & 275.077303865 \tabularnewline
11 & 256.75 & 274.1495734785 \tabularnewline
12 & 89.275 & 272.40961613065 \tabularnewline
13 & 225.5 & 254.096154517585 \tabularnewline
14 & 124.25 & 251.236539065827 \tabularnewline
15 & 230 & 238.537885159244 \tabularnewline
16 & 286.525 & 237.684096643320 \tabularnewline
17 & 227 & 242.568186978988 \tabularnewline
18 & 218.3 & 241.011368281089 \tabularnewline
19 & 334.525 & 238.74023145298 \tabularnewline
20 & 128.95 & 248.318708307682 \tabularnewline
21 & 195.5 & 236.381837476914 \tabularnewline
22 & 106.056 & 232.293653729222 \tabularnewline
23 & 173.525 & 219.669888356300 \tabularnewline
24 & 114.75 & 215.05539952067 \tabularnewline
25 & 131.05 & 205.024859568603 \tabularnewline
26 & 141.25 & 197.627373611743 \tabularnewline
27 & 160.25 & 191.989636250569 \tabularnewline
28 & 145.5 & 188.815672625512 \tabularnewline
29 & 297.5 & 184.484105362961 \tabularnewline
30 & 179.25 & 195.785694826665 \tabularnewline
31 & 137 & 194.132125343998 \tabularnewline
32 & 158.6 & 188.418912809598 \tabularnewline
33 & 55.6 & 185.437021528638 \tabularnewline
34 & 15.25 & 172.453319375775 \tabularnewline
35 & 67.75 & 156.732987438197 \tabularnewline
36 & 93 & 147.834688694377 \tabularnewline
37 & 126.75 & 142.351219824940 \tabularnewline
38 & 160 & 140.791097842446 \tabularnewline
39 & 150.525 & 142.711988058201 \tabularnewline
40 & 239.25 & 143.493289252381 \tabularnewline
41 & 165.05 & 153.068960327143 \tabularnewline
42 & 215.81 & 154.267064294429 \tabularnewline
43 & 166 & 160.421357864986 \tabularnewline
44 & 79.05 & 160.979222078487 \tabularnewline
45 & 204.25 & 152.786299870639 \tabularnewline
46 & 102 & 157.932669883575 \tabularnewline
47 & 87.025 & 152.339402895217 \tabularnewline
48 & 72.175 & 145.807962605696 \tabularnewline
49 & 176.75 & 138.444666345126 \tabularnewline
50 & 188.975 & 142.275199710613 \tabularnewline
\hline
\end{tabular}
%Source: https://freestatistics.org/blog/index.php?pk=75868&T=2

[TABLE]
[ROW][C]Actuals and Interpolation[/C][/ROW]
[ROW][C]Time[/C][C]Actual[/C][C]Forecast[/C][/ROW]
[ROW][C]1[/C][C]283.25[/C][C]NA[/C][/ROW]
[ROW][C]2[/C][C]286.75[/C][C]283.25[/C][/ROW]
[ROW][C]3[/C][C]230.25[/C][C]283.6[/C][/ROW]
[ROW][C]4[/C][C]200.5[/C][C]278.265[/C][/ROW]
[ROW][C]5[/C][C]297.95[/C][C]270.4885[/C][/ROW]
[ROW][C]6[/C][C]329.5[/C][C]273.23465[/C][/ROW]
[ROW][C]7[/C][C]289.75[/C][C]278.861185[/C][/ROW]
[ROW][C]8[/C][C]223.775[/C][C]279.9500665[/C][/ROW]
[ROW][C]9[/C][C]281.78[/C][C]274.33255985[/C][/ROW]
[ROW][C]10[/C][C]265.8[/C][C]275.077303865[/C][/ROW]
[ROW][C]11[/C][C]256.75[/C][C]274.1495734785[/C][/ROW]
[ROW][C]12[/C][C]89.275[/C][C]272.40961613065[/C][/ROW]
[ROW][C]13[/C][C]225.5[/C][C]254.096154517585[/C][/ROW]
[ROW][C]14[/C][C]124.25[/C][C]251.236539065827[/C][/ROW]
[ROW][C]15[/C][C]230[/C][C]238.537885159244[/C][/ROW]
[ROW][C]16[/C][C]286.525[/C][C]237.684096643320[/C][/ROW]
[ROW][C]17[/C][C]227[/C][C]242.568186978988[/C][/ROW]
[ROW][C]18[/C][C]218.3[/C][C]241.011368281089[/C][/ROW]
[ROW][C]19[/C][C]334.525[/C][C]238.74023145298[/C][/ROW]
[ROW][C]20[/C][C]128.95[/C][C]248.318708307682[/C][/ROW]
[ROW][C]21[/C][C]195.5[/C][C]236.381837476914[/C][/ROW]
[ROW][C]22[/C][C]106.056[/C][C]232.293653729222[/C][/ROW]
[ROW][C]23[/C][C]173.525[/C][C]219.669888356300[/C][/ROW]
[ROW][C]24[/C][C]114.75[/C][C]215.05539952067[/C][/ROW]
[ROW][C]25[/C][C]131.05[/C][C]205.024859568603[/C][/ROW]
[ROW][C]26[/C][C]141.25[/C][C]197.627373611743[/C][/ROW]
[ROW][C]27[/C][C]160.25[/C][C]191.989636250569[/C][/ROW]
[ROW][C]28[/C][C]145.5[/C][C]188.815672625512[/C][/ROW]
[ROW][C]29[/C][C]297.5[/C][C]184.484105362961[/C][/ROW]
[ROW][C]30[/C][C]179.25[/C][C]195.785694826665[/C][/ROW]
[ROW][C]31[/C][C]137[/C][C]194.132125343998[/C][/ROW]
[ROW][C]32[/C][C]158.6[/C][C]188.418912809598[/C][/ROW]
[ROW][C]33[/C][C]55.6[/C][C]185.437021528638[/C][/ROW]
[ROW][C]34[/C][C]15.25[/C][C]172.453319375775[/C][/ROW]
[ROW][C]35[/C][C]67.75[/C][C]156.732987438197[/C][/ROW]
[ROW][C]36[/C][C]93[/C][C]147.834688694377[/C][/ROW]
[ROW][C]37[/C][C]126.75[/C][C]142.351219824940[/C][/ROW]
[ROW][C]38[/C][C]160[/C][C]140.791097842446[/C][/ROW]
[ROW][C]39[/C][C]150.525[/C][C]142.711988058201[/C][/ROW]
[ROW][C]40[/C][C]239.25[/C][C]143.493289252381[/C][/ROW]
[ROW][C]41[/C][C]165.05[/C][C]153.068960327143[/C][/ROW]
[ROW][C]42[/C][C]215.81[/C][C]154.267064294429[/C][/ROW]
[ROW][C]43[/C][C]166[/C][C]160.421357864986[/C][/ROW]
[ROW][C]44[/C][C]79.05[/C][C]160.979222078487[/C][/ROW]
[ROW][C]45[/C][C]204.25[/C][C]152.786299870639[/C][/ROW]
[ROW][C]46[/C][C]102[/C][C]157.932669883575[/C][/ROW]
[ROW][C]47[/C][C]87.025[/C][C]152.339402895217[/C][/ROW]
[ROW][C]48[/C][C]72.175[/C][C]145.807962605696[/C][/ROW]
[ROW][C]49[/C][C]176.75[/C][C]138.444666345126[/C][/ROW]
[ROW][C]50[/C][C]188.975[/C][C]142.275199710613[/C][/ROW]
[/TABLE]
Source: https://freestatistics.org/blog/index.php?pk=75868&T=2

Globally Unique Identifier (entire table): ba.freestatistics.org/blog/index.php?pk=75868&T=2

As an alternative you can also use a QR Code:  

The GUIDs for individual cells are displayed in the table below:

Actuals and Interpolation
TimeActualForecast
1283.25NA
2286.75283.25
3230.25283.6
4200.5278.265
5297.95270.4885
6329.5273.23465
7289.75278.861185
8223.775279.9500665
9281.78274.33255985
10265.8275.077303865
11256.75274.1495734785
1289.275272.40961613065
13225.5254.096154517585
14124.25251.236539065827
15230238.537885159244
16286.525237.684096643320
17227242.568186978988
18218.3241.011368281089
19334.525238.74023145298
20128.95248.318708307682
21195.5236.381837476914
22106.056232.293653729222
23173.525219.669888356300
24114.75215.05539952067
25131.05205.024859568603
26141.25197.627373611743
27160.25191.989636250569
28145.5188.815672625512
29297.5184.484105362961
30179.25195.785694826665
31137194.132125343998
32158.6188.418912809598
3355.6185.437021528638
3415.25172.453319375775
3567.75156.732987438197
3693147.834688694377
37126.75142.351219824940
38160140.791097842446
39150.525142.711988058201
40239.25143.493289252381
41165.05153.068960327143
42215.81154.267064294429
43166160.421357864986
4479.05160.979222078487
45204.25152.786299870639
46102157.932669883575
4787.025152.339402895217
4872.175145.807962605696
49176.75138.444666345126
50188.975142.275199710613


\begin{tabular}{lllllllll}
\hline
What is next? \tabularnewline
Simulate Time Series \tabularnewline
Generate Forecasts \tabularnewline
Forecast Analysis \tabularnewline
\hline
\end{tabular}
%Source: https://freestatistics.org/blog/index.php?pk=75868&T=3

[TABLE]
[ROW][C]What is next?[/C][/ROW]
[ROW][C]Simulate Time Series[/C][/ROW]
[ROW][C]Generate Forecasts[/C][/ROW]
[ROW][C]Forecast Analysis[/C][/ROW]
[/TABLE]
Source: https://freestatistics.org/blog/index.php?pk=75868&T=3

Globally Unique Identifier (entire table): ba.freestatistics.org/blog/index.php?pk=75868&T=3

As an alternative you can also use a QR Code:  

The GUIDs for individual cells are displayed in the table below:

What is next?
Simulate Time Series
Generate Forecasts
Forecast Analysis


Parameters (Session):
par1 = Input box ; par2 = Croston ; par3 = NA ; par4 = NA ; par5 = ZZZ ; par6 = 12 ; par7 = dum ; par8 = dumresult ; par9 = 3 ; par10 = 0.1 ;
Parameters (R input):
par1 = Input box ; par2 = Croston ; par3 = NA ; par4 = NA ; par5 = ZZZ ; par6 = 12 ; par7 = dum ; par8 = dumresult ; par9 = 3 ; par10 = 0.1 ;
R code (references can be found in the software module):
if(par3!='NA') par3 <- as.numeric(par3) else par3 <- NA
if(par4!='NA') par4 <- as.numeric(par4) else par4 <- NA
par6 <- as.numeric(par6) #Seasonal Period
par9 <- as.numeric(par9) #Forecast Horizon
par10 <- as.numeric(par10) #Alpha
library(forecast)
if (par1 == 'CSV') {
xarr <- read.csv(file=paste('tmp/',par7,'.csv',sep=''),header=T)
numseries <- length(xarr[1,])-1
n <- length(xarr[,1])
nmh <- n - par9
nmhp1 <- nmh + 1
rarr <- array(NA,dim=c(n,numseries))
farr <- array(NA,dim=c(n,numseries))
parr <- array(NA,dim=c(numseries,8))
colnames(parr) = list('ME','RMSE','MAE','MPE','MAPE','MASE','ACF1','TheilU')
for(i in 1:numseries) {
sindex <- i+1
x <- xarr[,sindex]
if(par2=='Croston') {
if (i==1) m <- croston(x,alpha=par10)
if (i==1) mydemand <- m$model$demand[]
fit <- croston(x[1:nmh],h=par9,alpha=par10)
}
if(par2=='ARIMA') {
m <- auto.arima(ts(x,freq=par6),d=par3,D=par4)
mydemand <- forecast(m)
fit <- auto.arima(ts(x[1:nmh],freq=par6),d=par3,D=par4)
}
if(par2=='ETS') {
m <- ets(ts(x,freq=par6),model=par5)
mydemand <- forecast(m)
fit <- ets(ts(x[1:nmh],freq=par6),model=par5)
}
try(rarr[,i] <- mydemand$resid,silent=T)
try(farr[,i] <- mydemand$mean,silent=T)
if (par2!='Croston') parr[i,] <- accuracy(forecast(fit,par9),x[nmhp1:n])
if (par2=='Croston') parr[i,] <- accuracy(fit,x[nmhp1:n])
}
write.csv(farr,file=paste('tmp/',par8,'_f.csv',sep=''))
write.csv(rarr,file=paste('tmp/',par8,'_r.csv',sep=''))
write.csv(parr,file=paste('tmp/',par8,'_p.csv',sep=''))
}
if (par1 == 'Input box') {
numseries <- 1
n <- length(x)
if(par2=='Croston') {
m <- croston(x)
mydemand <- m$model$demand[]
}
if(par2=='ARIMA') {
m <- auto.arima(ts(x,freq=par6),d=par3,D=par4)
mydemand <- forecast(m)
}
if(par2=='ETS') {
m <- ets(ts(x,freq=par6),model=par5)
mydemand <- forecast(m)
}
summary(m)
}
bitmap(file='test1.png')
op <- par(mfrow=c(2,1))
if (par2=='Croston') plot(m)
if ((par2=='ARIMA') | par2=='ETS') plot(forecast(m))
plot(mydemand$resid,type='l',main='Residuals', ylab='residual value', xlab='time')
par(op)
dev.off()
bitmap(file='pic2.png')
op <- par(mfrow=c(2,2))
acf(mydemand$resid, lag.max=n/3, main='Residual ACF', ylab='autocorrelation', xlab='time lag')
pacf(mydemand$resid,lag.max=n/3, main='Residual PACF', ylab='partial autocorrelation', xlab='time lag')
cpgram(mydemand$resid, main='Cumulative Periodogram of Residuals')
qqnorm(mydemand$resid); qqline(mydemand$resid, col=2)
par(op)
dev.off()
load(file='createtable')
a<-table.start()
a<-table.row.start(a)
a<-table.element(a,'Demand Forecast',6,TRUE)
a<-table.row.end(a)
a<-table.row.start(a)
a<-table.element(a,'Point',header=TRUE)
a<-table.element(a,'Forecast',header=TRUE)
a<-table.element(a,'95% LB',header=TRUE)
a<-table.element(a,'80% LB',header=TRUE)
a<-table.element(a,'80% UB',header=TRUE)
a<-table.element(a,'95% UB',header=TRUE)
a<-table.row.end(a)
for (i in 1:length(mydemand$mean)) {
a<-table.row.start(a)
a<-table.element(a,i+n,header=TRUE)
a<-table.element(a,as.numeric(mydemand$mean[i]))
a<-table.element(a,as.numeric(mydemand$lower[i,2]))
a<-table.element(a,as.numeric(mydemand$lower[i,1]))
a<-table.element(a,as.numeric(mydemand$upper[i,1]))
a<-table.element(a,as.numeric(mydemand$upper[i,2]))
a<-table.row.end(a)
}
a<-table.end(a)
table.save(a,file='mytable.tab')
a<-table.start()
a<-table.row.start(a)
a<-table.element(a,'Actuals and Interpolation',3,TRUE)
a<-table.row.end(a)
a<-table.row.start(a)
a<-table.element(a,'Time',header=TRUE)
a<-table.element(a,'Actual',header=TRUE)
a<-table.element(a,'Forecast',header=TRUE)
a<-table.row.end(a)
for (i in 1:n) {
a<-table.row.start(a)
a<-table.element(a,i,header=TRUE)
a<-table.element(a,x[i])
a<-table.element(a,x[i] - as.numeric(m$resid[i]))
a<-table.row.end(a)
}
a<-table.end(a)
table.save(a,file='mytable1.tab')
a<-table.start()
a<-table.row.start(a)
a<-table.element(a,'What is next?',1,TRUE)
a<-table.row.end(a)
a<-table.row.start(a)
a<-table.element(a,hyperlink(paste('https://automated.biganalytics.eu/Patrick.Wessa/rwasp_demand_forecasting_simulate.wasp',sep=''),'Simulate Time Series','',target=''))
a<-table.row.end(a)
a<-table.row.start(a)
a<-table.element(a,hyperlink(paste('https://automated.biganalytics.eu/Patrick.Wessa/rwasp_demand_forecasting_croston.wasp',sep=''),'Generate Forecasts','',target=''))
a<-table.row.end(a)
a<-table.row.start(a)
a<-table.element(a,hyperlink(paste('https://automated.biganalytics.eu/Patrick.Wessa/rwasp_demand_forecasting_analysis.wasp',sep=''),'Forecast Analysis','',target=''))
a<-table.row.end(a)
a<-table.end(a)
table.save(a,file='mytable0.tab')
-SERVER-wessa.org