Free Statistics

of Irreproducible Research!

Author's title

Author*Unverified author*
R Software ModulePatrick.Wessarwasp_demand_forecasting_croston.wasp
Title produced by softwareCroston Forecasting
Date of computationThu, 13 May 2010 14:03:44 +0000
Cite this page as followsStatistical Computations at FreeStatistics.org, Office for Research Development and Education, URL https://freestatistics.org/blog/index.php?v=date/2010/May/13/t12737594676c1vudubcjpuwtr.htm/, Retrieved Mon, 06 May 2024 06:34:50 +0000
Statistical Computations at FreeStatistics.org, Office for Research Development and Education, URL https://freestatistics.org/blog/index.php?pk=75949, Retrieved Mon, 06 May 2024 06:34:50 +0000
QR Codes:

Original text written by user:
IsPrivate?No (this computation is public)
User-defined keywordsB511,steven,coomans,thesis,ETS,per3maand
Estimated Impact99
Family? (F = Feedback message, R = changed R code, M = changed R Module, P = changed Parameters, D = changed Data)
-       [Croston Forecasting] [B511,steven,cooma...] [2010-05-13 14:03:44] [d41d8cd98f00b204e9800998ecf8427e] [Current]
Feedback Forum

Post a new message
Dataseries X:
66
58.66666667
66
51.33333333
73.16666667
65.83333333
65.16666667
80
88
86
94.67433333
66.16666667
94.83333333
72.33333333
86.33333333
64.33333333
62.66666667


Summary of computational transaction
Raw Inputview raw input (R code)
Raw Outputview raw output of R engine
Computing time4 seconds
R Serverwessa.org @ wessa.org

\begin{tabular}{lllllllll}
\hline
Summary of computational transaction \tabularnewline
Raw Input & view raw input (R code)  \tabularnewline
Raw Output & view raw output of R engine  \tabularnewline
Computing time & 4 seconds \tabularnewline
R Server & wessa.org @ wessa.org \tabularnewline
\hline
\end{tabular}
%Source: https://freestatistics.org/blog/index.php?pk=75949&T=0

[TABLE]
[ROW][C]Summary of computational transaction[/C][/ROW]
[ROW][C]Raw Input[/C][C]view raw input (R code) [/C][/ROW]
[ROW][C]Raw Output[/C][C]view raw output of R engine [/C][/ROW]
[ROW][C]Computing time[/C][C]4 seconds[/C][/ROW]
[ROW][C]R Server[/C][C]wessa.org @ wessa.org[/C][/ROW]
[/TABLE]
Source: https://freestatistics.org/blog/index.php?pk=75949&T=0

Globally Unique Identifier (entire table): ba.freestatistics.org/blog/index.php?pk=75949&T=0

As an alternative you can also use a QR Code:  

The GUIDs for individual cells are displayed in the table below:

Summary of computational transaction
Raw Inputview raw input (R code)
Raw Outputview raw output of R engine
Computing time4 seconds
R Serverwessa.org @ wessa.org


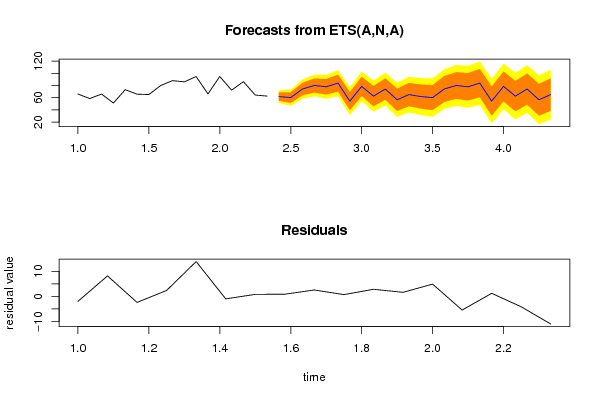
Demand Forecast
PointForecast95% LB80% LB80% UB95% UB
1861.902187939029751.381420750646755.023028032340668.781347845718872.4229551274127
1960.226480830898946.901562916925351.513785318071168.939176343726773.5513987448725
2074.379676433352358.745728352457664.157187246432284.602165620272590.0136245142471
2180.032590373769562.389256568105468.496234482321491.568946265217797.6759241794337
2277.913272412941458.467087106818565.198095287490190.628449538392897.3594577190643
2383.92253672446262.827015442871370.128916771416797.7161566775075105.018058006053
2454.443809958906231.818869885526439.65015681012369.237463107689477.068750032286
2578.584642102902354.52731871674862.854403847746994.3148803580576102.641965489056
2662.642292406484337.233205376683746.028183413179779.256401399788888.0513794362849
2774.219252685868647.526770619377356.765976783653191.672528588084100.911734752360
2856.66291281524928.745664746077138.408805468914274.917020161583784.5801608844208
2965.130324664709636.040126402448646.109266411054084.151382918365394.2205229269707
3061.902187939029731.684535314783242.143926903037381.66044897502292.1198405632762
3160.226480830898928.921953597579939.757550686803380.695410974994591.5310080642179
3274.379676433352342.024764588570753.223936708130895.5354161585738106.734588278134
3380.032590373769546.660338192270558.2116475573199101.853533190219113.404842555269
3477.913272412941443.553788848028155.4468136916338100.379731134249112.272755977855
3583.92253672446248.603405845722660.8285983519439107.016475096980119.241667603201
3654.443809958906218.190425272624830.738995856468778.148624061343690.6971946451876
3778.584642102902341.420481996780154.2843039631033102.884980242701115.748802209024
3862.642292406484324.589149414407337.760679601321987.5239052116466100.695435398561
3974.219252685868635.297426074602848.76963819245399.6688671792842113.141079297134
4056.66291281524916.891154900327030.657558113647182.668267516850896.434670730171
4165.130324664709624.526634896104538.580998962658891.6796503667605105.734014433315

\begin{tabular}{lllllllll}
\hline
Demand Forecast \tabularnewline
Point & Forecast & 95% LB & 80% LB & 80% UB & 95% UB \tabularnewline
18 & 61.9021879390297 & 51.3814207506467 & 55.0230280323406 & 68.7813478457188 & 72.4229551274127 \tabularnewline
19 & 60.2264808308989 & 46.9015629169253 & 51.5137853180711 & 68.9391763437267 & 73.5513987448725 \tabularnewline
20 & 74.3796764333523 & 58.7457283524576 & 64.1571872464322 & 84.6021656202725 & 90.0136245142471 \tabularnewline
21 & 80.0325903737695 & 62.3892565681054 & 68.4962344823214 & 91.5689462652177 & 97.6759241794337 \tabularnewline
22 & 77.9132724129414 & 58.4670871068185 & 65.1980952874901 & 90.6284495383928 & 97.3594577190643 \tabularnewline
23 & 83.922536724462 & 62.8270154428713 & 70.1289167714167 & 97.7161566775075 & 105.018058006053 \tabularnewline
24 & 54.4438099589062 & 31.8188698855264 & 39.650156810123 & 69.2374631076894 & 77.068750032286 \tabularnewline
25 & 78.5846421029023 & 54.527318716748 & 62.8544038477469 & 94.3148803580576 & 102.641965489056 \tabularnewline
26 & 62.6422924064843 & 37.2332053766837 & 46.0281834131797 & 79.2564013997888 & 88.0513794362849 \tabularnewline
27 & 74.2192526858686 & 47.5267706193773 & 56.7659767836531 & 91.672528588084 & 100.911734752360 \tabularnewline
28 & 56.662912815249 & 28.7456647460771 & 38.4088054689142 & 74.9170201615837 & 84.5801608844208 \tabularnewline
29 & 65.1303246647096 & 36.0401264024486 & 46.1092664110540 & 84.1513829183653 & 94.2205229269707 \tabularnewline
30 & 61.9021879390297 & 31.6845353147832 & 42.1439269030373 & 81.660448975022 & 92.1198405632762 \tabularnewline
31 & 60.2264808308989 & 28.9219535975799 & 39.7575506868033 & 80.6954109749945 & 91.5310080642179 \tabularnewline
32 & 74.3796764333523 & 42.0247645885707 & 53.2239367081308 & 95.5354161585738 & 106.734588278134 \tabularnewline
33 & 80.0325903737695 & 46.6603381922705 & 58.2116475573199 & 101.853533190219 & 113.404842555269 \tabularnewline
34 & 77.9132724129414 & 43.5537888480281 & 55.4468136916338 & 100.379731134249 & 112.272755977855 \tabularnewline
35 & 83.922536724462 & 48.6034058457226 & 60.8285983519439 & 107.016475096980 & 119.241667603201 \tabularnewline
36 & 54.4438099589062 & 18.1904252726248 & 30.7389958564687 & 78.1486240613436 & 90.6971946451876 \tabularnewline
37 & 78.5846421029023 & 41.4204819967801 & 54.2843039631033 & 102.884980242701 & 115.748802209024 \tabularnewline
38 & 62.6422924064843 & 24.5891494144073 & 37.7606796013219 & 87.5239052116466 & 100.695435398561 \tabularnewline
39 & 74.2192526858686 & 35.2974260746028 & 48.769638192453 & 99.6688671792842 & 113.141079297134 \tabularnewline
40 & 56.662912815249 & 16.8911549003270 & 30.6575581136471 & 82.6682675168508 & 96.434670730171 \tabularnewline
41 & 65.1303246647096 & 24.5266348961045 & 38.5809989626588 & 91.6796503667605 & 105.734014433315 \tabularnewline
\hline
\end{tabular}
%Source: https://freestatistics.org/blog/index.php?pk=75949&T=1

[TABLE]
[ROW][C]Demand Forecast[/C][/ROW]
[ROW][C]Point[/C][C]Forecast[/C][C]95% LB[/C][C]80% LB[/C][C]80% UB[/C][C]95% UB[/C][/ROW]
[ROW][C]18[/C][C]61.9021879390297[/C][C]51.3814207506467[/C][C]55.0230280323406[/C][C]68.7813478457188[/C][C]72.4229551274127[/C][/ROW]
[ROW][C]19[/C][C]60.2264808308989[/C][C]46.9015629169253[/C][C]51.5137853180711[/C][C]68.9391763437267[/C][C]73.5513987448725[/C][/ROW]
[ROW][C]20[/C][C]74.3796764333523[/C][C]58.7457283524576[/C][C]64.1571872464322[/C][C]84.6021656202725[/C][C]90.0136245142471[/C][/ROW]
[ROW][C]21[/C][C]80.0325903737695[/C][C]62.3892565681054[/C][C]68.4962344823214[/C][C]91.5689462652177[/C][C]97.6759241794337[/C][/ROW]
[ROW][C]22[/C][C]77.9132724129414[/C][C]58.4670871068185[/C][C]65.1980952874901[/C][C]90.6284495383928[/C][C]97.3594577190643[/C][/ROW]
[ROW][C]23[/C][C]83.922536724462[/C][C]62.8270154428713[/C][C]70.1289167714167[/C][C]97.7161566775075[/C][C]105.018058006053[/C][/ROW]
[ROW][C]24[/C][C]54.4438099589062[/C][C]31.8188698855264[/C][C]39.650156810123[/C][C]69.2374631076894[/C][C]77.068750032286[/C][/ROW]
[ROW][C]25[/C][C]78.5846421029023[/C][C]54.527318716748[/C][C]62.8544038477469[/C][C]94.3148803580576[/C][C]102.641965489056[/C][/ROW]
[ROW][C]26[/C][C]62.6422924064843[/C][C]37.2332053766837[/C][C]46.0281834131797[/C][C]79.2564013997888[/C][C]88.0513794362849[/C][/ROW]
[ROW][C]27[/C][C]74.2192526858686[/C][C]47.5267706193773[/C][C]56.7659767836531[/C][C]91.672528588084[/C][C]100.911734752360[/C][/ROW]
[ROW][C]28[/C][C]56.662912815249[/C][C]28.7456647460771[/C][C]38.4088054689142[/C][C]74.9170201615837[/C][C]84.5801608844208[/C][/ROW]
[ROW][C]29[/C][C]65.1303246647096[/C][C]36.0401264024486[/C][C]46.1092664110540[/C][C]84.1513829183653[/C][C]94.2205229269707[/C][/ROW]
[ROW][C]30[/C][C]61.9021879390297[/C][C]31.6845353147832[/C][C]42.1439269030373[/C][C]81.660448975022[/C][C]92.1198405632762[/C][/ROW]
[ROW][C]31[/C][C]60.2264808308989[/C][C]28.9219535975799[/C][C]39.7575506868033[/C][C]80.6954109749945[/C][C]91.5310080642179[/C][/ROW]
[ROW][C]32[/C][C]74.3796764333523[/C][C]42.0247645885707[/C][C]53.2239367081308[/C][C]95.5354161585738[/C][C]106.734588278134[/C][/ROW]
[ROW][C]33[/C][C]80.0325903737695[/C][C]46.6603381922705[/C][C]58.2116475573199[/C][C]101.853533190219[/C][C]113.404842555269[/C][/ROW]
[ROW][C]34[/C][C]77.9132724129414[/C][C]43.5537888480281[/C][C]55.4468136916338[/C][C]100.379731134249[/C][C]112.272755977855[/C][/ROW]
[ROW][C]35[/C][C]83.922536724462[/C][C]48.6034058457226[/C][C]60.8285983519439[/C][C]107.016475096980[/C][C]119.241667603201[/C][/ROW]
[ROW][C]36[/C][C]54.4438099589062[/C][C]18.1904252726248[/C][C]30.7389958564687[/C][C]78.1486240613436[/C][C]90.6971946451876[/C][/ROW]
[ROW][C]37[/C][C]78.5846421029023[/C][C]41.4204819967801[/C][C]54.2843039631033[/C][C]102.884980242701[/C][C]115.748802209024[/C][/ROW]
[ROW][C]38[/C][C]62.6422924064843[/C][C]24.5891494144073[/C][C]37.7606796013219[/C][C]87.5239052116466[/C][C]100.695435398561[/C][/ROW]
[ROW][C]39[/C][C]74.2192526858686[/C][C]35.2974260746028[/C][C]48.769638192453[/C][C]99.6688671792842[/C][C]113.141079297134[/C][/ROW]
[ROW][C]40[/C][C]56.662912815249[/C][C]16.8911549003270[/C][C]30.6575581136471[/C][C]82.6682675168508[/C][C]96.434670730171[/C][/ROW]
[ROW][C]41[/C][C]65.1303246647096[/C][C]24.5266348961045[/C][C]38.5809989626588[/C][C]91.6796503667605[/C][C]105.734014433315[/C][/ROW]
[/TABLE]
Source: https://freestatistics.org/blog/index.php?pk=75949&T=1

Globally Unique Identifier (entire table): ba.freestatistics.org/blog/index.php?pk=75949&T=1

As an alternative you can also use a QR Code:  

The GUIDs for individual cells are displayed in the table below:

Demand Forecast
PointForecast95% LB80% LB80% UB95% UB
1861.902187939029751.381420750646755.023028032340668.781347845718872.4229551274127
1960.226480830898946.901562916925351.513785318071168.939176343726773.5513987448725
2074.379676433352358.745728352457664.157187246432284.602165620272590.0136245142471
2180.032590373769562.389256568105468.496234482321491.568946265217797.6759241794337
2277.913272412941458.467087106818565.198095287490190.628449538392897.3594577190643
2383.92253672446262.827015442871370.128916771416797.7161566775075105.018058006053
2454.443809958906231.818869885526439.65015681012369.237463107689477.068750032286
2578.584642102902354.52731871674862.854403847746994.3148803580576102.641965489056
2662.642292406484337.233205376683746.028183413179779.256401399788888.0513794362849
2774.219252685868647.526770619377356.765976783653191.672528588084100.911734752360
2856.66291281524928.745664746077138.408805468914274.917020161583784.5801608844208
2965.130324664709636.040126402448646.109266411054084.151382918365394.2205229269707
3061.902187939029731.684535314783242.143926903037381.66044897502292.1198405632762
3160.226480830898928.921953597579939.757550686803380.695410974994591.5310080642179
3274.379676433352342.024764588570753.223936708130895.5354161585738106.734588278134
3380.032590373769546.660338192270558.2116475573199101.853533190219113.404842555269
3477.913272412941443.553788848028155.4468136916338100.379731134249112.272755977855
3583.92253672446248.603405845722660.8285983519439107.016475096980119.241667603201
3654.443809958906218.190425272624830.738995856468778.148624061343690.6971946451876
3778.584642102902341.420481996780154.2843039631033102.884980242701115.748802209024
3862.642292406484324.589149414407337.760679601321987.5239052116466100.695435398561
3974.219252685868635.297426074602848.76963819245399.6688671792842113.141079297134
4056.66291281524916.891154900327030.657558113647182.668267516850896.434670730171
4165.130324664709624.526634896104538.580998962658891.6796503667605105.734014433315


Actuals and Interpolation
TimeActualForecast
16667.9993677325781
258.6666666750.5030377163109
36668.4255333474648
451.3333333348.9840195314863
573.1666666759.276958595798
665.8333333366.8449182783594
765.1666666764.3827814588338
88079.1452411442967
98885.4623438201867
108685.3155932291203
1194.6743333391.8565957552002
1266.1666666764.5680647863195
1394.8333333389.9510738147828
1472.3333333377.8044755961785
1586.3333333385.1283465290828
1664.3333333368.5091164045934
1762.6666666773.731610461921

\begin{tabular}{lllllllll}
\hline
Actuals and Interpolation \tabularnewline
Time & Actual & Forecast \tabularnewline
1 & 66 & 67.9993677325781 \tabularnewline
2 & 58.66666667 & 50.5030377163109 \tabularnewline
3 & 66 & 68.4255333474648 \tabularnewline
4 & 51.33333333 & 48.9840195314863 \tabularnewline
5 & 73.16666667 & 59.276958595798 \tabularnewline
6 & 65.83333333 & 66.8449182783594 \tabularnewline
7 & 65.16666667 & 64.3827814588338 \tabularnewline
8 & 80 & 79.1452411442967 \tabularnewline
9 & 88 & 85.4623438201867 \tabularnewline
10 & 86 & 85.3155932291203 \tabularnewline
11 & 94.67433333 & 91.8565957552002 \tabularnewline
12 & 66.16666667 & 64.5680647863195 \tabularnewline
13 & 94.83333333 & 89.9510738147828 \tabularnewline
14 & 72.33333333 & 77.8044755961785 \tabularnewline
15 & 86.33333333 & 85.1283465290828 \tabularnewline
16 & 64.33333333 & 68.5091164045934 \tabularnewline
17 & 62.66666667 & 73.731610461921 \tabularnewline
\hline
\end{tabular}
%Source: https://freestatistics.org/blog/index.php?pk=75949&T=2

[TABLE]
[ROW][C]Actuals and Interpolation[/C][/ROW]
[ROW][C]Time[/C][C]Actual[/C][C]Forecast[/C][/ROW]
[ROW][C]1[/C][C]66[/C][C]67.9993677325781[/C][/ROW]
[ROW][C]2[/C][C]58.66666667[/C][C]50.5030377163109[/C][/ROW]
[ROW][C]3[/C][C]66[/C][C]68.4255333474648[/C][/ROW]
[ROW][C]4[/C][C]51.33333333[/C][C]48.9840195314863[/C][/ROW]
[ROW][C]5[/C][C]73.16666667[/C][C]59.276958595798[/C][/ROW]
[ROW][C]6[/C][C]65.83333333[/C][C]66.8449182783594[/C][/ROW]
[ROW][C]7[/C][C]65.16666667[/C][C]64.3827814588338[/C][/ROW]
[ROW][C]8[/C][C]80[/C][C]79.1452411442967[/C][/ROW]
[ROW][C]9[/C][C]88[/C][C]85.4623438201867[/C][/ROW]
[ROW][C]10[/C][C]86[/C][C]85.3155932291203[/C][/ROW]
[ROW][C]11[/C][C]94.67433333[/C][C]91.8565957552002[/C][/ROW]
[ROW][C]12[/C][C]66.16666667[/C][C]64.5680647863195[/C][/ROW]
[ROW][C]13[/C][C]94.83333333[/C][C]89.9510738147828[/C][/ROW]
[ROW][C]14[/C][C]72.33333333[/C][C]77.8044755961785[/C][/ROW]
[ROW][C]15[/C][C]86.33333333[/C][C]85.1283465290828[/C][/ROW]
[ROW][C]16[/C][C]64.33333333[/C][C]68.5091164045934[/C][/ROW]
[ROW][C]17[/C][C]62.66666667[/C][C]73.731610461921[/C][/ROW]
[/TABLE]
Source: https://freestatistics.org/blog/index.php?pk=75949&T=2

Globally Unique Identifier (entire table): ba.freestatistics.org/blog/index.php?pk=75949&T=2

As an alternative you can also use a QR Code:  

The GUIDs for individual cells are displayed in the table below:

Actuals and Interpolation
TimeActualForecast
16667.9993677325781
258.6666666750.5030377163109
36668.4255333474648
451.3333333348.9840195314863
573.1666666759.276958595798
665.8333333366.8449182783594
765.1666666764.3827814588338
88079.1452411442967
98885.4623438201867
108685.3155932291203
1194.6743333391.8565957552002
1266.1666666764.5680647863195
1394.8333333389.9510738147828
1472.3333333377.8044755961785
1586.3333333385.1283465290828
1664.3333333368.5091164045934
1762.6666666773.731610461921


\begin{tabular}{lllllllll}
\hline
What is next? \tabularnewline
Simulate Time Series \tabularnewline
Generate Forecasts \tabularnewline
Forecast Analysis \tabularnewline
\hline
\end{tabular}
%Source: https://freestatistics.org/blog/index.php?pk=75949&T=3

[TABLE]
[ROW][C]What is next?[/C][/ROW]
[ROW][C]Simulate Time Series[/C][/ROW]
[ROW][C]Generate Forecasts[/C][/ROW]
[ROW][C]Forecast Analysis[/C][/ROW]
[/TABLE]
Source: https://freestatistics.org/blog/index.php?pk=75949&T=3

Globally Unique Identifier (entire table): ba.freestatistics.org/blog/index.php?pk=75949&T=3

As an alternative you can also use a QR Code:  

The GUIDs for individual cells are displayed in the table below:

What is next?
Simulate Time Series
Generate Forecasts
Forecast Analysis


Parameters (Session):
par1 = Input box ; par2 = ARIMA ; par3 = NA ; par4 = NA ; par5 = ZZZ ; par6 = 12 ; par7 = dum ; par8 = dumresult ; par9 = 3 ; par10 = 0.1 ;
Parameters (R input):
par1 = Input box ; par2 = ETS ; par3 = NA ; par4 = NA ; par5 = ZZZ ; par6 = 12 ; par7 = dum ; par8 = dumresult ; par9 = 3 ; par10 = 0.1 ;
R code (references can be found in the software module):
if(par3!='NA') par3 <- as.numeric(par3) else par3 <- NA
if(par4!='NA') par4 <- as.numeric(par4) else par4 <- NA
par6 <- as.numeric(par6) #Seasonal Period
par9 <- as.numeric(par9) #Forecast Horizon
par10 <- as.numeric(par10) #Alpha
library(forecast)
if (par1 == 'CSV') {
xarr <- read.csv(file=paste('tmp/',par7,'.csv',sep=''),header=T)
numseries <- length(xarr[1,])-1
n <- length(xarr[,1])
nmh <- n - par9
nmhp1 <- nmh + 1
rarr <- array(NA,dim=c(n,numseries))
farr <- array(NA,dim=c(n,numseries))
parr <- array(NA,dim=c(numseries,8))
colnames(parr) = list('ME','RMSE','MAE','MPE','MAPE','MASE','ACF1','TheilU')
for(i in 1:numseries) {
sindex <- i+1
x <- xarr[,sindex]
if(par2=='Croston') {
if (i==1) m <- croston(x,alpha=par10)
if (i==1) mydemand <- m$model$demand[]
fit <- croston(x[1:nmh],h=par9,alpha=par10)
}
if(par2=='ARIMA') {
m <- auto.arima(ts(x,freq=par6),d=par3,D=par4)
mydemand <- forecast(m)
fit <- auto.arima(ts(x[1:nmh],freq=par6),d=par3,D=par4)
}
if(par2=='ETS') {
m <- ets(ts(x,freq=par6),model=par5)
mydemand <- forecast(m)
fit <- ets(ts(x[1:nmh],freq=par6),model=par5)
}
try(rarr[,i] <- mydemand$resid,silent=T)
try(farr[,i] <- mydemand$mean,silent=T)
if (par2!='Croston') parr[i,] <- accuracy(forecast(fit,par9),x[nmhp1:n])
if (par2=='Croston') parr[i,] <- accuracy(fit,x[nmhp1:n])
}
write.csv(farr,file=paste('tmp/',par8,'_f.csv',sep=''))
write.csv(rarr,file=paste('tmp/',par8,'_r.csv',sep=''))
write.csv(parr,file=paste('tmp/',par8,'_p.csv',sep=''))
}
if (par1 == 'Input box') {
numseries <- 1
n <- length(x)
if(par2=='Croston') {
m <- croston(x)
mydemand <- m$model$demand[]
}
if(par2=='ARIMA') {
m <- auto.arima(ts(x,freq=par6),d=par3,D=par4)
mydemand <- forecast(m)
}
if(par2=='ETS') {
m <- ets(ts(x,freq=par6),model=par5)
mydemand <- forecast(m)
}
summary(m)
}
bitmap(file='test1.png')
op <- par(mfrow=c(2,1))
if (par2=='Croston') plot(m)
if ((par2=='ARIMA') | par2=='ETS') plot(forecast(m))
plot(mydemand$resid,type='l',main='Residuals', ylab='residual value', xlab='time')
par(op)
dev.off()
bitmap(file='pic2.png')
op <- par(mfrow=c(2,2))
acf(mydemand$resid, lag.max=n/3, main='Residual ACF', ylab='autocorrelation', xlab='time lag')
pacf(mydemand$resid,lag.max=n/3, main='Residual PACF', ylab='partial autocorrelation', xlab='time lag')
cpgram(mydemand$resid, main='Cumulative Periodogram of Residuals')
qqnorm(mydemand$resid); qqline(mydemand$resid, col=2)
par(op)
dev.off()
load(file='createtable')
a<-table.start()
a<-table.row.start(a)
a<-table.element(a,'Demand Forecast',6,TRUE)
a<-table.row.end(a)
a<-table.row.start(a)
a<-table.element(a,'Point',header=TRUE)
a<-table.element(a,'Forecast',header=TRUE)
a<-table.element(a,'95% LB',header=TRUE)
a<-table.element(a,'80% LB',header=TRUE)
a<-table.element(a,'80% UB',header=TRUE)
a<-table.element(a,'95% UB',header=TRUE)
a<-table.row.end(a)
for (i in 1:length(mydemand$mean)) {
a<-table.row.start(a)
a<-table.element(a,i+n,header=TRUE)
a<-table.element(a,as.numeric(mydemand$mean[i]))
a<-table.element(a,as.numeric(mydemand$lower[i,2]))
a<-table.element(a,as.numeric(mydemand$lower[i,1]))
a<-table.element(a,as.numeric(mydemand$upper[i,1]))
a<-table.element(a,as.numeric(mydemand$upper[i,2]))
a<-table.row.end(a)
}
a<-table.end(a)
table.save(a,file='mytable.tab')
a<-table.start()
a<-table.row.start(a)
a<-table.element(a,'Actuals and Interpolation',3,TRUE)
a<-table.row.end(a)
a<-table.row.start(a)
a<-table.element(a,'Time',header=TRUE)
a<-table.element(a,'Actual',header=TRUE)
a<-table.element(a,'Forecast',header=TRUE)
a<-table.row.end(a)
for (i in 1:n) {
a<-table.row.start(a)
a<-table.element(a,i,header=TRUE)
a<-table.element(a,x[i])
a<-table.element(a,x[i] - as.numeric(m$resid[i]))
a<-table.row.end(a)
}
a<-table.end(a)
table.save(a,file='mytable1.tab')
a<-table.start()
a<-table.row.start(a)
a<-table.element(a,'What is next?',1,TRUE)
a<-table.row.end(a)
a<-table.row.start(a)
a<-table.element(a,hyperlink(paste('https://automated.biganalytics.eu/Patrick.Wessa/rwasp_demand_forecasting_simulate.wasp',sep=''),'Simulate Time Series','',target=''))
a<-table.row.end(a)
a<-table.row.start(a)
a<-table.element(a,hyperlink(paste('https://automated.biganalytics.eu/Patrick.Wessa/rwasp_demand_forecasting_croston.wasp',sep=''),'Generate Forecasts','',target=''))
a<-table.row.end(a)
a<-table.row.start(a)
a<-table.element(a,hyperlink(paste('https://automated.biganalytics.eu/Patrick.Wessa/rwasp_demand_forecasting_analysis.wasp',sep=''),'Forecast Analysis','',target=''))
a<-table.row.end(a)
a<-table.end(a)
table.save(a,file='mytable0.tab')
-SERVER-wessa.org