Free Statistics

of Irreproducible Research!

Author's title

Author*Unverified author*
R Software ModulePatrick.Wessarwasp_demand_forecasting_croston.wasp
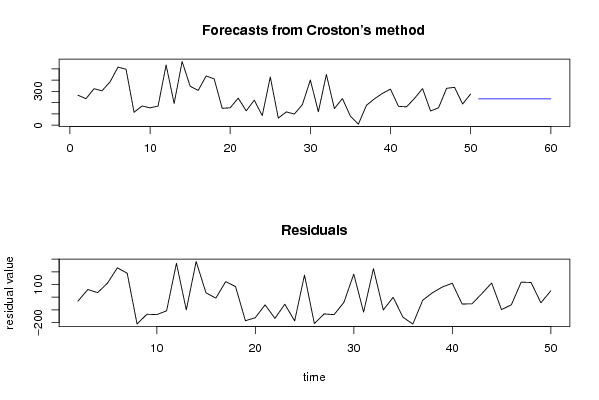
Title produced by softwareCroston Forecasting
Date of computationFri, 28 May 2010 08:36:05 +0000
Cite this page as followsStatistical Computations at FreeStatistics.org, Office for Research Development and Education, URL https://freestatistics.org/blog/index.php?v=date/2010/May/28/t1275035804lmi5y2wzws6x2yi.htm/, Retrieved Sun, 28 Apr 2024 09:43:48 +0000
Statistical Computations at FreeStatistics.org, Office for Research Development and Education, URL https://freestatistics.org/blog/index.php?pk=76621, Retrieved Sun, 28 Apr 2024 09:43:48 +0000
QR Codes:

Original text written by user:
IsPrivate?No (this computation is public)
User-defined keywordsa
Estimated Impact200
Family? (F = Feedback message, R = changed R code, M = changed R Module, P = changed Parameters, D = changed Data)
-     [Croston Forecasting] [B28A,steven,cooma...] [2010-05-13 11:28:31] [74be16979710d4c4e7c6647856088456]
-   PD    [Croston Forecasting] [a] [2010-05-28 08:36:05] [d41d8cd98f00b204e9800998ecf8427e] [Current]
Feedback Forum

Post a new message
Dataseries X:
266.25
235.25
323.775
305.25
383.527
515.25
496.15
115.25
170.5
154.25
170
534.05
193.75
564.5
346
308.25
437.05
410.275
149.75
154.75
240.1
127.525
222.25
85.525
427.75
63.5
118.3
99.5
182.25
401
119.5
450.25
147.5
237
80.025
10.5
176.75
234
282.5
320
167.5
163.25
238.15
325.125
126.3
154.875
327.25
336.25
188
277.25


Summary of computational transaction
Raw Inputview raw input (R code)
Raw Outputview raw output of R engine
Computing time3 seconds
R Serverwessa.org @ wessa.org

\begin{tabular}{lllllllll}
\hline
Summary of computational transaction \tabularnewline
Raw Input & view raw input (R code)  \tabularnewline
Raw Output & view raw output of R engine  \tabularnewline
Computing time & 3 seconds \tabularnewline
R Server & wessa.org @ wessa.org \tabularnewline
\hline
\end{tabular}
%Source: https://freestatistics.org/blog/index.php?pk=76621&T=0

[TABLE]
[ROW][C]Summary of computational transaction[/C][/ROW]
[ROW][C]Raw Input[/C][C]view raw input (R code) [/C][/ROW]
[ROW][C]Raw Output[/C][C]view raw output of R engine [/C][/ROW]
[ROW][C]Computing time[/C][C]3 seconds[/C][/ROW]
[ROW][C]R Server[/C][C]wessa.org @ wessa.org[/C][/ROW]
[/TABLE]
Source: https://freestatistics.org/blog/index.php?pk=76621&T=0

Globally Unique Identifier (entire table): ba.freestatistics.org/blog/index.php?pk=76621&T=0

As an alternative you can also use a QR Code:  

The GUIDs for individual cells are displayed in the table below:

Summary of computational transaction
Raw Inputview raw input (R code)
Raw Outputview raw output of R engine
Computing time3 seconds
R Serverwessa.org @ wessa.org


Demand Forecast
PointForecast95% LB80% LB80% UB95% UB
51232.63050011459-33.397889625767058.683885768475406.577114460705498.658889854947
52232.63050011459-34.724722743176157.8163162252361407.444684003944499.985722972356
53232.63050011459-36.045003478134856.9530310545947408.307969174586501.306003707315
54232.63050011459-37.358827956507556.0939674032264409.167032825954502.619828185688
55232.63050011459-38.666289976559455.2390639397422410.021936289438503.92729020574
56232.63050011459-39.96748108710554.3882608035898410.872739425591505.228481316285
57232.63050011459-41.262490662315853.5414995561396411.719500673041506.523490891496
58232.63050011459-42.551405973358752.6987231338426412.562277095338507.812406202539
59232.63050011459-43.834312257030151.8598758033536413.401124425827509.095312486211
60232.63050011459-45.111292781534251.0249031185202414.23609711066510.372293010715

\begin{tabular}{lllllllll}
\hline
Demand Forecast \tabularnewline
Point & Forecast & 95% LB & 80% LB & 80% UB & 95% UB \tabularnewline
51 & 232.63050011459 & -33.3978896257670 & 58.683885768475 & 406.577114460705 & 498.658889854947 \tabularnewline
52 & 232.63050011459 & -34.7247227431761 & 57.8163162252361 & 407.444684003944 & 499.985722972356 \tabularnewline
53 & 232.63050011459 & -36.0450034781348 & 56.9530310545947 & 408.307969174586 & 501.306003707315 \tabularnewline
54 & 232.63050011459 & -37.3588279565075 & 56.0939674032264 & 409.167032825954 & 502.619828185688 \tabularnewline
55 & 232.63050011459 & -38.6662899765594 & 55.2390639397422 & 410.021936289438 & 503.92729020574 \tabularnewline
56 & 232.63050011459 & -39.967481087105 & 54.3882608035898 & 410.872739425591 & 505.228481316285 \tabularnewline
57 & 232.63050011459 & -41.2624906623158 & 53.5414995561396 & 411.719500673041 & 506.523490891496 \tabularnewline
58 & 232.63050011459 & -42.5514059733587 & 52.6987231338426 & 412.562277095338 & 507.812406202539 \tabularnewline
59 & 232.63050011459 & -43.8343122570301 & 51.8598758033536 & 413.401124425827 & 509.095312486211 \tabularnewline
60 & 232.63050011459 & -45.1112927815342 & 51.0249031185202 & 414.23609711066 & 510.372293010715 \tabularnewline
\hline
\end{tabular}
%Source: https://freestatistics.org/blog/index.php?pk=76621&T=1

[TABLE]
[ROW][C]Demand Forecast[/C][/ROW]
[ROW][C]Point[/C][C]Forecast[/C][C]95% LB[/C][C]80% LB[/C][C]80% UB[/C][C]95% UB[/C][/ROW]
[ROW][C]51[/C][C]232.63050011459[/C][C]-33.3978896257670[/C][C]58.683885768475[/C][C]406.577114460705[/C][C]498.658889854947[/C][/ROW]
[ROW][C]52[/C][C]232.63050011459[/C][C]-34.7247227431761[/C][C]57.8163162252361[/C][C]407.444684003944[/C][C]499.985722972356[/C][/ROW]
[ROW][C]53[/C][C]232.63050011459[/C][C]-36.0450034781348[/C][C]56.9530310545947[/C][C]408.307969174586[/C][C]501.306003707315[/C][/ROW]
[ROW][C]54[/C][C]232.63050011459[/C][C]-37.3588279565075[/C][C]56.0939674032264[/C][C]409.167032825954[/C][C]502.619828185688[/C][/ROW]
[ROW][C]55[/C][C]232.63050011459[/C][C]-38.6662899765594[/C][C]55.2390639397422[/C][C]410.021936289438[/C][C]503.92729020574[/C][/ROW]
[ROW][C]56[/C][C]232.63050011459[/C][C]-39.967481087105[/C][C]54.3882608035898[/C][C]410.872739425591[/C][C]505.228481316285[/C][/ROW]
[ROW][C]57[/C][C]232.63050011459[/C][C]-41.2624906623158[/C][C]53.5414995561396[/C][C]411.719500673041[/C][C]506.523490891496[/C][/ROW]
[ROW][C]58[/C][C]232.63050011459[/C][C]-42.5514059733587[/C][C]52.6987231338426[/C][C]412.562277095338[/C][C]507.812406202539[/C][/ROW]
[ROW][C]59[/C][C]232.63050011459[/C][C]-43.8343122570301[/C][C]51.8598758033536[/C][C]413.401124425827[/C][C]509.095312486211[/C][/ROW]
[ROW][C]60[/C][C]232.63050011459[/C][C]-45.1112927815342[/C][C]51.0249031185202[/C][C]414.23609711066[/C][C]510.372293010715[/C][/ROW]
[/TABLE]
Source: https://freestatistics.org/blog/index.php?pk=76621&T=1

Globally Unique Identifier (entire table): ba.freestatistics.org/blog/index.php?pk=76621&T=1

As an alternative you can also use a QR Code:  

The GUIDs for individual cells are displayed in the table below:

Demand Forecast
PointForecast95% LB80% LB80% UB95% UB
51232.63050011459-33.397889625767058.683885768475406.577114460705498.658889854947
52232.63050011459-34.724722743176157.8163162252361407.444684003944499.985722972356
53232.63050011459-36.045003478134856.9530310545947408.307969174586501.306003707315
54232.63050011459-37.358827956507556.0939674032264409.167032825954502.619828185688
55232.63050011459-38.666289976559455.2390639397422410.021936289438503.92729020574
56232.63050011459-39.96748108710554.3882608035898410.872739425591505.228481316285
57232.63050011459-41.262490662315853.5414995561396411.719500673041506.523490891496
58232.63050011459-42.551405973358752.6987231338426412.562277095338507.812406202539
59232.63050011459-43.834312257030151.8598758033536413.401124425827509.095312486211
60232.63050011459-45.111292781534251.0249031185202414.23609711066510.372293010715


Actuals and Interpolation
TimeActualForecast
1266.25NA
2235.25266.25
3323.775263.15
4305.25269.2125
5383.527272.81625
6515.25283.887325
7496.15307.0235925
8115.25325.93623325
9170.5304.867609925
10154.25291.4308489325
11170277.71276403925
12534.05266.941487635325
13193.75293.652338871793
14564.5283.662104984613
15346311.745894486152
16308.25315.171305037537
17437.05314.479174533783
18410.275326.736257080405
19149.75335.090131372364
20154.75316.556118235128
21240.1300.375506411615
22127.525294.347955770454
23222.25277.665660193408
2485.525272.124094174068
25427.75253.464184756661
2663.5270.892766280995
27118.3250.153489652895
2899.5236.968140687606
29182.25223.221326618845
30401219.124193956961
31119.5237.311774561265
32450.25225.530597105138
33147.5248.002537394624
34237237.952283655162
3580.025237.857055289646
3610.5222.073849760681
37176.75200.916464784613
38234198.499818306152
39282.5202.049836475537
40320210.094852827983
41167.5221.085367545185
42163.25215.726830790666
43238.15210.479147711600
44325.125213.246232940440
45126.3224.434109646396
46154.875214.620698681756
47327.25208.646128813580
48336.25220.506515932222
49188232.080864339
50277.25227.672777905100

\begin{tabular}{lllllllll}
\hline
Actuals and Interpolation \tabularnewline
Time & Actual & Forecast \tabularnewline
1 & 266.25 & NA \tabularnewline
2 & 235.25 & 266.25 \tabularnewline
3 & 323.775 & 263.15 \tabularnewline
4 & 305.25 & 269.2125 \tabularnewline
5 & 383.527 & 272.81625 \tabularnewline
6 & 515.25 & 283.887325 \tabularnewline
7 & 496.15 & 307.0235925 \tabularnewline
8 & 115.25 & 325.93623325 \tabularnewline
9 & 170.5 & 304.867609925 \tabularnewline
10 & 154.25 & 291.4308489325 \tabularnewline
11 & 170 & 277.71276403925 \tabularnewline
12 & 534.05 & 266.941487635325 \tabularnewline
13 & 193.75 & 293.652338871793 \tabularnewline
14 & 564.5 & 283.662104984613 \tabularnewline
15 & 346 & 311.745894486152 \tabularnewline
16 & 308.25 & 315.171305037537 \tabularnewline
17 & 437.05 & 314.479174533783 \tabularnewline
18 & 410.275 & 326.736257080405 \tabularnewline
19 & 149.75 & 335.090131372364 \tabularnewline
20 & 154.75 & 316.556118235128 \tabularnewline
21 & 240.1 & 300.375506411615 \tabularnewline
22 & 127.525 & 294.347955770454 \tabularnewline
23 & 222.25 & 277.665660193408 \tabularnewline
24 & 85.525 & 272.124094174068 \tabularnewline
25 & 427.75 & 253.464184756661 \tabularnewline
26 & 63.5 & 270.892766280995 \tabularnewline
27 & 118.3 & 250.153489652895 \tabularnewline
28 & 99.5 & 236.968140687606 \tabularnewline
29 & 182.25 & 223.221326618845 \tabularnewline
30 & 401 & 219.124193956961 \tabularnewline
31 & 119.5 & 237.311774561265 \tabularnewline
32 & 450.25 & 225.530597105138 \tabularnewline
33 & 147.5 & 248.002537394624 \tabularnewline
34 & 237 & 237.952283655162 \tabularnewline
35 & 80.025 & 237.857055289646 \tabularnewline
36 & 10.5 & 222.073849760681 \tabularnewline
37 & 176.75 & 200.916464784613 \tabularnewline
38 & 234 & 198.499818306152 \tabularnewline
39 & 282.5 & 202.049836475537 \tabularnewline
40 & 320 & 210.094852827983 \tabularnewline
41 & 167.5 & 221.085367545185 \tabularnewline
42 & 163.25 & 215.726830790666 \tabularnewline
43 & 238.15 & 210.479147711600 \tabularnewline
44 & 325.125 & 213.246232940440 \tabularnewline
45 & 126.3 & 224.434109646396 \tabularnewline
46 & 154.875 & 214.620698681756 \tabularnewline
47 & 327.25 & 208.646128813580 \tabularnewline
48 & 336.25 & 220.506515932222 \tabularnewline
49 & 188 & 232.080864339 \tabularnewline
50 & 277.25 & 227.672777905100 \tabularnewline
\hline
\end{tabular}
%Source: https://freestatistics.org/blog/index.php?pk=76621&T=2

[TABLE]
[ROW][C]Actuals and Interpolation[/C][/ROW]
[ROW][C]Time[/C][C]Actual[/C][C]Forecast[/C][/ROW]
[ROW][C]1[/C][C]266.25[/C][C]NA[/C][/ROW]
[ROW][C]2[/C][C]235.25[/C][C]266.25[/C][/ROW]
[ROW][C]3[/C][C]323.775[/C][C]263.15[/C][/ROW]
[ROW][C]4[/C][C]305.25[/C][C]269.2125[/C][/ROW]
[ROW][C]5[/C][C]383.527[/C][C]272.81625[/C][/ROW]
[ROW][C]6[/C][C]515.25[/C][C]283.887325[/C][/ROW]
[ROW][C]7[/C][C]496.15[/C][C]307.0235925[/C][/ROW]
[ROW][C]8[/C][C]115.25[/C][C]325.93623325[/C][/ROW]
[ROW][C]9[/C][C]170.5[/C][C]304.867609925[/C][/ROW]
[ROW][C]10[/C][C]154.25[/C][C]291.4308489325[/C][/ROW]
[ROW][C]11[/C][C]170[/C][C]277.71276403925[/C][/ROW]
[ROW][C]12[/C][C]534.05[/C][C]266.941487635325[/C][/ROW]
[ROW][C]13[/C][C]193.75[/C][C]293.652338871793[/C][/ROW]
[ROW][C]14[/C][C]564.5[/C][C]283.662104984613[/C][/ROW]
[ROW][C]15[/C][C]346[/C][C]311.745894486152[/C][/ROW]
[ROW][C]16[/C][C]308.25[/C][C]315.171305037537[/C][/ROW]
[ROW][C]17[/C][C]437.05[/C][C]314.479174533783[/C][/ROW]
[ROW][C]18[/C][C]410.275[/C][C]326.736257080405[/C][/ROW]
[ROW][C]19[/C][C]149.75[/C][C]335.090131372364[/C][/ROW]
[ROW][C]20[/C][C]154.75[/C][C]316.556118235128[/C][/ROW]
[ROW][C]21[/C][C]240.1[/C][C]300.375506411615[/C][/ROW]
[ROW][C]22[/C][C]127.525[/C][C]294.347955770454[/C][/ROW]
[ROW][C]23[/C][C]222.25[/C][C]277.665660193408[/C][/ROW]
[ROW][C]24[/C][C]85.525[/C][C]272.124094174068[/C][/ROW]
[ROW][C]25[/C][C]427.75[/C][C]253.464184756661[/C][/ROW]
[ROW][C]26[/C][C]63.5[/C][C]270.892766280995[/C][/ROW]
[ROW][C]27[/C][C]118.3[/C][C]250.153489652895[/C][/ROW]
[ROW][C]28[/C][C]99.5[/C][C]236.968140687606[/C][/ROW]
[ROW][C]29[/C][C]182.25[/C][C]223.221326618845[/C][/ROW]
[ROW][C]30[/C][C]401[/C][C]219.124193956961[/C][/ROW]
[ROW][C]31[/C][C]119.5[/C][C]237.311774561265[/C][/ROW]
[ROW][C]32[/C][C]450.25[/C][C]225.530597105138[/C][/ROW]
[ROW][C]33[/C][C]147.5[/C][C]248.002537394624[/C][/ROW]
[ROW][C]34[/C][C]237[/C][C]237.952283655162[/C][/ROW]
[ROW][C]35[/C][C]80.025[/C][C]237.857055289646[/C][/ROW]
[ROW][C]36[/C][C]10.5[/C][C]222.073849760681[/C][/ROW]
[ROW][C]37[/C][C]176.75[/C][C]200.916464784613[/C][/ROW]
[ROW][C]38[/C][C]234[/C][C]198.499818306152[/C][/ROW]
[ROW][C]39[/C][C]282.5[/C][C]202.049836475537[/C][/ROW]
[ROW][C]40[/C][C]320[/C][C]210.094852827983[/C][/ROW]
[ROW][C]41[/C][C]167.5[/C][C]221.085367545185[/C][/ROW]
[ROW][C]42[/C][C]163.25[/C][C]215.726830790666[/C][/ROW]
[ROW][C]43[/C][C]238.15[/C][C]210.479147711600[/C][/ROW]
[ROW][C]44[/C][C]325.125[/C][C]213.246232940440[/C][/ROW]
[ROW][C]45[/C][C]126.3[/C][C]224.434109646396[/C][/ROW]
[ROW][C]46[/C][C]154.875[/C][C]214.620698681756[/C][/ROW]
[ROW][C]47[/C][C]327.25[/C][C]208.646128813580[/C][/ROW]
[ROW][C]48[/C][C]336.25[/C][C]220.506515932222[/C][/ROW]
[ROW][C]49[/C][C]188[/C][C]232.080864339[/C][/ROW]
[ROW][C]50[/C][C]277.25[/C][C]227.672777905100[/C][/ROW]
[/TABLE]
Source: https://freestatistics.org/blog/index.php?pk=76621&T=2

Globally Unique Identifier (entire table): ba.freestatistics.org/blog/index.php?pk=76621&T=2

As an alternative you can also use a QR Code:  

The GUIDs for individual cells are displayed in the table below:

Actuals and Interpolation
TimeActualForecast
1266.25NA
2235.25266.25
3323.775263.15
4305.25269.2125
5383.527272.81625
6515.25283.887325
7496.15307.0235925
8115.25325.93623325
9170.5304.867609925
10154.25291.4308489325
11170277.71276403925
12534.05266.941487635325
13193.75293.652338871793
14564.5283.662104984613
15346311.745894486152
16308.25315.171305037537
17437.05314.479174533783
18410.275326.736257080405
19149.75335.090131372364
20154.75316.556118235128
21240.1300.375506411615
22127.525294.347955770454
23222.25277.665660193408
2485.525272.124094174068
25427.75253.464184756661
2663.5270.892766280995
27118.3250.153489652895
2899.5236.968140687606
29182.25223.221326618845
30401219.124193956961
31119.5237.311774561265
32450.25225.530597105138
33147.5248.002537394624
34237237.952283655162
3580.025237.857055289646
3610.5222.073849760681
37176.75200.916464784613
38234198.499818306152
39282.5202.049836475537
40320210.094852827983
41167.5221.085367545185
42163.25215.726830790666
43238.15210.479147711600
44325.125213.246232940440
45126.3224.434109646396
46154.875214.620698681756
47327.25208.646128813580
48336.25220.506515932222
49188232.080864339
50277.25227.672777905100


\begin{tabular}{lllllllll}
\hline
What is next? \tabularnewline
Simulate Time Series \tabularnewline
Generate Forecasts \tabularnewline
Forecast Analysis \tabularnewline
\hline
\end{tabular}
%Source: https://freestatistics.org/blog/index.php?pk=76621&T=3

[TABLE]
[ROW][C]What is next?[/C][/ROW]
[ROW][C]Simulate Time Series[/C][/ROW]
[ROW][C]Generate Forecasts[/C][/ROW]
[ROW][C]Forecast Analysis[/C][/ROW]
[/TABLE]
Source: https://freestatistics.org/blog/index.php?pk=76621&T=3

Globally Unique Identifier (entire table): ba.freestatistics.org/blog/index.php?pk=76621&T=3

As an alternative you can also use a QR Code:  

The GUIDs for individual cells are displayed in the table below:

What is next?
Simulate Time Series
Generate Forecasts
Forecast Analysis


Parameters (Session):
par1 = Input box ; par2 = Croston ; par3 = NA ; par4 = NA ; par5 = ZZZ ; par6 = 12 ; par7 = dum ; par8 = b28acm ; par9 = 3 ; par10 = 0.1 ;
Parameters (R input):
par1 = Input box ; par2 = Croston ; par3 = NA ; par4 = NA ; par5 = ZZZ ; par6 = 12 ; par7 = dum ; par8 = b28acm ; par9 = 3 ; par10 = 0.1 ;
R code (references can be found in the software module):
if(par3!='NA') par3 <- as.numeric(par3) else par3 <- NA
if(par4!='NA') par4 <- as.numeric(par4) else par4 <- NA
par6 <- as.numeric(par6) #Seasonal Period
par9 <- as.numeric(par9) #Forecast Horizon
par10 <- as.numeric(par10) #Alpha
library(forecast)
if (par1 == 'CSV') {
xarr <- read.csv(file=paste('tmp/',par7,'.csv',sep=''),header=T)
numseries <- length(xarr[1,])-1
n <- length(xarr[,1])
nmh <- n - par9
nmhp1 <- nmh + 1
rarr <- array(NA,dim=c(n,numseries))
farr <- array(NA,dim=c(n,numseries))
parr <- array(NA,dim=c(numseries,8))
colnames(parr) = list('ME','RMSE','MAE','MPE','MAPE','MASE','ACF1','TheilU')
for(i in 1:numseries) {
sindex <- i+1
x <- xarr[,sindex]
if(par2=='Croston') {
if (i==1) m <- croston(x,alpha=par10)
if (i==1) mydemand <- m$model$demand[]
fit <- croston(x[1:nmh],h=par9,alpha=par10)
}
if(par2=='ARIMA') {
m <- auto.arima(ts(x,freq=par6),d=par3,D=par4)
mydemand <- forecast(m)
fit <- auto.arima(ts(x[1:nmh],freq=par6),d=par3,D=par4)
}
if(par2=='ETS') {
m <- ets(ts(x,freq=par6),model=par5)
mydemand <- forecast(m)
fit <- ets(ts(x[1:nmh],freq=par6),model=par5)
}
try(rarr[,i] <- mydemand$resid,silent=T)
try(farr[,i] <- mydemand$mean,silent=T)
if (par2!='Croston') parr[i,] <- accuracy(forecast(fit,par9),x[nmhp1:n])
if (par2=='Croston') parr[i,] <- accuracy(fit,x[nmhp1:n])
}
write.csv(farr,file=paste('tmp/',par8,'_f.csv',sep=''))
write.csv(rarr,file=paste('tmp/',par8,'_r.csv',sep=''))
write.csv(parr,file=paste('tmp/',par8,'_p.csv',sep=''))
}
if (par1 == 'Input box') {
numseries <- 1
n <- length(x)
if(par2=='Croston') {
m <- croston(x)
mydemand <- m$model$demand[]
}
if(par2=='ARIMA') {
m <- auto.arima(ts(x,freq=par6),d=par3,D=par4)
mydemand <- forecast(m)
}
if(par2=='ETS') {
m <- ets(ts(x,freq=par6),model=par5)
mydemand <- forecast(m)
}
summary(m)
}
bitmap(file='test1.png')
op <- par(mfrow=c(2,1))
if (par2=='Croston') plot(m)
if ((par2=='ARIMA') | par2=='ETS') plot(forecast(m))
plot(mydemand$resid,type='l',main='Residuals', ylab='residual value', xlab='time')
par(op)
dev.off()
bitmap(file='pic2.png')
op <- par(mfrow=c(2,2))
acf(mydemand$resid, lag.max=n/3, main='Residual ACF', ylab='autocorrelation', xlab='time lag')
pacf(mydemand$resid,lag.max=n/3, main='Residual PACF', ylab='partial autocorrelation', xlab='time lag')
cpgram(mydemand$resid, main='Cumulative Periodogram of Residuals')
qqnorm(mydemand$resid); qqline(mydemand$resid, col=2)
par(op)
dev.off()
load(file='createtable')
a<-table.start()
a<-table.row.start(a)
a<-table.element(a,'Demand Forecast',6,TRUE)
a<-table.row.end(a)
a<-table.row.start(a)
a<-table.element(a,'Point',header=TRUE)
a<-table.element(a,'Forecast',header=TRUE)
a<-table.element(a,'95% LB',header=TRUE)
a<-table.element(a,'80% LB',header=TRUE)
a<-table.element(a,'80% UB',header=TRUE)
a<-table.element(a,'95% UB',header=TRUE)
a<-table.row.end(a)
for (i in 1:length(mydemand$mean)) {
a<-table.row.start(a)
a<-table.element(a,i+n,header=TRUE)
a<-table.element(a,as.numeric(mydemand$mean[i]))
a<-table.element(a,as.numeric(mydemand$lower[i,2]))
a<-table.element(a,as.numeric(mydemand$lower[i,1]))
a<-table.element(a,as.numeric(mydemand$upper[i,1]))
a<-table.element(a,as.numeric(mydemand$upper[i,2]))
a<-table.row.end(a)
}
a<-table.end(a)
table.save(a,file='mytable.tab')
a<-table.start()
a<-table.row.start(a)
a<-table.element(a,'Actuals and Interpolation',3,TRUE)
a<-table.row.end(a)
a<-table.row.start(a)
a<-table.element(a,'Time',header=TRUE)
a<-table.element(a,'Actual',header=TRUE)
a<-table.element(a,'Forecast',header=TRUE)
a<-table.row.end(a)
for (i in 1:n) {
a<-table.row.start(a)
a<-table.element(a,i,header=TRUE)
a<-table.element(a,x[i])
a<-table.element(a,x[i] - as.numeric(m$resid[i]))
a<-table.row.end(a)
}
a<-table.end(a)
table.save(a,file='mytable1.tab')
a<-table.start()
a<-table.row.start(a)
a<-table.element(a,'What is next?',1,TRUE)
a<-table.row.end(a)
a<-table.row.start(a)
a<-table.element(a,hyperlink(paste('https://automated.biganalytics.eu/Patrick.Wessa/rwasp_demand_forecasting_simulate.wasp',sep=''),'Simulate Time Series','',target=''))
a<-table.row.end(a)
a<-table.row.start(a)
a<-table.element(a,hyperlink(paste('https://automated.biganalytics.eu/Patrick.Wessa/rwasp_demand_forecasting_croston.wasp',sep=''),'Generate Forecasts','',target=''))
a<-table.row.end(a)
a<-table.row.start(a)
a<-table.element(a,hyperlink(paste('https://automated.biganalytics.eu/Patrick.Wessa/rwasp_demand_forecasting_analysis.wasp',sep=''),'Forecast Analysis','',target=''))
a<-table.row.end(a)
a<-table.end(a)
table.save(a,file='mytable0.tab')
-SERVER-wessa.org