Free Statistics

of Irreproducible Research!

Author's title

Author*The author of this computation has been verified*
R Software Modulerwasp_linear_regression.wasp
Title produced by softwareLinear Regression Graphical Model Validation
Date of computationFri, 12 Nov 2010 09:53:46 +0000
Cite this page as followsStatistical Computations at FreeStatistics.org, Office for Research Development and Education, URL https://freestatistics.org/blog/index.php?v=date/2010/Nov/12/t1289555744hhfienwyd8s8t12.htm/, Retrieved Tue, 30 Apr 2024 20:49:59 +0000
Statistical Computations at FreeStatistics.org, Office for Research Development and Education, URL https://freestatistics.org/blog/index.php?pk=94065, Retrieved Tue, 30 Apr 2024 20:49:59 +0000
QR Codes:

Original text written by user:
IsPrivate?No (this computation is public)
User-defined keywords
Estimated Impact114
Family? (F = Feedback message, R = changed R code, M = changed R Module, P = changed Parameters, D = changed Data)
-     [Linear Regression Graphical Model Validation] [Colombia Coffee -...] [2008-02-26 10:22:06] [74be16979710d4c4e7c6647856088456]
-  M D    [Linear Regression Graphical Model Validation] [workshop 6 mini-t...] [2010-11-12 09:53:46] [c52f616cc59ab01e55ce1a10b5754887] [Current]
Feedback Forum

Post a new message
Dataseries X:
26,012
21,288
28,576
18,023
23,666
51,887
16,642
24,505
6,886
21,614
17,972
20,514
31,325
19,459
35,75
15,787
45,21
27,778
21,489
27,393
28,944
16,318
4,148
27,405
20,413
43,35
19,125
25,031
23,804
20,327
12,455
30,598
6,343
21,453
50,435
14,647
78,187
36,639
69,935
40,63
4,437
14,942
20,483
36,377
28,392
54,545
15,787
20,22
23,05
32,141
218,987
29,965
28,942
51,018
21,637
27,026
24,258
29,872
21,59
40,5
22,056
72,165
14,026
22,125
26,845
22,834
20,719
12,301
343,037
33,655
65,078
60,501
73,215
45,577
150,834
23,14
41,579
17,954
43,676
37,572
12,208
18,504
26,145
13,791
42,453
26,099
33,494
32,651
28,751
20,218
18,734
67,125
27,585
12,143
324,724
17,253
19,001
25,298
23,449
30,245
91,059
48,154
17,748
10,045
12,871
23,727
12,821
6,684
23,341
60,505
123,69
8,687
27,213
27,718
36,96
6,113
14,345
33,53
46,639
19,807
44,131
34,465
12,509
15,263
2,974
12,85
14,459
9,605
30,422
29,966
48,422
38,056
29,639
60,639
40,353
3,636
19,599
12,95
29,676
18,609
10,562
43,283
20,266
155,213
73,938
80,59
23,077
25,44
52,128
17,724
8,431
118,919
26,719
17,591
101,462
18,541
8,059
345,61
26,573
66,183
13,047
69,978
11,313
14,723
60,973
8,507
20,146
24,486
21,939
23,813
Dataseries Y:
162,961
143,843
330,045
185,511
408,589
202,001
127,147
111,288
152,99
153,358
200,304
148,122
201,677
224,896
171,75
204,718
238,903
157,166
212,108
83,178
407,225
126,735
348,082
148,947
182,881
256,367
152,64
171,875
185,806
168,03
152,631
359,107
211,763
177,074
189,696
170,66
272,506
305,783
253,422
207,372
173,177
150,88
129,589
281,863
169,353
232,379
237,947
116,108
264,094
134,779
502,513
196,733
139,64
197,299
150,072
192,42
196,311
254,363
501,749
264,359
200,927
255,593
165,519
108,677
223,899
117,261
163,407
100,313
542,167
253,128
231,782
179,355
246,221
296,323
386,414
173,679
219,625
491,827
219,237
204,517
358,472
49,678
320,58
364,879
202,591
193,035
190,105
413,4
227,963
228,062
142,047
280,549
280,57
87,968
681,944
157,17
189,206
184,88
143,002
210,046
690,992
208,427
168,628
170,154
163,336
146,779
397,704
59,616
202,325
255,614
389,883
130,712
253,638
253,327
431,801
185,353
104,058
67,982
186,906
192,535
157,478
133,281
162,382
258,44
116,406
231,911
221,136
47,923
218,922
115,151
237,187
336,088
178,29
221,478
224,425
54,246
134,99
175,844
684,951
146,311
82,281
205,401
125,25
401,432
428,11
248,945
206,823
251,551
232,807
129,242
168,344
464,963
192,782
105,935
333,543
166,653
45,971
370,407
114,431
228,531
105,719
310,386
53,516
159,619
296,031
258,861
115,844
149,782
315,715
130,141


Summary of computational transaction
Raw Inputview raw input (R code)
Raw Outputview raw output of R engine
Computing time5 seconds
R Server'RServer@AstonUniversity' @ vre.aston.ac.uk

\begin{tabular}{lllllllll}
\hline
Summary of computational transaction \tabularnewline
Raw Input & view raw input (R code)  \tabularnewline
Raw Output & view raw output of R engine  \tabularnewline
Computing time & 5 seconds \tabularnewline
R Server & 'RServer@AstonUniversity' @ vre.aston.ac.uk \tabularnewline
\hline
\end{tabular}
%Source: https://freestatistics.org/blog/index.php?pk=94065&T=0

[TABLE]
[ROW][C]Summary of computational transaction[/C][/ROW]
[ROW][C]Raw Input[/C][C]view raw input (R code) [/C][/ROW]
[ROW][C]Raw Output[/C][C]view raw output of R engine [/C][/ROW]
[ROW][C]Computing time[/C][C]5 seconds[/C][/ROW]
[ROW][C]R Server[/C][C]'RServer@AstonUniversity' @ vre.aston.ac.uk[/C][/ROW]
[/TABLE]
Source: https://freestatistics.org/blog/index.php?pk=94065&T=0

Globally Unique Identifier (entire table): ba.freestatistics.org/blog/index.php?pk=94065&T=0

As an alternative you can also use a QR Code:  

The GUIDs for individual cells are displayed in the table below:

Summary of computational transaction
Raw Inputview raw input (R code)
Raw Outputview raw output of R engine
Computing time5 seconds
R Server'RServer@AstonUniversity' @ vre.aston.ac.uk


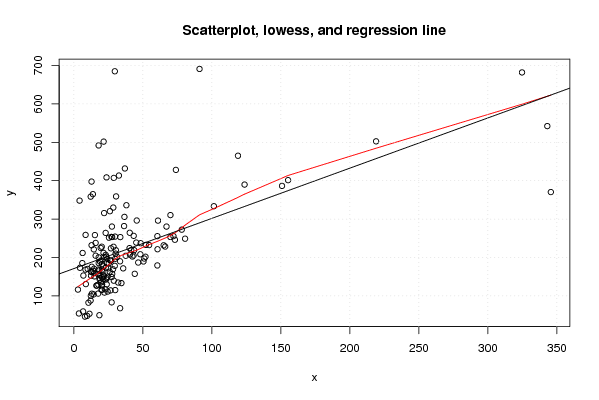
Simple Linear Regression
StatisticsEstimateS.D.T-STAT (H0: coeff=0)P-value (two-sided)
constant term171.1171518971549.218133707616618.5631015262630
slope1.30777036312350.1483133625295088.817616570882551.33226762955019e-15

\begin{tabular}{lllllllll}
\hline
Simple Linear Regression \tabularnewline
Statistics & Estimate & S.D. & T-STAT (H0: coeff=0) & P-value (two-sided) \tabularnewline
constant term & 171.117151897154 & 9.2181337076166 & 18.563101526263 & 0 \tabularnewline
slope & 1.3077703631235 & 0.148313362529508 & 8.81761657088255 & 1.33226762955019e-15 \tabularnewline
\hline
\end{tabular}
%Source: https://freestatistics.org/blog/index.php?pk=94065&T=1

[TABLE]
[ROW][C]Simple Linear Regression[/C][/ROW]
[ROW][C]Statistics[/C][C]Estimate[/C][C]S.D.[/C][C]T-STAT (H0: coeff=0)[/C][C]P-value (two-sided)[/C][/ROW]
[ROW][C]constant term[/C][C]171.117151897154[/C][C]9.2181337076166[/C][C]18.563101526263[/C][C]0[/C][/ROW]
[ROW][C]slope[/C][C]1.3077703631235[/C][C]0.148313362529508[/C][C]8.81761657088255[/C][C]1.33226762955019e-15[/C][/ROW]
[/TABLE]
Source: https://freestatistics.org/blog/index.php?pk=94065&T=1

Globally Unique Identifier (entire table): ba.freestatistics.org/blog/index.php?pk=94065&T=1

As an alternative you can also use a QR Code:  

The GUIDs for individual cells are displayed in the table below:

Simple Linear Regression
StatisticsEstimateS.D.T-STAT (H0: coeff=0)P-value (two-sided)
constant term171.1171518971549.218133707616618.5631015262630
slope1.30777036312350.1483133625295088.817616570882551.33226762955019e-15


Parameters (Session):
par1 = 0 ;
Parameters (R input):
par1 = 0 ;
R code (references can be found in the software module):
par1 <- as.numeric(par1)
library(lattice)
z <- as.data.frame(cbind(x,y))
m <- lm(y~x)
summary(m)
bitmap(file='test1.png')
plot(z,main='Scatterplot, lowess, and regression line')
lines(lowess(z),col='red')
abline(m)
grid()
dev.off()
bitmap(file='test2.png')
m2 <- lm(m$fitted.values ~ x)
summary(m2)
z2 <- as.data.frame(cbind(x,m$fitted.values))
names(z2) <- list('x','Fitted')
plot(z2,main='Scatterplot, lowess, and regression line')
lines(lowess(z2),col='red')
abline(m2)
grid()
dev.off()
bitmap(file='test3.png')
m3 <- lm(m$residuals ~ x)
summary(m3)
z3 <- as.data.frame(cbind(x,m$residuals))
names(z3) <- list('x','Residuals')
plot(z3,main='Scatterplot, lowess, and regression line')
lines(lowess(z3),col='red')
abline(m3)
grid()
dev.off()
bitmap(file='test4.png')
m4 <- lm(m$fitted.values ~ m$residuals)
summary(m4)
z4 <- as.data.frame(cbind(m$residuals,m$fitted.values))
names(z4) <- list('Residuals','Fitted')
plot(z4,main='Scatterplot, lowess, and regression line')
lines(lowess(z4),col='red')
abline(m4)
grid()
dev.off()
bitmap(file='test5.png')
myr <- as.ts(m$residuals)
z5 <- as.data.frame(cbind(lag(myr,1),myr))
names(z5) <- list('Lagged Residuals','Residuals')
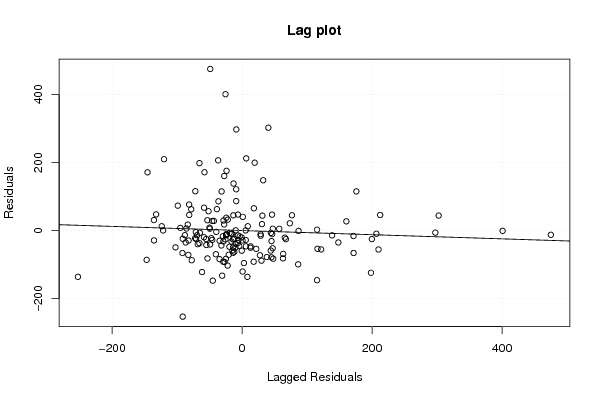
plot(z5,main='Lag plot')
m5 <- lm(z5)
summary(m5)
abline(m5)
grid()
dev.off()
bitmap(file='test6.png')
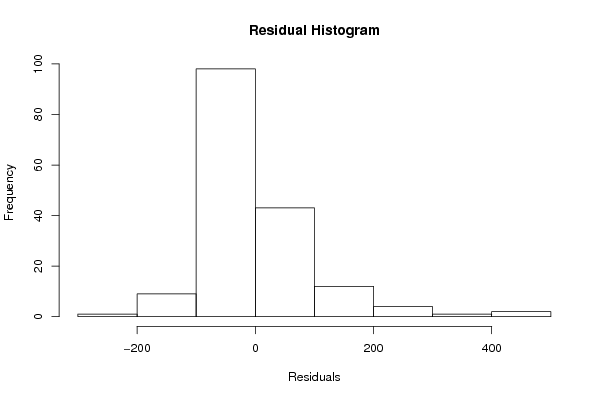
hist(m$residuals,main='Residual Histogram',xlab='Residuals')
dev.off()
bitmap(file='test7.png')
if (par1 > 0)
{
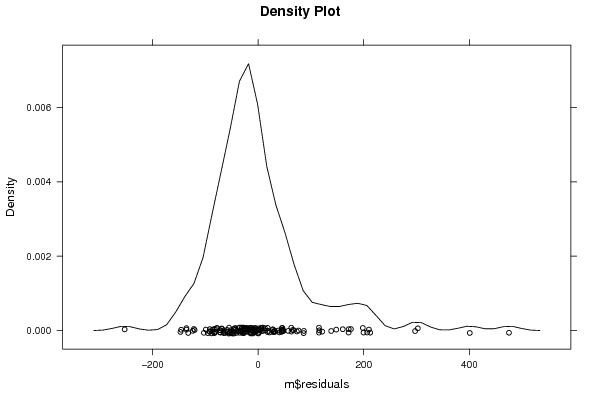
densityplot(~m$residuals,col='black',main=paste('Density Plot bw = ',par1),bw=par1)
} else {
densityplot(~m$residuals,col='black',main='Density Plot')
}
dev.off()
bitmap(file='test8.png')
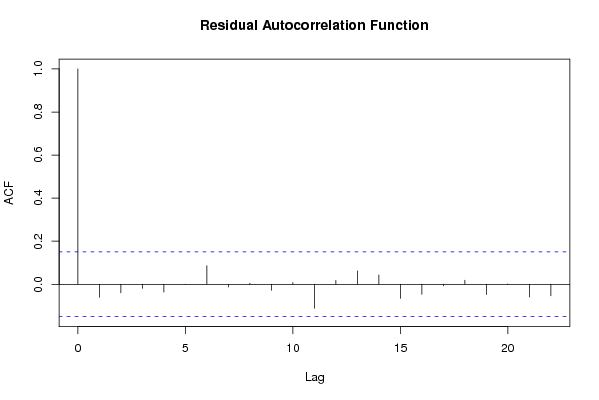
acf(m$residuals,main='Residual Autocorrelation Function')
dev.off()
bitmap(file='test9.png')
qqnorm(x)
qqline(x)
grid()
dev.off()
load(file='createtable')
a<-table.start()
a<-table.row.start(a)
a<-table.element(a,'Simple Linear Regression',5,TRUE)
a<-table.row.end(a)
a<-table.row.start(a)
a<-table.element(a,'Statistics',1,TRUE)
a<-table.element(a,'Estimate',1,TRUE)
a<-table.element(a,'S.D.',1,TRUE)
a<-table.element(a,'T-STAT (H0: coeff=0)',1,TRUE)
a<-table.element(a,'P-value (two-sided)',1,TRUE)
a<-table.row.end(a)
a<-table.row.start(a)
a<-table.element(a,'constant term',header=TRUE)
a<-table.element(a,m$coefficients[[1]])
sd <- sqrt(vcov(m)[1,1])
a<-table.element(a,sd)
tstat <- m$coefficients[[1]]/sd
a<-table.element(a,tstat)
pval <- 2*(1-pt(abs(tstat),length(x)-2))
a<-table.element(a,pval)
a<-table.row.end(a)
a<-table.row.start(a)
a<-table.element(a,'slope',header=TRUE)
a<-table.element(a,m$coefficients[[2]])
sd <- sqrt(vcov(m)[2,2])
a<-table.element(a,sd)
tstat <- m$coefficients[[2]]/sd
a<-table.element(a,tstat)
pval <- 2*(1-pt(abs(tstat),length(x)-2))
a<-table.element(a,pval)
a<-table.row.end(a)
a<-table.end(a)
table.save(a,file='mytable.tab')