Free Statistics

of Irreproducible Research!

Author's title

Author*The author of this computation has been verified*
R Software Modulerwasp_Two Factor ANOVA.wasp
Title produced by softwareTwo-Way ANOVA
Date of computationWed, 12 Dec 2012 16:44:20 -0500
Cite this page as followsStatistical Computations at FreeStatistics.org, Office for Research Development and Education, URL https://freestatistics.org/blog/index.php?v=date/2012/Dec/12/t13553486818u34ulzyuo3pw7o.htm/, Retrieved Mon, 29 Apr 2024 06:42:52 +0000
Statistical Computations at FreeStatistics.org, Office for Research Development and Education, URL https://freestatistics.org/blog/index.php?pk=199087, Retrieved Mon, 29 Apr 2024 06:42:52 +0000
QR Codes:

Original text written by user:
IsPrivate?No (this computation is public)
User-defined keywords
Estimated Impact103
Family? (F = Feedback message, R = changed R code, M = changed R Module, P = changed Parameters, D = changed Data)
-     [Two-Way ANOVA] [D1 2Anova] [2011-12-20 09:12:14] [0f81819b439c6e991d1a2004e9982756]
- R  D  [Two-Way ANOVA] [D1 2Anova] [2011-12-20 12:14:07] [0f81819b439c6e991d1a2004e9982756]
-    D    [Two-Way ANOVA] [D1 2Anova] [2011-12-20 12:23:21] [0f81819b439c6e991d1a2004e9982756]
-    D        [Two-Way ANOVA] [paper (7)] [2012-12-12 21:44:20] [6b9eda33bf4cae06c9f9f024b199ddfb] [Current]
Feedback Forum

Post a new message
Dataseries X:
'M'	'G1'	547
'M'	'G1'	538
'M'	'G1'	437
'M'	'G1'	534
'M'	'G1'	529
'M'	'G1'	539
'M'	'G2'	590
'M'	'G2'	489
'M'	'G2'	349
'M'	'G2'	458
'M'	'G2'	593
'M'	'G2'	600
'M'	'G3'	586
'M'	'G3'	499
'M'	'G3'	586
'M'	'G3'	538
'M'	'G3'	528
'M'	'G3'	487
'F'	'G1'	278
'F'	'G1'	389
'F'	'G1'	484
'F'	'G1'	530
'F'	'G1'	540
'F'	'G1'	489
'F'	'G2'	599
'F'	'G2'	454
'F'	'G2'	511
'F'	'G2'	489
'F'	'G2'	379
'F'	'G2'	547
'F'	'G3'	432
'F'	'G3'	357
'F'	'G3'	688
'F'	'G3'	538
'F'	'G3'	290
'F'	'G3'	375


Summary of computational transaction
Raw Inputview raw input (R code)
Raw Outputview raw output of R engine
Computing time5 seconds
R Server'Sir Ronald Aylmer Fisher' @ fisher.wessa.net

\begin{tabular}{lllllllll}
\hline
Summary of computational transaction \tabularnewline
Raw Input & view raw input (R code)  \tabularnewline
Raw Output & view raw output of R engine  \tabularnewline
Computing time & 5 seconds \tabularnewline
R Server & 'Sir Ronald Aylmer Fisher' @ fisher.wessa.net \tabularnewline
\hline
\end{tabular}
%Source: https://freestatistics.org/blog/index.php?pk=199087&T=0

[TABLE]
[ROW][C]Summary of computational transaction[/C][/ROW]
[ROW][C]Raw Input[/C][C]view raw input (R code) [/C][/ROW]
[ROW][C]Raw Output[/C][C]view raw output of R engine [/C][/ROW]
[ROW][C]Computing time[/C][C]5 seconds[/C][/ROW]
[ROW][C]R Server[/C][C]'Sir Ronald Aylmer Fisher' @ fisher.wessa.net[/C][/ROW]
[/TABLE]
Source: https://freestatistics.org/blog/index.php?pk=199087&T=0

Globally Unique Identifier (entire table): ba.freestatistics.org/blog/index.php?pk=199087&T=0

As an alternative you can also use a QR Code:  

The GUIDs for individual cells are displayed in the table below:

Summary of computational transaction
Raw Inputview raw input (R code)
Raw Outputview raw output of R engine
Computing time5 seconds
R Server'Sir Ronald Aylmer Fisher' @ fisher.wessa.net


ANOVA Model
xdf2$Liters ~ xdf2$Groep * xdf2$Geslacht
names(Intercept)xdf2$GroepG2xdf2$GroepG3xdf2$GeslachtMxdf2$GroepG2:xdf2$GeslachtMxdf2$GroepG3:xdf2$GeslachtM
means451.6744.833-569-52.33321.667

\begin{tabular}{lllllllll}
\hline
ANOVA Model \tabularnewline
xdf2$Liters ~ xdf2$Groep * xdf2$Geslacht \tabularnewline
names & (Intercept) & xdf2$GroepG2 & xdf2$GroepG3 & xdf2$GeslachtM & xdf2$GroepG2:xdf2$GeslachtM & xdf2$GroepG3:xdf2$GeslachtM \tabularnewline
means & 451.67 & 44.833 & -5 & 69 & -52.333 & 21.667 \tabularnewline
\hline
\end{tabular}
%Source: https://freestatistics.org/blog/index.php?pk=199087&T=1

[TABLE]
[ROW][C]ANOVA Model[/C][/ROW]
[ROW][C]xdf2$Liters ~ xdf2$Groep * xdf2$Geslacht[/C][/ROW]
[ROW][C]names[/C][C](Intercept)[/C][C]xdf2$GroepG2[/C][C]xdf2$GroepG3[/C][C]xdf2$GeslachtM[/C][C]xdf2$GroepG2:xdf2$GeslachtM[/C][C]xdf2$GroepG3:xdf2$GeslachtM[/C][/ROW]
[ROW][C]means[/C][C]451.67[/C][C]44.833[/C][C]-5[/C][C]69[/C][C]-52.333[/C][C]21.667[/C][/ROW]
[/TABLE]
Source: https://freestatistics.org/blog/index.php?pk=199087&T=1

Globally Unique Identifier (entire table): ba.freestatistics.org/blog/index.php?pk=199087&T=1

As an alternative you can also use a QR Code:  

The GUIDs for individual cells are displayed in the table below:

ANOVA Model
xdf2$Liters ~ xdf2$Groep * xdf2$Geslacht
names(Intercept)xdf2$GroepG2xdf2$GroepG3xdf2$GeslachtMxdf2$GroepG2:xdf2$GeslachtMxdf2$GroepG3:xdf2$GeslachtM
means451.6744.833-569-52.33321.667


ANOVA Statistics
DfSum SqMean SqF valuePr(>F)
2
xdf2$Groep22188.71094.30.130420.87822
xdf2$Geslacht231093310933.70570.063754
xdf2$Groep:xdf2$Geslacht28684.24342.10.517490.60124
Residuals302517208390.7

\begin{tabular}{lllllllll}
\hline
ANOVA Statistics \tabularnewline
  & Df & Sum Sq & Mean Sq & F value & Pr(>F) \tabularnewline
 & 2 &  &  &  &  \tabularnewline
xdf2$Groep & 2 & 2188.7 & 1094.3 & 0.13042 & 0.87822 \tabularnewline
xdf2$Geslacht & 2 & 31093 & 31093 & 3.7057 & 0.063754 \tabularnewline
xdf2$Groep:xdf2$Geslacht & 2 & 8684.2 & 4342.1 & 0.51749 & 0.60124 \tabularnewline
Residuals & 30 & 251720 & 8390.7 &   &   \tabularnewline
\hline
\end{tabular}
%Source: https://freestatistics.org/blog/index.php?pk=199087&T=2

[TABLE]
[ROW][C]ANOVA Statistics[/C][/ROW]
[ROW][C] [/C][C]Df[/C][C]Sum Sq[/C][C]Mean Sq[/C][C]F value[/C][C]Pr(>F)[/C][/ROW]
[ROW][C][/C][C]2[/C][C][/C][C][/C][C][/C][C][/C][/ROW]
[ROW][C]xdf2$Groep[/C][C]2[/C][C]2188.7[/C][C]1094.3[/C][C]0.13042[/C][C]0.87822[/C][/ROW]
[ROW][C]xdf2$Geslacht[/C][C]2[/C][C]31093[/C][C]31093[/C][C]3.7057[/C][C]0.063754[/C][/ROW]
[ROW][C]xdf2$Groep:xdf2$Geslacht[/C][C]2[/C][C]8684.2[/C][C]4342.1[/C][C]0.51749[/C][C]0.60124[/C][/ROW]
[ROW][C]Residuals[/C][C]30[/C][C]251720[/C][C]8390.7[/C][C] [/C][C] [/C][/ROW]
[/TABLE]
Source: https://freestatistics.org/blog/index.php?pk=199087&T=2

Globally Unique Identifier (entire table): ba.freestatistics.org/blog/index.php?pk=199087&T=2

As an alternative you can also use a QR Code:  

The GUIDs for individual cells are displayed in the table below:

ANOVA Statistics
DfSum SqMean SqF valuePr(>F)
2
xdf2$Groep22188.71094.30.130420.87822
xdf2$Geslacht231093310933.70570.063754
xdf2$Groep:xdf2$Geslacht28684.24342.10.517490.60124
Residuals302517208390.7


Tukey Honest Significant Difference Comparisons
difflwruprp adj
G2-G118.667-73.524110.860.87226
G3-G15.8333-86.35798.0240.98668
G3-G2-12.833-105.0279.3570.93728
M-F58.778-3.58121.140.063754
G2:F-G1:F44.833-116.02205.690.95576
G3:F-G1:F-5-165.86155.861
G1:M-G1:F69-91.856229.860.78016
G2:M-G1:F61.5-99.356222.360.85055
G3:M-G1:F85.667-75.19246.520.59245
G3:F-G2:F-49.833-210.69111.020.93206
G1:M-G2:F24.167-136.69185.020.99725
G2:M-G2:F16.667-144.19177.520.99954
G3:M-G2:F40.833-120.02201.690.97017
G1:M-G3:F74-86.856234.860.72712
G2:M-G3:F66.5-94.356227.360.80498
G3:M-G3:F90.667-70.19251.520.5334
G2:M-G1:M-7.5-168.36153.360.99999
G3:M-G1:M16.667-144.19177.520.99954
G3:M-G2:M24.167-136.69185.020.99725

\begin{tabular}{lllllllll}
\hline
Tukey Honest Significant Difference Comparisons \tabularnewline
  & diff & lwr & upr & p adj \tabularnewline
G2-G1 & 18.667 & -73.524 & 110.86 & 0.87226 \tabularnewline
G3-G1 & 5.8333 & -86.357 & 98.024 & 0.98668 \tabularnewline
G3-G2 & -12.833 & -105.02 & 79.357 & 0.93728 \tabularnewline
M-F & 58.778 & -3.58 & 121.14 & 0.063754 \tabularnewline
G2:F-G1:F & 44.833 & -116.02 & 205.69 & 0.95576 \tabularnewline
G3:F-G1:F & -5 & -165.86 & 155.86 & 1 \tabularnewline
G1:M-G1:F & 69 & -91.856 & 229.86 & 0.78016 \tabularnewline
G2:M-G1:F & 61.5 & -99.356 & 222.36 & 0.85055 \tabularnewline
G3:M-G1:F & 85.667 & -75.19 & 246.52 & 0.59245 \tabularnewline
G3:F-G2:F & -49.833 & -210.69 & 111.02 & 0.93206 \tabularnewline
G1:M-G2:F & 24.167 & -136.69 & 185.02 & 0.99725 \tabularnewline
G2:M-G2:F & 16.667 & -144.19 & 177.52 & 0.99954 \tabularnewline
G3:M-G2:F & 40.833 & -120.02 & 201.69 & 0.97017 \tabularnewline
G1:M-G3:F & 74 & -86.856 & 234.86 & 0.72712 \tabularnewline
G2:M-G3:F & 66.5 & -94.356 & 227.36 & 0.80498 \tabularnewline
G3:M-G3:F & 90.667 & -70.19 & 251.52 & 0.5334 \tabularnewline
G2:M-G1:M & -7.5 & -168.36 & 153.36 & 0.99999 \tabularnewline
G3:M-G1:M & 16.667 & -144.19 & 177.52 & 0.99954 \tabularnewline
G3:M-G2:M & 24.167 & -136.69 & 185.02 & 0.99725 \tabularnewline
\hline
\end{tabular}
%Source: https://freestatistics.org/blog/index.php?pk=199087&T=3

[TABLE]
[ROW][C]Tukey Honest Significant Difference Comparisons[/C][/ROW]
[ROW][C] [/C][C]diff[/C][C]lwr[/C][C]upr[/C][C]p adj[/C][/ROW]
[ROW][C]G2-G1[/C][C]18.667[/C][C]-73.524[/C][C]110.86[/C][C]0.87226[/C][/ROW]
[ROW][C]G3-G1[/C][C]5.8333[/C][C]-86.357[/C][C]98.024[/C][C]0.98668[/C][/ROW]
[ROW][C]G3-G2[/C][C]-12.833[/C][C]-105.02[/C][C]79.357[/C][C]0.93728[/C][/ROW]
[ROW][C]M-F[/C][C]58.778[/C][C]-3.58[/C][C]121.14[/C][C]0.063754[/C][/ROW]
[ROW][C]G2:F-G1:F[/C][C]44.833[/C][C]-116.02[/C][C]205.69[/C][C]0.95576[/C][/ROW]
[ROW][C]G3:F-G1:F[/C][C]-5[/C][C]-165.86[/C][C]155.86[/C][C]1[/C][/ROW]
[ROW][C]G1:M-G1:F[/C][C]69[/C][C]-91.856[/C][C]229.86[/C][C]0.78016[/C][/ROW]
[ROW][C]G2:M-G1:F[/C][C]61.5[/C][C]-99.356[/C][C]222.36[/C][C]0.85055[/C][/ROW]
[ROW][C]G3:M-G1:F[/C][C]85.667[/C][C]-75.19[/C][C]246.52[/C][C]0.59245[/C][/ROW]
[ROW][C]G3:F-G2:F[/C][C]-49.833[/C][C]-210.69[/C][C]111.02[/C][C]0.93206[/C][/ROW]
[ROW][C]G1:M-G2:F[/C][C]24.167[/C][C]-136.69[/C][C]185.02[/C][C]0.99725[/C][/ROW]
[ROW][C]G2:M-G2:F[/C][C]16.667[/C][C]-144.19[/C][C]177.52[/C][C]0.99954[/C][/ROW]
[ROW][C]G3:M-G2:F[/C][C]40.833[/C][C]-120.02[/C][C]201.69[/C][C]0.97017[/C][/ROW]
[ROW][C]G1:M-G3:F[/C][C]74[/C][C]-86.856[/C][C]234.86[/C][C]0.72712[/C][/ROW]
[ROW][C]G2:M-G3:F[/C][C]66.5[/C][C]-94.356[/C][C]227.36[/C][C]0.80498[/C][/ROW]
[ROW][C]G3:M-G3:F[/C][C]90.667[/C][C]-70.19[/C][C]251.52[/C][C]0.5334[/C][/ROW]
[ROW][C]G2:M-G1:M[/C][C]-7.5[/C][C]-168.36[/C][C]153.36[/C][C]0.99999[/C][/ROW]
[ROW][C]G3:M-G1:M[/C][C]16.667[/C][C]-144.19[/C][C]177.52[/C][C]0.99954[/C][/ROW]
[ROW][C]G3:M-G2:M[/C][C]24.167[/C][C]-136.69[/C][C]185.02[/C][C]0.99725[/C][/ROW]
[/TABLE]
Source: https://freestatistics.org/blog/index.php?pk=199087&T=3

Globally Unique Identifier (entire table): ba.freestatistics.org/blog/index.php?pk=199087&T=3

As an alternative you can also use a QR Code:  

The GUIDs for individual cells are displayed in the table below:

Tukey Honest Significant Difference Comparisons
difflwruprp adj
G2-G118.667-73.524110.860.87226
G3-G15.8333-86.35798.0240.98668
G3-G2-12.833-105.0279.3570.93728
M-F58.778-3.58121.140.063754
G2:F-G1:F44.833-116.02205.690.95576
G3:F-G1:F-5-165.86155.861
G1:M-G1:F69-91.856229.860.78016
G2:M-G1:F61.5-99.356222.360.85055
G3:M-G1:F85.667-75.19246.520.59245
G3:F-G2:F-49.833-210.69111.020.93206
G1:M-G2:F24.167-136.69185.020.99725
G2:M-G2:F16.667-144.19177.520.99954
G3:M-G2:F40.833-120.02201.690.97017
G1:M-G3:F74-86.856234.860.72712
G2:M-G3:F66.5-94.356227.360.80498
G3:M-G3:F90.667-70.19251.520.5334
G2:M-G1:M-7.5-168.36153.360.99999
G3:M-G1:M16.667-144.19177.520.99954
G3:M-G2:M24.167-136.69185.020.99725


Levenes Test for Homogeneity of Variance
DfF valuePr(>F)
Group51.56470.20021
30

\begin{tabular}{lllllllll}
\hline
Levenes Test for Homogeneity of Variance \tabularnewline
  & Df & F value & Pr(>F) \tabularnewline
Group & 5 & 1.5647 & 0.20021 \tabularnewline
  & 30 &   &   \tabularnewline
\hline
\end{tabular}
%Source: https://freestatistics.org/blog/index.php?pk=199087&T=4

[TABLE]
[ROW][C]Levenes Test for Homogeneity of Variance[/C][/ROW]
[ROW][C] [/C][C]Df[/C][C]F value[/C][C]Pr(>F)[/C][/ROW]
[ROW][C]Group[/C][C]5[/C][C]1.5647[/C][C]0.20021[/C][/ROW]
[ROW][C] [/C][C]30[/C][C] [/C][C] [/C][/ROW]
[/TABLE]
Source: https://freestatistics.org/blog/index.php?pk=199087&T=4

Globally Unique Identifier (entire table): ba.freestatistics.org/blog/index.php?pk=199087&T=4

As an alternative you can also use a QR Code:  

The GUIDs for individual cells are displayed in the table below:

Levenes Test for Homogeneity of Variance
DfF valuePr(>F)
Group51.56470.20021
30


Parameters (Session):
par1 = 3 ; par2 = 2 ; par3 = 1 ; par4 = TRUE ;
Parameters (R input):
par1 = 3 ; par2 = 2 ; par3 = 1 ; par4 = TRUE ;
R code (references can be found in the software module):
cat1 <- as.numeric(par1) #
cat2<- as.numeric(par2) #
cat3 <- as.numeric(par3)
intercept<-as.logical(par4)
x <- t(x)
x1<-as.numeric(x[,cat1])
f1<-as.character(x[,cat2])
f2 <- as.character(x[,cat3])
xdf<-data.frame(x1,f1, f2)
(V1<-dimnames(y)[[1]][cat1])
(V2<-dimnames(y)[[1]][cat2])
(V3 <-dimnames(y)[[1]][cat3])
mynames<- c(V1, V2, V3)
xdf2<-xdf
names(xdf2)<-mynames
names(xdf)<-c('R', 'A', 'B')
mynames <- c(V1, V2, V3)
if(intercept == FALSE)eval (substitute(lmout<-lm(xdf$R ~ xdf$A * xdf$B- 1, data = xdf), list(xdf=quote(xdf2),R=mynames[1],A=mynames[2],B=mynames[3]) ))else eval(substitute(lmout<-lm(xdf$R ~ xdf$A * xdf$B, data = xdf), list(xdf=quote(xdf2),R=mynames[1],A=mynames[2],B=mynames[3]) ))
oldnames<-names(lmout$coeff)
newnames<-gsub('xdf2$', '', oldnames)
(names(lmout$coeff)<-newnames)
(names(lmout$coefficients)<-newnames)
load(file='createtable')
a<-table.start()
a<-table.row.start(a)
a<-table.element(a,'ANOVA Model', length(lmout$coefficients)+1,TRUE)
a<-table.row.end(a)
a<-table.row.start(a)
callstr<-gsub('xdf2$', '',as.character(lmout$call$formula))
callstr<-paste(callstr[2], callstr[1], callstr[3])
a<-table.element(a,callstr ,length(lmout$coefficients)+1,TRUE)
a<-table.row.end(a)
a<-table.row.start(a)
a<-table.element(a, 'names',,TRUE)
for(i in 1:length(lmout$coefficients)){
a<-table.element(a, names(lmout$coefficients[i]),,FALSE)
}
a<-table.row.end(a)
a<-table.row.start(a)
a<-table.element(a, 'means',,TRUE)
for(i in 1:length(lmout$coefficients)){
a<-table.element(a, signif(lmout$coefficients[i], digits=5),,FALSE)
}
a<-table.row.end(a)
a<-table.end(a)
table.save(a,file='mytable.tab')
(aov.xdf<-aov(lmout) )
(anova.xdf<-anova(lmout) )
rownames(anova.xdf)<-gsub('xdf2$','',rownames(anova.xdf))
a<-table.start()
a<-table.row.start(a)
a<-table.element(a,'ANOVA Statistics', 5+1,TRUE)
a<-table.row.end(a)
a<-table.row.start(a)
a<-table.element(a, ' ',,TRUE)
a<-table.element(a, 'Df',,FALSE)
a<-table.element(a, 'Sum Sq',,FALSE)
a<-table.element(a, 'Mean Sq',,FALSE)
a<-table.element(a, 'F value',,FALSE)
a<-table.element(a, 'Pr(>F)',,FALSE)
a<-table.row.end(a)
for(i in 1 : length(rownames(anova.xdf))-1){
a<-table.row.start(a)
a<-table.element(a,rownames(anova.xdf)[i] ,,TRUE)
a<-table.element(a, anova.xdf$Df[1],,FALSE)
a<-table.element(a, signif(anova.xdf$'Sum Sq'[i], digits=5),,FALSE)
a<-table.element(a, signif(anova.xdf$'Mean Sq'[i], digits=5),,FALSE)
a<-table.element(a, signif(anova.xdf$'F value'[i], digits=5),,FALSE)
a<-table.element(a, signif(anova.xdf$'Pr(>F)'[i], digits=5),,FALSE)
a<-table.row.end(a)
}
a<-table.row.start(a)
a<-table.element(a, 'Residuals',,TRUE)
a<-table.element(a, anova.xdf$'Df'[i+1],,FALSE)
a<-table.element(a, signif(anova.xdf$'Sum Sq'[i+1], digits=5),,FALSE)
a<-table.element(a, signif(anova.xdf$'Mean Sq'[i+1], digits=5),,FALSE)
a<-table.element(a, ' ',,FALSE)
a<-table.row.end(a)
a<-table.end(a)
table.save(a,file='mytable1.tab')
bitmap(file='anovaplot.png')
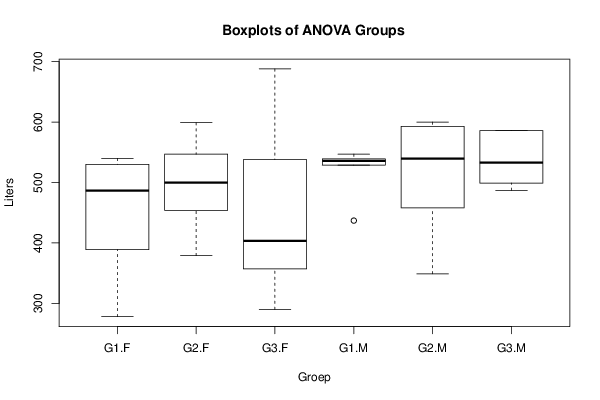
boxplot(R ~ A + B, data=xdf, xlab=V2, ylab=V1, main='Boxplots of ANOVA Groups')
dev.off()
bitmap(file='designplot.png')
xdf2 <- xdf # to preserve xdf make copy for function
names(xdf2) <- c(V1, V2, V3)
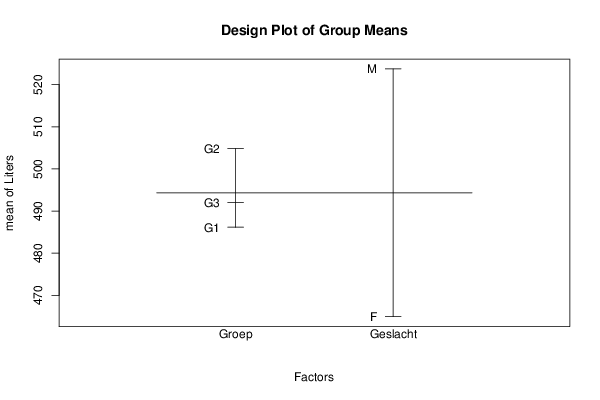
plot.design(xdf2, main='Design Plot of Group Means')
dev.off()
bitmap(file='interactionplot.png')
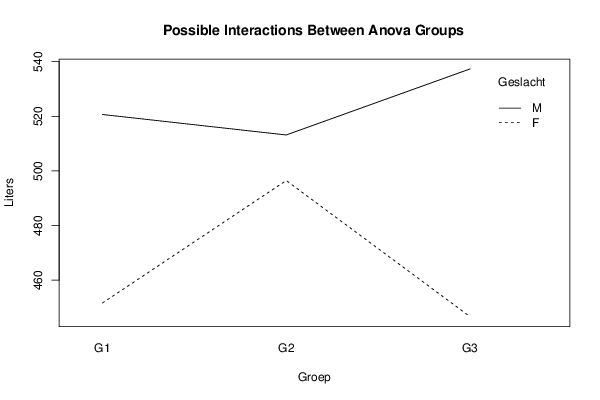
interaction.plot(xdf$A, xdf$B, xdf$R, xlab=V2, ylab=V1, trace.label=V3, main='Possible Interactions Between Anova Groups')
dev.off()
if(intercept==TRUE){
thsd<-TukeyHSD(aov.xdf)
names(thsd) <- c(V2, V3, paste(V2, ':', V3, sep=''))
bitmap(file='TukeyHSDPlot.png')
layout(matrix(c(0,0,1,2,1,2,0,0,3,3,3,3), 2,6))
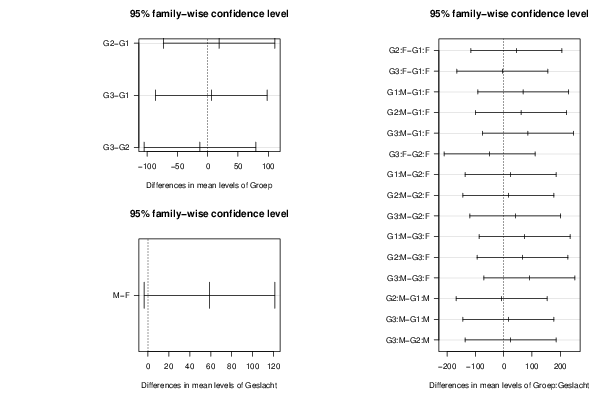
plot(thsd, las=1)
dev.off()
}
if(intercept==TRUE){
ntables<-length(names(thsd))
a<-table.start()
a<-table.row.start(a)
a<-table.element(a,'Tukey Honest Significant Difference Comparisons', 5,TRUE)
a<-table.row.end(a)
a<-table.row.start(a)
a<-table.element(a, ' ', 1, TRUE)
for(i in 1:4){
a<-table.element(a,colnames(thsd[[1]])[i], 1, TRUE)
}
a<-table.row.end(a)
for(nt in 1:ntables){
for(i in 1:length(rownames(thsd[[nt]]))){
a<-table.row.start(a)
a<-table.element(a,rownames(thsd[[nt]])[i], 1, TRUE)
for(j in 1:4){
a<-table.element(a,signif(thsd[[nt]][i,j], digits=5), 1, FALSE)
}
a<-table.row.end(a)
}
} # end nt
a<-table.end(a)
table.save(a,file='hsdtable.tab')
}#end if hsd tables
if(intercept==FALSE){
a<-table.start()
a<-table.row.start(a)
a<-table.element(a,'TukeyHSD Message', 1,TRUE)
a<-table.row.end(a)
a<-table.start()
a<-table.row.start(a)
a<-table.element(a,'Must Include Intercept to use Tukey Test ', 1, FALSE)
a<-table.row.end(a)
a<-table.end(a)
table.save(a,file='mytable2.tab')
}
library(car)
lt.lmxdf<-levene.test(lmout)
a<-table.start()
a<-table.row.start(a)
a<-table.element(a,'Levenes Test for Homogeneity of Variance', 4,TRUE)
a<-table.row.end(a)
a<-table.row.start(a)
a<-table.element(a,' ', 1, TRUE)
for (i in 1:3){
a<-table.element(a,names(lt.lmxdf)[i], 1, FALSE)
}
a<-table.row.end(a)
a<-table.row.start(a)
a<-table.element(a,'Group', 1, TRUE)
for (i in 1:3){
a<-table.element(a,signif(lt.lmxdf[[i]][1], digits=5), 1, FALSE)
}
a<-table.row.end(a)
a<-table.row.start(a)
a<-table.element(a,' ', 1, TRUE)
a<-table.element(a,lt.lmxdf[[1]][2], 1, FALSE)
a<-table.element(a,' ', 1, FALSE)
a<-table.row.end(a)
a<-table.end(a)
table.save(a,file='mytable3.tab')