Free Statistics

of Irreproducible Research!

Author's title

Author*The author of this computation has been verified*
R Software Modulerwasp_multipleregression.wasp
Title produced by softwareMultiple Regression
Date of computationMon, 19 Nov 2012 06:06:00 -0500
Cite this page as followsStatistical Computations at FreeStatistics.org, Office for Research Development and Education, URL https://freestatistics.org/blog/index.php?v=date/2012/Nov/19/t1353323209lsgz6p0uh279qcn.htm/, Retrieved Sun, 28 Apr 2024 14:18:08 +0000
Statistical Computations at FreeStatistics.org, Office for Research Development and Education, URL https://freestatistics.org/blog/index.php?pk=190437, Retrieved Sun, 28 Apr 2024 14:18:08 +0000
QR Codes:

Original text written by user:
IsPrivate?No (this computation is public)
User-defined keywords
Estimated Impact100
Family? (F = Feedback message, R = changed R code, M = changed R Module, P = changed Parameters, D = changed Data)
-     [Multiple Regression] [Decreasing Compet...] [2010-11-17 09:04:39] [b98453cac15ba1066b407e146608df68]
- R  D    [Multiple Regression] [WS 7 2] [2012-11-19 11:06:00] [af500d8a3ad66c35fc813daefbed0920] [Current]
Feedback Forum

Post a new message
Dataseries X:
35.323	186.577	186.59
35.478	244.642	244.665
4.39	248.18	248.18
41.667	253.568	253.568
22.173	171.239	171.242
28.021	413.945	413.971
18.109	216.89	216.89
13.962	227.901	227.901
40.174	259.813	259.823
16.065	148.438	148.438
18.145	240.984	241.013
18.439	206.248	206.248
10.603	108.873	108.908
34.811	267.945	267.952
69.064	314.171	314.219
51.202	235.115	235.115
14.786	203.023	203.027
33.01	365.415	365.415
81.101	350.881	350.933
89.232	263.287	263.304
21.223	738.743	738.751
15.173	959.072	959.073
241.66	483.618	483.828
26.848	212.996	213.016
8.752	177.326	177.341
60.535	352.594	352.622
60.535	352.594	352.622
26.052	217.305	217.307


Summary of computational transaction
Raw Inputview raw input (R code)
Raw Outputview raw output of R engine
Computing time8 seconds
R Server'Sir Maurice George Kendall' @ kendall.wessa.net

\begin{tabular}{lllllllll}
\hline
Summary of computational transaction \tabularnewline
Raw Input & view raw input (R code)  \tabularnewline
Raw Output & view raw output of R engine  \tabularnewline
Computing time & 8 seconds \tabularnewline
R Server & 'Sir Maurice George Kendall' @ kendall.wessa.net \tabularnewline
\hline
\end{tabular}
%Source: https://freestatistics.org/blog/index.php?pk=190437&T=0

[TABLE]
[ROW][C]Summary of computational transaction[/C][/ROW]
[ROW][C]Raw Input[/C][C]view raw input (R code) [/C][/ROW]
[ROW][C]Raw Output[/C][C]view raw output of R engine [/C][/ROW]
[ROW][C]Computing time[/C][C]8 seconds[/C][/ROW]
[ROW][C]R Server[/C][C]'Sir Maurice George Kendall' @ kendall.wessa.net[/C][/ROW]
[/TABLE]
Source: https://freestatistics.org/blog/index.php?pk=190437&T=0

Globally Unique Identifier (entire table): ba.freestatistics.org/blog/index.php?pk=190437&T=0

As an alternative you can also use a QR Code:  

The GUIDs for individual cells are displayed in the table below:

Summary of computational transaction
Raw Inputview raw input (R code)
Raw Outputview raw output of R engine
Computing time8 seconds
R Server'Sir Maurice George Kendall' @ kendall.wessa.net


Multiple Linear Regression - Estimated Regression Equation
TP[t] = -0.0121356415311825 + 0.000805683855140832TFC[t] + 1.00000036949678TLC[t] + e[t]

\begin{tabular}{lllllllll}
\hline
Multiple Linear Regression - Estimated Regression Equation \tabularnewline
TP[t] =  -0.0121356415311825 +  0.000805683855140832TFC[t] +  1.00000036949678TLC[t]  + e[t] \tabularnewline
\hline
\end{tabular}
%Source: https://freestatistics.org/blog/index.php?pk=190437&T=1

[TABLE]
[ROW][C]Multiple Linear Regression - Estimated Regression Equation[/C][/ROW]
[ROW][C]TP[t] =  -0.0121356415311825 +  0.000805683855140832TFC[t] +  1.00000036949678TLC[t]  + e[t][/C][/ROW]
[/TABLE]
Source: https://freestatistics.org/blog/index.php?pk=190437&T=1

Globally Unique Identifier (entire table): ba.freestatistics.org/blog/index.php?pk=190437&T=1

As an alternative you can also use a QR Code:  

The GUIDs for individual cells are displayed in the table below:

Multiple Linear Regression - Estimated Regression Equation
TP[t] = -0.0121356415311825 + 0.000805683855140832TFC[t] + 1.00000036949678TLC[t] + e[t]


Multiple Linear Regression - Ordinary Least Squares
VariableParameterS.D.T-STATH0: parameter = 02-tail p-value1-tail p-value
(Intercept)-0.01213564153118250.006854-1.77070.0888060.044403
TFC0.0008056838551408327.6e-0510.600600
TLC1.000000369496781.9e-0551897.381700

\begin{tabular}{lllllllll}
\hline
Multiple Linear Regression - Ordinary Least Squares \tabularnewline
Variable & Parameter & S.D. & T-STATH0: parameter = 0 & 2-tail p-value & 1-tail p-value \tabularnewline
(Intercept) & -0.0121356415311825 & 0.006854 & -1.7707 & 0.088806 & 0.044403 \tabularnewline
TFC & 0.000805683855140832 & 7.6e-05 & 10.6006 & 0 & 0 \tabularnewline
TLC & 1.00000036949678 & 1.9e-05 & 51897.3817 & 0 & 0 \tabularnewline
\hline
\end{tabular}
%Source: https://freestatistics.org/blog/index.php?pk=190437&T=2

[TABLE]
[ROW][C]Multiple Linear Regression - Ordinary Least Squares[/C][/ROW]
[ROW][C]Variable[/C][C]Parameter[/C][C]S.D.[/C][C]T-STATH0: parameter = 0[/C][C]2-tail p-value[/C][C]1-tail p-value[/C][/ROW]
[ROW][C](Intercept)[/C][C]-0.0121356415311825[/C][C]0.006854[/C][C]-1.7707[/C][C]0.088806[/C][C]0.044403[/C][/ROW]
[ROW][C]TFC[/C][C]0.000805683855140832[/C][C]7.6e-05[/C][C]10.6006[/C][C]0[/C][C]0[/C][/ROW]
[ROW][C]TLC[/C][C]1.00000036949678[/C][C]1.9e-05[/C][C]51897.3817[/C][C]0[/C][C]0[/C][/ROW]
[/TABLE]
Source: https://freestatistics.org/blog/index.php?pk=190437&T=2

Globally Unique Identifier (entire table): ba.freestatistics.org/blog/index.php?pk=190437&T=2

As an alternative you can also use a QR Code:  

The GUIDs for individual cells are displayed in the table below:

Multiple Linear Regression - Ordinary Least Squares
VariableParameterS.D.T-STATH0: parameter = 02-tail p-value1-tail p-value
(Intercept)-0.01213564153118250.006854-1.77070.0888060.044403
TFC0.0008056838551408327.6e-0510.600600
TLC1.000000369496781.9e-0551897.381700


Multiple Linear Regression - Regression Statistics
Multiple R0.999999995538385
R-squared0.999999991076769
Adjusted R-squared0.999999990362911
F-TEST (value)1400837944.98238
F-TEST (DF numerator)2
F-TEST (DF denominator)25
p-value0
Multiple Linear Regression - Residual Statistics
Residual Standard Deviation0.017464285786839
Sum Squared Residuals0.00762503195110968

\begin{tabular}{lllllllll}
\hline
Multiple Linear Regression - Regression Statistics \tabularnewline
Multiple R & 0.999999995538385 \tabularnewline
R-squared & 0.999999991076769 \tabularnewline
Adjusted R-squared & 0.999999990362911 \tabularnewline
F-TEST (value) & 1400837944.98238 \tabularnewline
F-TEST (DF numerator) & 2 \tabularnewline
F-TEST (DF denominator) & 25 \tabularnewline
p-value & 0 \tabularnewline
Multiple Linear Regression - Residual Statistics \tabularnewline
Residual Standard Deviation & 0.017464285786839 \tabularnewline
Sum Squared Residuals & 0.00762503195110968 \tabularnewline
\hline
\end{tabular}
%Source: https://freestatistics.org/blog/index.php?pk=190437&T=3

[TABLE]
[ROW][C]Multiple Linear Regression - Regression Statistics[/C][/ROW]
[ROW][C]Multiple R[/C][C]0.999999995538385[/C][/ROW]
[ROW][C]R-squared[/C][C]0.999999991076769[/C][/ROW]
[ROW][C]Adjusted R-squared[/C][C]0.999999990362911[/C][/ROW]
[ROW][C]F-TEST (value)[/C][C]1400837944.98238[/C][/ROW]
[ROW][C]F-TEST (DF numerator)[/C][C]2[/C][/ROW]
[ROW][C]F-TEST (DF denominator)[/C][C]25[/C][/ROW]
[ROW][C]p-value[/C][C]0[/C][/ROW]
[ROW][C]Multiple Linear Regression - Residual Statistics[/C][/ROW]
[ROW][C]Residual Standard Deviation[/C][C]0.017464285786839[/C][/ROW]
[ROW][C]Sum Squared Residuals[/C][C]0.00762503195110968[/C][/ROW]
[/TABLE]
Source: https://freestatistics.org/blog/index.php?pk=190437&T=3

Globally Unique Identifier (entire table): ba.freestatistics.org/blog/index.php?pk=190437&T=3

As an alternative you can also use a QR Code:  

The GUIDs for individual cells are displayed in the table below:

Multiple Linear Regression - Regression Statistics
Multiple R0.999999995538385
R-squared0.999999991076769
Adjusted R-squared0.999999990362911
F-TEST (value)1400837944.98238
F-TEST (DF numerator)2
F-TEST (DF denominator)25
p-value0
Multiple Linear Regression - Residual Statistics
Residual Standard Deviation0.017464285786839
Sum Squared Residuals0.00762503195110968


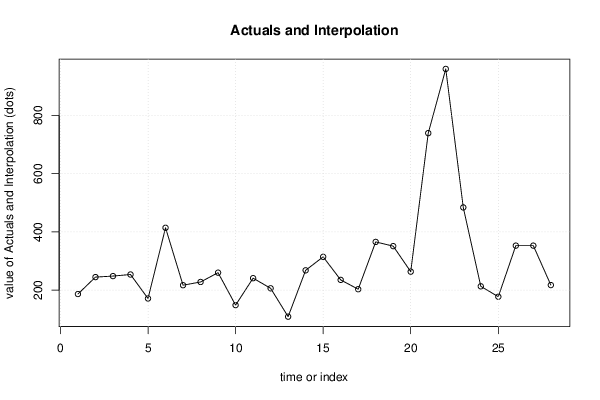
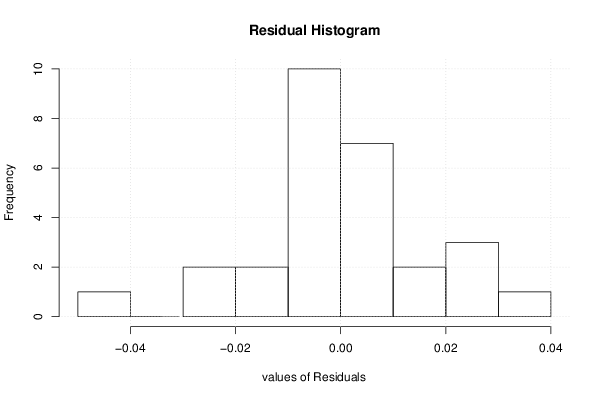
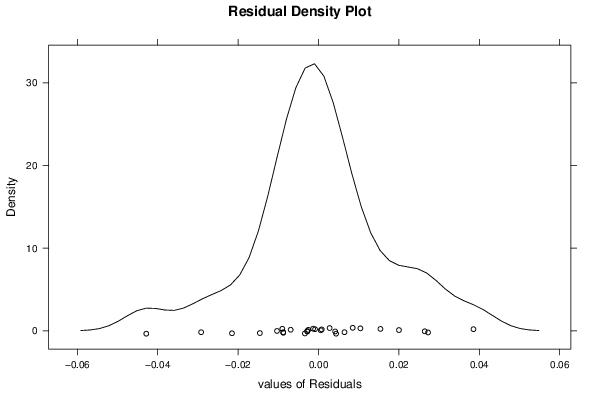
Multiple Linear Regression - Actuals, Interpolation, and Residuals
Time or IndexActualsInterpolationForecastResidualsPrediction Error
1186.59186.593392468886-0.00339246888560547
2244.665244.6585388047140.00646119528615234
3248.18248.1714930123050.00850698769533448
4253.568253.589528480222-0.0215284802215854
5171.242171.244792058849-0.00279205884871004
6413.971413.955593377120.0154066228798805
7216.89216.892534627559-0.00253462755911449
8227.901227.9001975251410.000802474859051047
9259.823259.833327901733-0.010327901733285
10148.438148.438862516965-0.000862516965367679
11241.013240.9865725348330.0264274651665664
12206.248206.250796571047-0.00279657104653548
13108.908108.8694472526080.0385527473917054
14267.952267.961010023966-0.00901002396600199
15314.219314.2146241934140.00437580658550967
16235.115235.144203857456-0.0292038574561778
17203.027203.0228522162970.00414778370341505
18365.415365.429595002195-0.0145950021944671
19350.933350.934335774206-0.00133577420574537
20263.304263.346854423931-0.0428544239306001
21738.751738.748236350090.00276364991047115
22959.073959.0724433736230.000556626377130978
23483.828483.8007446141980.027255385801997
24213.016213.0055740599490.0104259400512732
25177.341177.3209812249560.0200187750442203
26352.622352.630766712989-0.00876671298891675
27352.622352.630766712989-0.00876671298891675
28217.307217.313934327762-0.00693432776167822

\begin{tabular}{lllllllll}
\hline
Multiple Linear Regression - Actuals, Interpolation, and Residuals \tabularnewline
Time or Index & Actuals & InterpolationForecast & ResidualsPrediction Error \tabularnewline
1 & 186.59 & 186.593392468886 & -0.00339246888560547 \tabularnewline
2 & 244.665 & 244.658538804714 & 0.00646119528615234 \tabularnewline
3 & 248.18 & 248.171493012305 & 0.00850698769533448 \tabularnewline
4 & 253.568 & 253.589528480222 & -0.0215284802215854 \tabularnewline
5 & 171.242 & 171.244792058849 & -0.00279205884871004 \tabularnewline
6 & 413.971 & 413.95559337712 & 0.0154066228798805 \tabularnewline
7 & 216.89 & 216.892534627559 & -0.00253462755911449 \tabularnewline
8 & 227.901 & 227.900197525141 & 0.000802474859051047 \tabularnewline
9 & 259.823 & 259.833327901733 & -0.010327901733285 \tabularnewline
10 & 148.438 & 148.438862516965 & -0.000862516965367679 \tabularnewline
11 & 241.013 & 240.986572534833 & 0.0264274651665664 \tabularnewline
12 & 206.248 & 206.250796571047 & -0.00279657104653548 \tabularnewline
13 & 108.908 & 108.869447252608 & 0.0385527473917054 \tabularnewline
14 & 267.952 & 267.961010023966 & -0.00901002396600199 \tabularnewline
15 & 314.219 & 314.214624193414 & 0.00437580658550967 \tabularnewline
16 & 235.115 & 235.144203857456 & -0.0292038574561778 \tabularnewline
17 & 203.027 & 203.022852216297 & 0.00414778370341505 \tabularnewline
18 & 365.415 & 365.429595002195 & -0.0145950021944671 \tabularnewline
19 & 350.933 & 350.934335774206 & -0.00133577420574537 \tabularnewline
20 & 263.304 & 263.346854423931 & -0.0428544239306001 \tabularnewline
21 & 738.751 & 738.74823635009 & 0.00276364991047115 \tabularnewline
22 & 959.073 & 959.072443373623 & 0.000556626377130978 \tabularnewline
23 & 483.828 & 483.800744614198 & 0.027255385801997 \tabularnewline
24 & 213.016 & 213.005574059949 & 0.0104259400512732 \tabularnewline
25 & 177.341 & 177.320981224956 & 0.0200187750442203 \tabularnewline
26 & 352.622 & 352.630766712989 & -0.00876671298891675 \tabularnewline
27 & 352.622 & 352.630766712989 & -0.00876671298891675 \tabularnewline
28 & 217.307 & 217.313934327762 & -0.00693432776167822 \tabularnewline
\hline
\end{tabular}
%Source: https://freestatistics.org/blog/index.php?pk=190437&T=4

[TABLE]
[ROW][C]Multiple Linear Regression - Actuals, Interpolation, and Residuals[/C][/ROW]
[ROW][C]Time or Index[/C][C]Actuals[/C][C]InterpolationForecast[/C][C]ResidualsPrediction Error[/C][/ROW]
[ROW][C]1[/C][C]186.59[/C][C]186.593392468886[/C][C]-0.00339246888560547[/C][/ROW]
[ROW][C]2[/C][C]244.665[/C][C]244.658538804714[/C][C]0.00646119528615234[/C][/ROW]
[ROW][C]3[/C][C]248.18[/C][C]248.171493012305[/C][C]0.00850698769533448[/C][/ROW]
[ROW][C]4[/C][C]253.568[/C][C]253.589528480222[/C][C]-0.0215284802215854[/C][/ROW]
[ROW][C]5[/C][C]171.242[/C][C]171.244792058849[/C][C]-0.00279205884871004[/C][/ROW]
[ROW][C]6[/C][C]413.971[/C][C]413.95559337712[/C][C]0.0154066228798805[/C][/ROW]
[ROW][C]7[/C][C]216.89[/C][C]216.892534627559[/C][C]-0.00253462755911449[/C][/ROW]
[ROW][C]8[/C][C]227.901[/C][C]227.900197525141[/C][C]0.000802474859051047[/C][/ROW]
[ROW][C]9[/C][C]259.823[/C][C]259.833327901733[/C][C]-0.010327901733285[/C][/ROW]
[ROW][C]10[/C][C]148.438[/C][C]148.438862516965[/C][C]-0.000862516965367679[/C][/ROW]
[ROW][C]11[/C][C]241.013[/C][C]240.986572534833[/C][C]0.0264274651665664[/C][/ROW]
[ROW][C]12[/C][C]206.248[/C][C]206.250796571047[/C][C]-0.00279657104653548[/C][/ROW]
[ROW][C]13[/C][C]108.908[/C][C]108.869447252608[/C][C]0.0385527473917054[/C][/ROW]
[ROW][C]14[/C][C]267.952[/C][C]267.961010023966[/C][C]-0.00901002396600199[/C][/ROW]
[ROW][C]15[/C][C]314.219[/C][C]314.214624193414[/C][C]0.00437580658550967[/C][/ROW]
[ROW][C]16[/C][C]235.115[/C][C]235.144203857456[/C][C]-0.0292038574561778[/C][/ROW]
[ROW][C]17[/C][C]203.027[/C][C]203.022852216297[/C][C]0.00414778370341505[/C][/ROW]
[ROW][C]18[/C][C]365.415[/C][C]365.429595002195[/C][C]-0.0145950021944671[/C][/ROW]
[ROW][C]19[/C][C]350.933[/C][C]350.934335774206[/C][C]-0.00133577420574537[/C][/ROW]
[ROW][C]20[/C][C]263.304[/C][C]263.346854423931[/C][C]-0.0428544239306001[/C][/ROW]
[ROW][C]21[/C][C]738.751[/C][C]738.74823635009[/C][C]0.00276364991047115[/C][/ROW]
[ROW][C]22[/C][C]959.073[/C][C]959.072443373623[/C][C]0.000556626377130978[/C][/ROW]
[ROW][C]23[/C][C]483.828[/C][C]483.800744614198[/C][C]0.027255385801997[/C][/ROW]
[ROW][C]24[/C][C]213.016[/C][C]213.005574059949[/C][C]0.0104259400512732[/C][/ROW]
[ROW][C]25[/C][C]177.341[/C][C]177.320981224956[/C][C]0.0200187750442203[/C][/ROW]
[ROW][C]26[/C][C]352.622[/C][C]352.630766712989[/C][C]-0.00876671298891675[/C][/ROW]
[ROW][C]27[/C][C]352.622[/C][C]352.630766712989[/C][C]-0.00876671298891675[/C][/ROW]
[ROW][C]28[/C][C]217.307[/C][C]217.313934327762[/C][C]-0.00693432776167822[/C][/ROW]
[/TABLE]
Source: https://freestatistics.org/blog/index.php?pk=190437&T=4

Globally Unique Identifier (entire table): ba.freestatistics.org/blog/index.php?pk=190437&T=4

As an alternative you can also use a QR Code:  

The GUIDs for individual cells are displayed in the table below:

Multiple Linear Regression - Actuals, Interpolation, and Residuals
Time or IndexActualsInterpolationForecastResidualsPrediction Error
1186.59186.593392468886-0.00339246888560547
2244.665244.6585388047140.00646119528615234
3248.18248.1714930123050.00850698769533448
4253.568253.589528480222-0.0215284802215854
5171.242171.244792058849-0.00279205884871004
6413.971413.955593377120.0154066228798805
7216.89216.892534627559-0.00253462755911449
8227.901227.9001975251410.000802474859051047
9259.823259.833327901733-0.010327901733285
10148.438148.438862516965-0.000862516965367679
11241.013240.9865725348330.0264274651665664
12206.248206.250796571047-0.00279657104653548
13108.908108.8694472526080.0385527473917054
14267.952267.961010023966-0.00901002396600199
15314.219314.2146241934140.00437580658550967
16235.115235.144203857456-0.0292038574561778
17203.027203.0228522162970.00414778370341505
18365.415365.429595002195-0.0145950021944671
19350.933350.934335774206-0.00133577420574537
20263.304263.346854423931-0.0428544239306001
21738.751738.748236350090.00276364991047115
22959.073959.0724433736230.000556626377130978
23483.828483.8007446141980.027255385801997
24213.016213.0055740599490.0104259400512732
25177.341177.3209812249560.0200187750442203
26352.622352.630766712989-0.00876671298891675
27352.622352.630766712989-0.00876671298891675
28217.307217.313934327762-0.00693432776167822


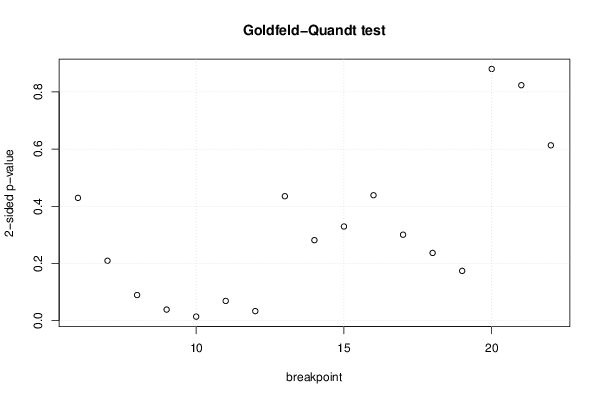
Goldfeld-Quandt test for Heteroskedasticity
p-valuesAlternative Hypothesis
breakpoint indexgreater2-sidedless
60.2146768015093560.4293536030187130.785323198490644
70.1047587032719210.2095174065438420.895241296728079
80.04484013988921390.08968027977842780.955159860110786
90.01936740562877270.03873481125754530.980632594371227
100.007017156042114620.01403431208422920.992982843957885
110.03451138732117930.06902277464235860.965488612678821
120.01668164309439840.03336328618879670.983318356905602
130.2175880127703170.4351760255406350.782411987229683
140.1407508916902660.2815017833805320.859249108309734
150.164630015542420.329260031084840.83536998445758
160.2193373400794770.4386746801589550.780662659920523
170.1502903754142520.3005807508285040.849709624585748
180.1184273470322280.2368546940644560.881572652967772
190.08708285247249160.1741657049449830.912917147527508
200.5598577691187950.880284461762410.440142230881205
210.4117035710860710.8234071421721430.588296428913929
220.6933888792975750.6132222414048510.306611120702425

\begin{tabular}{lllllllll}
\hline
Goldfeld-Quandt test for Heteroskedasticity \tabularnewline
p-values & Alternative Hypothesis \tabularnewline
breakpoint index & greater & 2-sided & less \tabularnewline
6 & 0.214676801509356 & 0.429353603018713 & 0.785323198490644 \tabularnewline
7 & 0.104758703271921 & 0.209517406543842 & 0.895241296728079 \tabularnewline
8 & 0.0448401398892139 & 0.0896802797784278 & 0.955159860110786 \tabularnewline
9 & 0.0193674056287727 & 0.0387348112575453 & 0.980632594371227 \tabularnewline
10 & 0.00701715604211462 & 0.0140343120842292 & 0.992982843957885 \tabularnewline
11 & 0.0345113873211793 & 0.0690227746423586 & 0.965488612678821 \tabularnewline
12 & 0.0166816430943984 & 0.0333632861887967 & 0.983318356905602 \tabularnewline
13 & 0.217588012770317 & 0.435176025540635 & 0.782411987229683 \tabularnewline
14 & 0.140750891690266 & 0.281501783380532 & 0.859249108309734 \tabularnewline
15 & 0.16463001554242 & 0.32926003108484 & 0.83536998445758 \tabularnewline
16 & 0.219337340079477 & 0.438674680158955 & 0.780662659920523 \tabularnewline
17 & 0.150290375414252 & 0.300580750828504 & 0.849709624585748 \tabularnewline
18 & 0.118427347032228 & 0.236854694064456 & 0.881572652967772 \tabularnewline
19 & 0.0870828524724916 & 0.174165704944983 & 0.912917147527508 \tabularnewline
20 & 0.559857769118795 & 0.88028446176241 & 0.440142230881205 \tabularnewline
21 & 0.411703571086071 & 0.823407142172143 & 0.588296428913929 \tabularnewline
22 & 0.693388879297575 & 0.613222241404851 & 0.306611120702425 \tabularnewline
\hline
\end{tabular}
%Source: https://freestatistics.org/blog/index.php?pk=190437&T=5

[TABLE]
[ROW][C]Goldfeld-Quandt test for Heteroskedasticity[/C][/ROW]
[ROW][C]p-values[/C][C]Alternative Hypothesis[/C][/ROW]
[ROW][C]breakpoint index[/C][C]greater[/C][C]2-sided[/C][C]less[/C][/ROW]
[ROW][C]6[/C][C]0.214676801509356[/C][C]0.429353603018713[/C][C]0.785323198490644[/C][/ROW]
[ROW][C]7[/C][C]0.104758703271921[/C][C]0.209517406543842[/C][C]0.895241296728079[/C][/ROW]
[ROW][C]8[/C][C]0.0448401398892139[/C][C]0.0896802797784278[/C][C]0.955159860110786[/C][/ROW]
[ROW][C]9[/C][C]0.0193674056287727[/C][C]0.0387348112575453[/C][C]0.980632594371227[/C][/ROW]
[ROW][C]10[/C][C]0.00701715604211462[/C][C]0.0140343120842292[/C][C]0.992982843957885[/C][/ROW]
[ROW][C]11[/C][C]0.0345113873211793[/C][C]0.0690227746423586[/C][C]0.965488612678821[/C][/ROW]
[ROW][C]12[/C][C]0.0166816430943984[/C][C]0.0333632861887967[/C][C]0.983318356905602[/C][/ROW]
[ROW][C]13[/C][C]0.217588012770317[/C][C]0.435176025540635[/C][C]0.782411987229683[/C][/ROW]
[ROW][C]14[/C][C]0.140750891690266[/C][C]0.281501783380532[/C][C]0.859249108309734[/C][/ROW]
[ROW][C]15[/C][C]0.16463001554242[/C][C]0.32926003108484[/C][C]0.83536998445758[/C][/ROW]
[ROW][C]16[/C][C]0.219337340079477[/C][C]0.438674680158955[/C][C]0.780662659920523[/C][/ROW]
[ROW][C]17[/C][C]0.150290375414252[/C][C]0.300580750828504[/C][C]0.849709624585748[/C][/ROW]
[ROW][C]18[/C][C]0.118427347032228[/C][C]0.236854694064456[/C][C]0.881572652967772[/C][/ROW]
[ROW][C]19[/C][C]0.0870828524724916[/C][C]0.174165704944983[/C][C]0.912917147527508[/C][/ROW]
[ROW][C]20[/C][C]0.559857769118795[/C][C]0.88028446176241[/C][C]0.440142230881205[/C][/ROW]
[ROW][C]21[/C][C]0.411703571086071[/C][C]0.823407142172143[/C][C]0.588296428913929[/C][/ROW]
[ROW][C]22[/C][C]0.693388879297575[/C][C]0.613222241404851[/C][C]0.306611120702425[/C][/ROW]
[/TABLE]
Source: https://freestatistics.org/blog/index.php?pk=190437&T=5

Globally Unique Identifier (entire table): ba.freestatistics.org/blog/index.php?pk=190437&T=5

As an alternative you can also use a QR Code:  

The GUIDs for individual cells are displayed in the table below:

Goldfeld-Quandt test for Heteroskedasticity
p-valuesAlternative Hypothesis
breakpoint indexgreater2-sidedless
60.2146768015093560.4293536030187130.785323198490644
70.1047587032719210.2095174065438420.895241296728079
80.04484013988921390.08968027977842780.955159860110786
90.01936740562877270.03873481125754530.980632594371227
100.007017156042114620.01403431208422920.992982843957885
110.03451138732117930.06902277464235860.965488612678821
120.01668164309439840.03336328618879670.983318356905602
130.2175880127703170.4351760255406350.782411987229683
140.1407508916902660.2815017833805320.859249108309734
150.164630015542420.329260031084840.83536998445758
160.2193373400794770.4386746801589550.780662659920523
170.1502903754142520.3005807508285040.849709624585748
180.1184273470322280.2368546940644560.881572652967772
190.08708285247249160.1741657049449830.912917147527508
200.5598577691187950.880284461762410.440142230881205
210.4117035710860710.8234071421721430.588296428913929
220.6933888792975750.6132222414048510.306611120702425


Meta Analysis of Goldfeld-Quandt test for Heteroskedasticity
Description# significant tests% significant testsOK/NOK
1% type I error level00OK
5% type I error level30.176470588235294NOK
10% type I error level50.294117647058824NOK

\begin{tabular}{lllllllll}
\hline
Meta Analysis of Goldfeld-Quandt test for Heteroskedasticity \tabularnewline
Description & # significant tests & % significant tests & OK/NOK \tabularnewline
1% type I error level & 0 & 0 & OK \tabularnewline
5% type I error level & 3 & 0.176470588235294 & NOK \tabularnewline
10% type I error level & 5 & 0.294117647058824 & NOK \tabularnewline
\hline
\end{tabular}
%Source: https://freestatistics.org/blog/index.php?pk=190437&T=6

[TABLE]
[ROW][C]Meta Analysis of Goldfeld-Quandt test for Heteroskedasticity[/C][/ROW]
[ROW][C]Description[/C][C]# significant tests[/C][C]% significant tests[/C][C]OK/NOK[/C][/ROW]
[ROW][C]1% type I error level[/C][C]0[/C][C]0[/C][C]OK[/C][/ROW]
[ROW][C]5% type I error level[/C][C]3[/C][C]0.176470588235294[/C][C]NOK[/C][/ROW]
[ROW][C]10% type I error level[/C][C]5[/C][C]0.294117647058824[/C][C]NOK[/C][/ROW]
[/TABLE]
Source: https://freestatistics.org/blog/index.php?pk=190437&T=6

Globally Unique Identifier (entire table): ba.freestatistics.org/blog/index.php?pk=190437&T=6

As an alternative you can also use a QR Code:  

The GUIDs for individual cells are displayed in the table below:

Meta Analysis of Goldfeld-Quandt test for Heteroskedasticity
Description# significant tests% significant testsOK/NOK
1% type I error level00OK
5% type I error level30.176470588235294NOK
10% type I error level50.294117647058824NOK


Parameters (Session):
par1 = 4 ; par2 = Do not include Seasonal Dummies ; par3 = No Linear Trend ;
Parameters (R input):
par1 = 3 ; par2 = Do not include Seasonal Dummies ; par3 = No Linear Trend ;
R code (references can be found in the software module):
library(lattice)
library(lmtest)
n25 <- 25 #minimum number of obs. for Goldfeld-Quandt test
par1 <- as.numeric(par1)
x <- t(y)
k <- length(x[1,])
n <- length(x[,1])
x1 <- cbind(x[,par1], x[,1:k!=par1])
mycolnames <- c(colnames(x)[par1], colnames(x)[1:k!=par1])
colnames(x1) <- mycolnames #colnames(x)[par1]
x <- x1
if (par3 == 'First Differences'){
x2 <- array(0, dim=c(n-1,k), dimnames=list(1:(n-1), paste('(1-B)',colnames(x),sep='')))
for (i in 1:n-1) {
for (j in 1:k) {
x2[i,j] <- x[i+1,j] - x[i,j]
}
}
x <- x2
}
if (par2 == 'Include Monthly Dummies'){
x2 <- array(0, dim=c(n,11), dimnames=list(1:n, paste('M', seq(1:11), sep ='')))
for (i in 1:11){
x2[seq(i,n,12),i] <- 1
}
x <- cbind(x, x2)
}
if (par2 == 'Include Quarterly Dummies'){
x2 <- array(0, dim=c(n,3), dimnames=list(1:n, paste('Q', seq(1:3), sep ='')))
for (i in 1:3){
x2[seq(i,n,4),i] <- 1
}
x <- cbind(x, x2)
}
k <- length(x[1,])
if (par3 == 'Linear Trend'){
x <- cbind(x, c(1:n))
colnames(x)[k+1] <- 't'
}
x
k <- length(x[1,])
df <- as.data.frame(x)
(mylm <- lm(df))
(mysum <- summary(mylm))
if (n > n25) {
kp3 <- k + 3
nmkm3 <- n - k - 3
gqarr <- array(NA, dim=c(nmkm3-kp3+1,3))
numgqtests <- 0
numsignificant1 <- 0
numsignificant5 <- 0
numsignificant10 <- 0
for (mypoint in kp3:nmkm3) {
j <- 0
numgqtests <- numgqtests + 1
for (myalt in c('greater', 'two.sided', 'less')) {
j <- j + 1
gqarr[mypoint-kp3+1,j] <- gqtest(mylm, point=mypoint, alternative=myalt)$p.value
}
if (gqarr[mypoint-kp3+1,2] < 0.01) numsignificant1 <- numsignificant1 + 1
if (gqarr[mypoint-kp3+1,2] < 0.05) numsignificant5 <- numsignificant5 + 1
if (gqarr[mypoint-kp3+1,2] < 0.10) numsignificant10 <- numsignificant10 + 1
}
gqarr
}
bitmap(file='test0.png')
plot(x[,1], type='l', main='Actuals and Interpolation', ylab='value of Actuals and Interpolation (dots)', xlab='time or index')
points(x[,1]-mysum$resid)
grid()
dev.off()
bitmap(file='test1.png')
plot(mysum$resid, type='b', pch=19, main='Residuals', ylab='value of Residuals', xlab='time or index')
grid()
dev.off()
bitmap(file='test2.png')
hist(mysum$resid, main='Residual Histogram', xlab='values of Residuals')
grid()
dev.off()
bitmap(file='test3.png')
densityplot(~mysum$resid,col='black',main='Residual Density Plot', xlab='values of Residuals')
dev.off()
bitmap(file='test4.png')
qqnorm(mysum$resid, main='Residual Normal Q-Q Plot')
qqline(mysum$resid)
grid()
dev.off()
(myerror <- as.ts(mysum$resid))
bitmap(file='test5.png')
dum <- cbind(lag(myerror,k=1),myerror)
dum
dum1 <- dum[2:length(myerror),]
dum1
z <- as.data.frame(dum1)
z
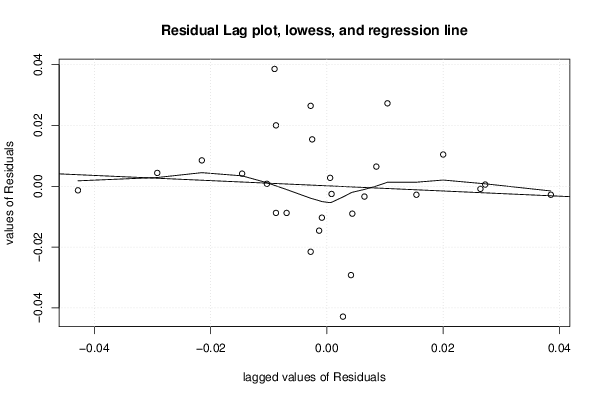
plot(z,main=paste('Residual Lag plot, lowess, and regression line'), ylab='values of Residuals', xlab='lagged values of Residuals')
lines(lowess(z))
abline(lm(z))
grid()
dev.off()
bitmap(file='test6.png')
acf(mysum$resid, lag.max=length(mysum$resid)/2, main='Residual Autocorrelation Function')
grid()
dev.off()
bitmap(file='test7.png')
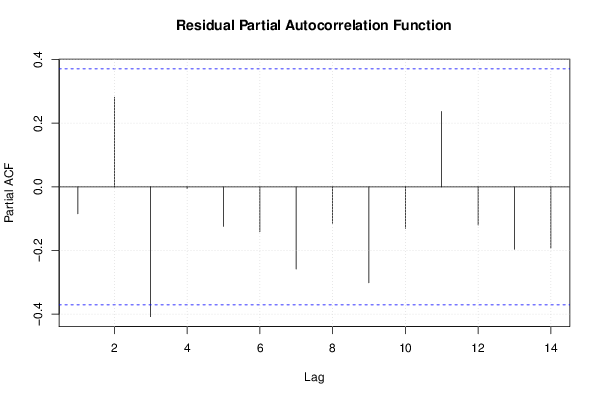
pacf(mysum$resid, lag.max=length(mysum$resid)/2, main='Residual Partial Autocorrelation Function')
grid()
dev.off()
bitmap(file='test8.png')
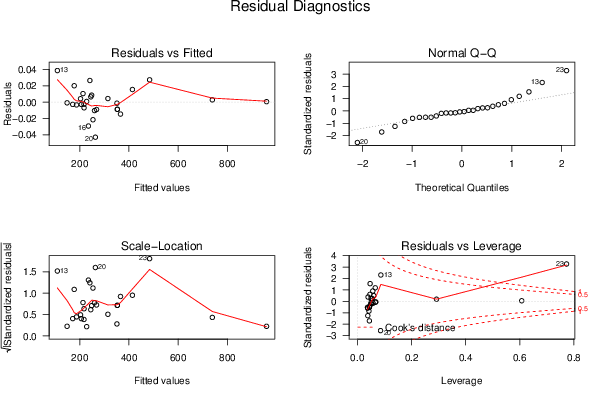
opar <- par(mfrow = c(2,2), oma = c(0, 0, 1.1, 0))
plot(mylm, las = 1, sub='Residual Diagnostics')
par(opar)
dev.off()
if (n > n25) {
bitmap(file='test9.png')
plot(kp3:nmkm3,gqarr[,2], main='Goldfeld-Quandt test',ylab='2-sided p-value',xlab='breakpoint')
grid()
dev.off()
}
load(file='createtable')
a<-table.start()
a<-table.row.start(a)
a<-table.element(a, 'Multiple Linear Regression - Estimated Regression Equation', 1, TRUE)
a<-table.row.end(a)
myeq <- colnames(x)[1]
myeq <- paste(myeq, '[t] = ', sep='')
for (i in 1:k){
if (mysum$coefficients[i,1] > 0) myeq <- paste(myeq, '+', '')
myeq <- paste(myeq, mysum$coefficients[i,1], sep=' ')
if (rownames(mysum$coefficients)[i] != '(Intercept)') {
myeq <- paste(myeq, rownames(mysum$coefficients)[i], sep='')
if (rownames(mysum$coefficients)[i] != 't') myeq <- paste(myeq, '[t]', sep='')
}
}
myeq <- paste(myeq, ' + e[t]')
a<-table.row.start(a)
a<-table.element(a, myeq)
a<-table.row.end(a)
a<-table.end(a)
table.save(a,file='mytable1.tab')
a<-table.start()
a<-table.row.start(a)
a<-table.element(a,hyperlink('ols1.htm','Multiple Linear Regression - Ordinary Least Squares',''), 6, TRUE)
a<-table.row.end(a)
a<-table.row.start(a)
a<-table.element(a,'Variable',header=TRUE)
a<-table.element(a,'Parameter',header=TRUE)
a<-table.element(a,'S.D.',header=TRUE)
a<-table.element(a,'T-STAT
H0: parameter = 0',header=TRUE)
a<-table.element(a,'2-tail p-value',header=TRUE)
a<-table.element(a,'1-tail p-value',header=TRUE)
a<-table.row.end(a)
for (i in 1:k){
a<-table.row.start(a)
a<-table.element(a,rownames(mysum$coefficients)[i],header=TRUE)
a<-table.element(a,mysum$coefficients[i,1])
a<-table.element(a, round(mysum$coefficients[i,2],6))
a<-table.element(a, round(mysum$coefficients[i,3],4))
a<-table.element(a, round(mysum$coefficients[i,4],6))
a<-table.element(a, round(mysum$coefficients[i,4]/2,6))
a<-table.row.end(a)
}
a<-table.end(a)
table.save(a,file='mytable2.tab')
a<-table.start()
a<-table.row.start(a)
a<-table.element(a, 'Multiple Linear Regression - Regression Statistics', 2, TRUE)
a<-table.row.end(a)
a<-table.row.start(a)
a<-table.element(a, 'Multiple R',1,TRUE)
a<-table.element(a, sqrt(mysum$r.squared))
a<-table.row.end(a)
a<-table.row.start(a)
a<-table.element(a, 'R-squared',1,TRUE)
a<-table.element(a, mysum$r.squared)
a<-table.row.end(a)
a<-table.row.start(a)
a<-table.element(a, 'Adjusted R-squared',1,TRUE)
a<-table.element(a, mysum$adj.r.squared)
a<-table.row.end(a)
a<-table.row.start(a)
a<-table.element(a, 'F-TEST (value)',1,TRUE)
a<-table.element(a, mysum$fstatistic[1])
a<-table.row.end(a)
a<-table.row.start(a)
a<-table.element(a, 'F-TEST (DF numerator)',1,TRUE)
a<-table.element(a, mysum$fstatistic[2])
a<-table.row.end(a)
a<-table.row.start(a)
a<-table.element(a, 'F-TEST (DF denominator)',1,TRUE)
a<-table.element(a, mysum$fstatistic[3])
a<-table.row.end(a)
a<-table.row.start(a)
a<-table.element(a, 'p-value',1,TRUE)
a<-table.element(a, 1-pf(mysum$fstatistic[1],mysum$fstatistic[2],mysum$fstatistic[3]))
a<-table.row.end(a)
a<-table.row.start(a)
a<-table.element(a, 'Multiple Linear Regression - Residual Statistics', 2, TRUE)
a<-table.row.end(a)
a<-table.row.start(a)
a<-table.element(a, 'Residual Standard Deviation',1,TRUE)
a<-table.element(a, mysum$sigma)
a<-table.row.end(a)
a<-table.row.start(a)
a<-table.element(a, 'Sum Squared Residuals',1,TRUE)
a<-table.element(a, sum(myerror*myerror))
a<-table.row.end(a)
a<-table.end(a)
table.save(a,file='mytable3.tab')
a<-table.start()
a<-table.row.start(a)
a<-table.element(a, 'Multiple Linear Regression - Actuals, Interpolation, and Residuals', 4, TRUE)
a<-table.row.end(a)
a<-table.row.start(a)
a<-table.element(a, 'Time or Index', 1, TRUE)
a<-table.element(a, 'Actuals', 1, TRUE)
a<-table.element(a, 'Interpolation
Forecast', 1, TRUE)
a<-table.element(a, 'Residuals
Prediction Error', 1, TRUE)
a<-table.row.end(a)
for (i in 1:n) {
a<-table.row.start(a)
a<-table.element(a,i, 1, TRUE)
a<-table.element(a,x[i])
a<-table.element(a,x[i]-mysum$resid[i])
a<-table.element(a,mysum$resid[i])
a<-table.row.end(a)
}
a<-table.end(a)
table.save(a,file='mytable4.tab')
if (n > n25) {
a<-table.start()
a<-table.row.start(a)
a<-table.element(a,'Goldfeld-Quandt test for Heteroskedasticity',4,TRUE)
a<-table.row.end(a)
a<-table.row.start(a)
a<-table.element(a,'p-values',header=TRUE)
a<-table.element(a,'Alternative Hypothesis',3,header=TRUE)
a<-table.row.end(a)
a<-table.row.start(a)
a<-table.element(a,'breakpoint index',header=TRUE)
a<-table.element(a,'greater',header=TRUE)
a<-table.element(a,'2-sided',header=TRUE)
a<-table.element(a,'less',header=TRUE)
a<-table.row.end(a)
for (mypoint in kp3:nmkm3) {
a<-table.row.start(a)
a<-table.element(a,mypoint,header=TRUE)
a<-table.element(a,gqarr[mypoint-kp3+1,1])
a<-table.element(a,gqarr[mypoint-kp3+1,2])
a<-table.element(a,gqarr[mypoint-kp3+1,3])
a<-table.row.end(a)
}
a<-table.end(a)
table.save(a,file='mytable5.tab')
a<-table.start()
a<-table.row.start(a)
a<-table.element(a,'Meta Analysis of Goldfeld-Quandt test for Heteroskedasticity',4,TRUE)
a<-table.row.end(a)
a<-table.row.start(a)
a<-table.element(a,'Description',header=TRUE)
a<-table.element(a,'# significant tests',header=TRUE)
a<-table.element(a,'% significant tests',header=TRUE)
a<-table.element(a,'OK/NOK',header=TRUE)
a<-table.row.end(a)
a<-table.row.start(a)
a<-table.element(a,'1% type I error level',header=TRUE)
a<-table.element(a,numsignificant1)
a<-table.element(a,numsignificant1/numgqtests)
if (numsignificant1/numgqtests < 0.01) dum <- 'OK' else dum <- 'NOK'
a<-table.element(a,dum)
a<-table.row.end(a)
a<-table.row.start(a)
a<-table.element(a,'5% type I error level',header=TRUE)
a<-table.element(a,numsignificant5)
a<-table.element(a,numsignificant5/numgqtests)
if (numsignificant5/numgqtests < 0.05) dum <- 'OK' else dum <- 'NOK'
a<-table.element(a,dum)
a<-table.row.end(a)
a<-table.row.start(a)
a<-table.element(a,'10% type I error level',header=TRUE)
a<-table.element(a,numsignificant10)
a<-table.element(a,numsignificant10/numgqtests)
if (numsignificant10/numgqtests < 0.1) dum <- 'OK' else dum <- 'NOK'
a<-table.element(a,dum)
a<-table.row.end(a)
a<-table.end(a)
table.save(a,file='mytable6.tab')
}