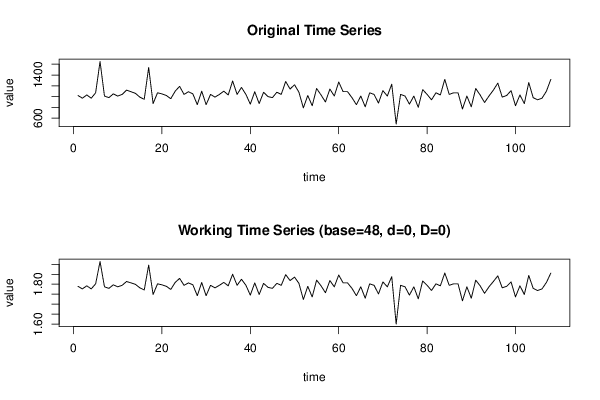
Free Statistics

of Irreproducible Research!

Author's title

Author*Unverified author*
R Software Modulerwasp_autocorrelation.wasp
Title produced by software(Partial) Autocorrelation Function
Date of computationWed, 13 Aug 2014 15:56:04 +0100
Cite this page as followsStatistical Computations at FreeStatistics.org, Office for Research Development and Education, URL https://freestatistics.org/blog/index.php?v=date/2014/Aug/13/t14079417862cvledw1tqk3a6d.htm/, Retrieved Thu, 16 May 2024 04:52:14 +0000
Statistical Computations at FreeStatistics.org, Office for Research Development and Education, URL https://freestatistics.org/blog/index.php?pk=235529, Retrieved Thu, 16 May 2024 04:52:14 +0000
QR Codes:

Original text written by user:
IsPrivate?No (this computation is public)
User-defined keywords
Estimated Impact91
Family? (F = Feedback message, R = changed R code, M = changed R Module, P = changed Parameters, D = changed Data)
-       [(Partial) Autocorrelation Function] [] [2014-08-13 14:56:04] [b3e3d38149b35cb70244b37a39776b3a] [Current]
Feedback Forum

Post a new message
Dataseries X:
1020
970
1030
970
1070
1650
1010
980
1050
1010
1040
1120
1090
1060
990
950
1540
870
1070
1050
1020
960
1100
1190
1040
1090
1050
850
1100
850
1040
990
1040
1100
1030
1290
1040
1170
1040
860
1090
870
1080
1000
980
1080
1040
1280
1140
1220
1080
790
1020
830
1150
1030
900
1140
1010
1270
1090
1090
980
850
1010
810
1070
1040
880
1110
1010
1230
490
1040
1010
860
1010
800
1130
1040
940
1070
1030
1320
1040
1070
1070
770
1010
810
1150
1030
890
1010
1120
1250
990
1020
1110
830
1030
870
1260
980
940
970
1100
1320


Summary of computational transaction
Raw Inputview raw input (R code)
Raw Outputview raw output of R engine
Computing time2 seconds
R Server'Sir Maurice George Kendall' @ kendall.wessa.net

\begin{tabular}{lllllllll}
\hline
Summary of computational transaction \tabularnewline
Raw Input & view raw input (R code)  \tabularnewline
Raw Output & view raw output of R engine  \tabularnewline
Computing time & 2 seconds \tabularnewline
R Server & 'Sir Maurice George Kendall' @ kendall.wessa.net \tabularnewline
\hline
\end{tabular}
%Source: https://freestatistics.org/blog/index.php?pk=235529&T=0

[TABLE]
[ROW][C]Summary of computational transaction[/C][/ROW]
[ROW][C]Raw Input[/C][C]view raw input (R code) [/C][/ROW]
[ROW][C]Raw Output[/C][C]view raw output of R engine [/C][/ROW]
[ROW][C]Computing time[/C][C]2 seconds[/C][/ROW]
[ROW][C]R Server[/C][C]'Sir Maurice George Kendall' @ kendall.wessa.net[/C][/ROW]
[/TABLE]
Source: https://freestatistics.org/blog/index.php?pk=235529&T=0

Globally Unique Identifier (entire table): ba.freestatistics.org/blog/index.php?pk=235529&T=0

As an alternative you can also use a QR Code:  

The GUIDs for individual cells are displayed in the table below:

Summary of computational transaction
Raw Inputview raw input (R code)
Raw Outputview raw output of R engine
Computing time2 seconds
R Server'Sir Maurice George Kendall' @ kendall.wessa.net


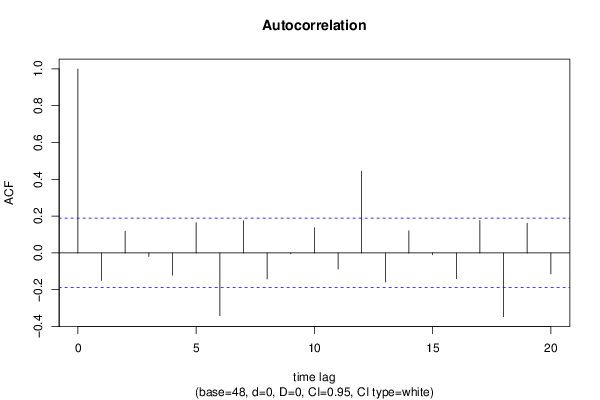
Autocorrelation Function
Time lag kACF(k)T-STATP-value
1-0.149707-1.55580.061341
20.117971.2260.111437
3-0.019229-0.19980.420992
4-0.121648-1.26420.104439
50.1636841.70110.045905
6-0.34097-3.54350.000292
70.1745411.81390.036236
8-0.141041-1.46570.072812
9-0.004108-0.04270.483015
100.1372361.42620.078348
11-0.087482-0.90910.18265
120.4446654.62115e-06
13-0.158056-1.64260.051691
140.1200181.24730.107499
15-0.010195-0.10590.457911
16-0.139715-1.4520.074706
170.1757551.82650.035268
18-0.346346-3.59930.000242
190.1609871.6730.048608
20-0.114112-1.18590.119134

\begin{tabular}{lllllllll}
\hline
Autocorrelation Function \tabularnewline
Time lag k & ACF(k) & T-STAT & P-value \tabularnewline
1 & -0.149707 & -1.5558 & 0.061341 \tabularnewline
2 & 0.11797 & 1.226 & 0.111437 \tabularnewline
3 & -0.019229 & -0.1998 & 0.420992 \tabularnewline
4 & -0.121648 & -1.2642 & 0.104439 \tabularnewline
5 & 0.163684 & 1.7011 & 0.045905 \tabularnewline
6 & -0.34097 & -3.5435 & 0.000292 \tabularnewline
7 & 0.174541 & 1.8139 & 0.036236 \tabularnewline
8 & -0.141041 & -1.4657 & 0.072812 \tabularnewline
9 & -0.004108 & -0.0427 & 0.483015 \tabularnewline
10 & 0.137236 & 1.4262 & 0.078348 \tabularnewline
11 & -0.087482 & -0.9091 & 0.18265 \tabularnewline
12 & 0.444665 & 4.6211 & 5e-06 \tabularnewline
13 & -0.158056 & -1.6426 & 0.051691 \tabularnewline
14 & 0.120018 & 1.2473 & 0.107499 \tabularnewline
15 & -0.010195 & -0.1059 & 0.457911 \tabularnewline
16 & -0.139715 & -1.452 & 0.074706 \tabularnewline
17 & 0.175755 & 1.8265 & 0.035268 \tabularnewline
18 & -0.346346 & -3.5993 & 0.000242 \tabularnewline
19 & 0.160987 & 1.673 & 0.048608 \tabularnewline
20 & -0.114112 & -1.1859 & 0.119134 \tabularnewline
\hline
\end{tabular}
%Source: https://freestatistics.org/blog/index.php?pk=235529&T=1

[TABLE]
[ROW][C]Autocorrelation Function[/C][/ROW]
[ROW][C]Time lag k[/C][C]ACF(k)[/C][C]T-STAT[/C][C]P-value[/C][/ROW]
[ROW][C]1[/C][C]-0.149707[/C][C]-1.5558[/C][C]0.061341[/C][/ROW]
[ROW][C]2[/C][C]0.11797[/C][C]1.226[/C][C]0.111437[/C][/ROW]
[ROW][C]3[/C][C]-0.019229[/C][C]-0.1998[/C][C]0.420992[/C][/ROW]
[ROW][C]4[/C][C]-0.121648[/C][C]-1.2642[/C][C]0.104439[/C][/ROW]
[ROW][C]5[/C][C]0.163684[/C][C]1.7011[/C][C]0.045905[/C][/ROW]
[ROW][C]6[/C][C]-0.34097[/C][C]-3.5435[/C][C]0.000292[/C][/ROW]
[ROW][C]7[/C][C]0.174541[/C][C]1.8139[/C][C]0.036236[/C][/ROW]
[ROW][C]8[/C][C]-0.141041[/C][C]-1.4657[/C][C]0.072812[/C][/ROW]
[ROW][C]9[/C][C]-0.004108[/C][C]-0.0427[/C][C]0.483015[/C][/ROW]
[ROW][C]10[/C][C]0.137236[/C][C]1.4262[/C][C]0.078348[/C][/ROW]
[ROW][C]11[/C][C]-0.087482[/C][C]-0.9091[/C][C]0.18265[/C][/ROW]
[ROW][C]12[/C][C]0.444665[/C][C]4.6211[/C][C]5e-06[/C][/ROW]
[ROW][C]13[/C][C]-0.158056[/C][C]-1.6426[/C][C]0.051691[/C][/ROW]
[ROW][C]14[/C][C]0.120018[/C][C]1.2473[/C][C]0.107499[/C][/ROW]
[ROW][C]15[/C][C]-0.010195[/C][C]-0.1059[/C][C]0.457911[/C][/ROW]
[ROW][C]16[/C][C]-0.139715[/C][C]-1.452[/C][C]0.074706[/C][/ROW]
[ROW][C]17[/C][C]0.175755[/C][C]1.8265[/C][C]0.035268[/C][/ROW]
[ROW][C]18[/C][C]-0.346346[/C][C]-3.5993[/C][C]0.000242[/C][/ROW]
[ROW][C]19[/C][C]0.160987[/C][C]1.673[/C][C]0.048608[/C][/ROW]
[ROW][C]20[/C][C]-0.114112[/C][C]-1.1859[/C][C]0.119134[/C][/ROW]
[/TABLE]
Source: https://freestatistics.org/blog/index.php?pk=235529&T=1

Globally Unique Identifier (entire table): ba.freestatistics.org/blog/index.php?pk=235529&T=1

As an alternative you can also use a QR Code:  

The GUIDs for individual cells are displayed in the table below:

Autocorrelation Function
Time lag kACF(k)T-STATP-value
1-0.149707-1.55580.061341
20.117971.2260.111437
3-0.019229-0.19980.420992
4-0.121648-1.26420.104439
50.1636841.70110.045905
6-0.34097-3.54350.000292
70.1745411.81390.036236
8-0.141041-1.46570.072812
9-0.004108-0.04270.483015
100.1372361.42620.078348
11-0.087482-0.90910.18265
120.4446654.62115e-06
13-0.158056-1.64260.051691
140.1200181.24730.107499
15-0.010195-0.10590.457911
16-0.139715-1.4520.074706
170.1757551.82650.035268
18-0.346346-3.59930.000242
190.1609871.6730.048608
20-0.114112-1.18590.119134


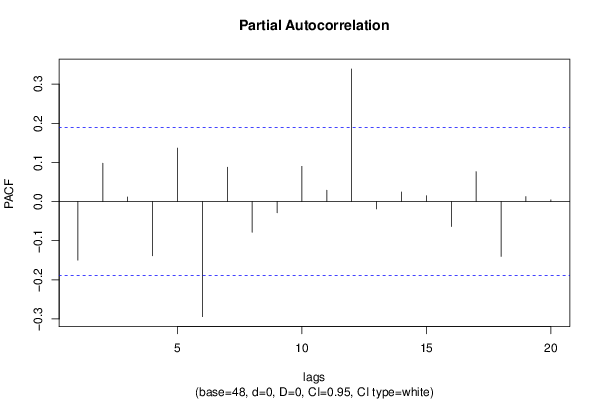
Partial Autocorrelation Function
Time lag kPACF(k)T-STATP-value
1-0.149707-1.55580.061341
20.0977481.01580.15599
30.011710.12170.451682
4-0.138654-1.44090.076249
50.1364661.41820.079506
6-0.294019-3.05550.001415
70.0875940.91030.182345
8-0.078616-0.8170.207863
9-0.028582-0.2970.383508
100.0898410.93370.176283
110.0287060.29830.383014
120.3387543.52040.000316
13-0.018656-0.19390.423319
140.0245550.25520.399532
150.0149010.15490.43861
16-0.063614-0.66110.254979
170.0763840.79380.214524
18-0.139997-1.45490.0743
190.0126740.13170.44773
200.0042970.04470.482232

\begin{tabular}{lllllllll}
\hline
Partial Autocorrelation Function \tabularnewline
Time lag k & PACF(k) & T-STAT & P-value \tabularnewline
1 & -0.149707 & -1.5558 & 0.061341 \tabularnewline
2 & 0.097748 & 1.0158 & 0.15599 \tabularnewline
3 & 0.01171 & 0.1217 & 0.451682 \tabularnewline
4 & -0.138654 & -1.4409 & 0.076249 \tabularnewline
5 & 0.136466 & 1.4182 & 0.079506 \tabularnewline
6 & -0.294019 & -3.0555 & 0.001415 \tabularnewline
7 & 0.087594 & 0.9103 & 0.182345 \tabularnewline
8 & -0.078616 & -0.817 & 0.207863 \tabularnewline
9 & -0.028582 & -0.297 & 0.383508 \tabularnewline
10 & 0.089841 & 0.9337 & 0.176283 \tabularnewline
11 & 0.028706 & 0.2983 & 0.383014 \tabularnewline
12 & 0.338754 & 3.5204 & 0.000316 \tabularnewline
13 & -0.018656 & -0.1939 & 0.423319 \tabularnewline
14 & 0.024555 & 0.2552 & 0.399532 \tabularnewline
15 & 0.014901 & 0.1549 & 0.43861 \tabularnewline
16 & -0.063614 & -0.6611 & 0.254979 \tabularnewline
17 & 0.076384 & 0.7938 & 0.214524 \tabularnewline
18 & -0.139997 & -1.4549 & 0.0743 \tabularnewline
19 & 0.012674 & 0.1317 & 0.44773 \tabularnewline
20 & 0.004297 & 0.0447 & 0.482232 \tabularnewline
\hline
\end{tabular}
%Source: https://freestatistics.org/blog/index.php?pk=235529&T=2

[TABLE]
[ROW][C]Partial Autocorrelation Function[/C][/ROW]
[ROW][C]Time lag k[/C][C]PACF(k)[/C][C]T-STAT[/C][C]P-value[/C][/ROW]
[ROW][C]1[/C][C]-0.149707[/C][C]-1.5558[/C][C]0.061341[/C][/ROW]
[ROW][C]2[/C][C]0.097748[/C][C]1.0158[/C][C]0.15599[/C][/ROW]
[ROW][C]3[/C][C]0.01171[/C][C]0.1217[/C][C]0.451682[/C][/ROW]
[ROW][C]4[/C][C]-0.138654[/C][C]-1.4409[/C][C]0.076249[/C][/ROW]
[ROW][C]5[/C][C]0.136466[/C][C]1.4182[/C][C]0.079506[/C][/ROW]
[ROW][C]6[/C][C]-0.294019[/C][C]-3.0555[/C][C]0.001415[/C][/ROW]
[ROW][C]7[/C][C]0.087594[/C][C]0.9103[/C][C]0.182345[/C][/ROW]
[ROW][C]8[/C][C]-0.078616[/C][C]-0.817[/C][C]0.207863[/C][/ROW]
[ROW][C]9[/C][C]-0.028582[/C][C]-0.297[/C][C]0.383508[/C][/ROW]
[ROW][C]10[/C][C]0.089841[/C][C]0.9337[/C][C]0.176283[/C][/ROW]
[ROW][C]11[/C][C]0.028706[/C][C]0.2983[/C][C]0.383014[/C][/ROW]
[ROW][C]12[/C][C]0.338754[/C][C]3.5204[/C][C]0.000316[/C][/ROW]
[ROW][C]13[/C][C]-0.018656[/C][C]-0.1939[/C][C]0.423319[/C][/ROW]
[ROW][C]14[/C][C]0.024555[/C][C]0.2552[/C][C]0.399532[/C][/ROW]
[ROW][C]15[/C][C]0.014901[/C][C]0.1549[/C][C]0.43861[/C][/ROW]
[ROW][C]16[/C][C]-0.063614[/C][C]-0.6611[/C][C]0.254979[/C][/ROW]
[ROW][C]17[/C][C]0.076384[/C][C]0.7938[/C][C]0.214524[/C][/ROW]
[ROW][C]18[/C][C]-0.139997[/C][C]-1.4549[/C][C]0.0743[/C][/ROW]
[ROW][C]19[/C][C]0.012674[/C][C]0.1317[/C][C]0.44773[/C][/ROW]
[ROW][C]20[/C][C]0.004297[/C][C]0.0447[/C][C]0.482232[/C][/ROW]
[/TABLE]
Source: https://freestatistics.org/blog/index.php?pk=235529&T=2

Globally Unique Identifier (entire table): ba.freestatistics.org/blog/index.php?pk=235529&T=2

As an alternative you can also use a QR Code:  

The GUIDs for individual cells are displayed in the table below:

Partial Autocorrelation Function
Time lag kPACF(k)T-STATP-value
1-0.149707-1.55580.061341
20.0977481.01580.15599
30.011710.12170.451682
4-0.138654-1.44090.076249
50.1364661.41820.079506
6-0.294019-3.05550.001415
70.0875940.91030.182345
8-0.078616-0.8170.207863
9-0.028582-0.2970.383508
100.0898410.93370.176283
110.0287060.29830.383014
120.3387543.52040.000316
13-0.018656-0.19390.423319
140.0245550.25520.399532
150.0149010.15490.43861
16-0.063614-0.66110.254979
170.0763840.79380.214524
18-0.139997-1.45490.0743
190.0126740.13170.44773
200.0042970.04470.482232


Parameters (Session):
par1 = Default ; par2 = 1 ; par3 = 0 ; par4 = 0 ; par5 = 12 ; par6 = White Noise ; par7 = 0.95 ; par8 = 48 ;
Parameters (R input):
par1 = Default ; par2 = 1 ; par3 = 0 ; par4 = 0 ; par5 = 12 ; par6 = White Noise ; par7 = 0.95 ; par8 = 48 ;
R code (references can be found in the software module):
par8 <- ''
par7 <- '0.95'
par6 <- 'White Noise'
par5 <- '12'
par4 <- '0'
par3 <- '0'
par2 <- '1'
par1 <- 'Default'
if (par1 == 'Default') {
par1 = 10*log10(length(x))
} else {
par1 <- as.numeric(par1)
}
par2 <- as.numeric(par2)
par3 <- as.numeric(par3)
par4 <- as.numeric(par4)
par5 <- as.numeric(par5)
if (par6 == 'White Noise') par6 <- 'white' else par6 <- 'ma'
par7 <- as.numeric(par7)
if (par8 != '') par8 <- as.numeric(par8)
ox <- x
if (par8 == '') {
if (par2 == 0) {
x <- log(x)
} else {
x <- (x ^ par2 - 1) / par2
}
} else {
x <- log(x,base=par8)
}
if (par3 > 0) x <- diff(x,lag=1,difference=par3)
if (par4 > 0) x <- diff(x,lag=par5,difference=par4)
bitmap(file='picts.png')
op <- par(mfrow=c(2,1))
plot(ox,type='l',main='Original Time Series',xlab='time',ylab='value')
if (par8=='') {
mytitle <- paste('Working Time Series (lambda=',par2,', d=',par3,', D=',par4,')',sep='')
mysub <- paste('(lambda=',par2,', d=',par3,', D=',par4,', CI=', par7, ', CI type=',par6,')',sep='')
} else {
mytitle <- paste('Working Time Series (base=',par8,', d=',par3,', D=',par4,')',sep='')
mysub <- paste('(base=',par8,', d=',par3,', D=',par4,', CI=', par7, ', CI type=',par6,')',sep='')
}
plot(x,type='l', main=mytitle,xlab='time',ylab='value')
par(op)
dev.off()
bitmap(file='pic1.png')
racf <- acf(x, par1, main='Autocorrelation', xlab='time lag', ylab='ACF', ci.type=par6, ci=par7, sub=mysub)
dev.off()
bitmap(file='pic2.png')
rpacf <- pacf(x,par1,main='Partial Autocorrelation',xlab='lags',ylab='PACF',sub=mysub)
dev.off()
(myacf <- c(racf$acf))
(mypacf <- c(rpacf$acf))
lengthx <- length(x)
sqrtn <- sqrt(lengthx)
load(file='createtable')
a<-table.start()
a<-table.row.start(a)
a<-table.element(a,'Autocorrelation Function',4,TRUE)
a<-table.row.end(a)
a<-table.row.start(a)
a<-table.element(a,'Time lag k',header=TRUE)
a<-table.element(a,hyperlink('basics.htm','ACF(k)','click here for more information about the Autocorrelation Function'),header=TRUE)
a<-table.element(a,'T-STAT',header=TRUE)
a<-table.element(a,'P-value',header=TRUE)
a<-table.row.end(a)
for (i in 2:(par1+1)) {
a<-table.row.start(a)
a<-table.element(a,i-1,header=TRUE)
a<-table.element(a,round(myacf[i],6))
mytstat <- myacf[i]*sqrtn
a<-table.element(a,round(mytstat,4))
a<-table.element(a,round(1-pt(abs(mytstat),lengthx),6))
a<-table.row.end(a)
}
a<-table.end(a)
table.save(a,file='mytable.tab')
a<-table.start()
a<-table.row.start(a)
a<-table.element(a,'Partial Autocorrelation Function',4,TRUE)
a<-table.row.end(a)
a<-table.row.start(a)
a<-table.element(a,'Time lag k',header=TRUE)
a<-table.element(a,hyperlink('basics.htm','PACF(k)','click here for more information about the Partial Autocorrelation Function'),header=TRUE)
a<-table.element(a,'T-STAT',header=TRUE)
a<-table.element(a,'P-value',header=TRUE)
a<-table.row.end(a)
for (i in 1:par1) {
a<-table.row.start(a)
a<-table.element(a,i,header=TRUE)
a<-table.element(a,round(mypacf[i],6))
mytstat <- mypacf[i]*sqrtn
a<-table.element(a,round(mytstat,4))
a<-table.element(a,round(1-pt(abs(mytstat),lengthx),6))
a<-table.row.end(a)
}
a<-table.end(a)
table.save(a,file='mytable1.tab')