Free Statistics

of Irreproducible Research!

Author's title

Author*The author of this computation has been verified*
R Software Modulerwasp_autocorrelation.wasp
Title produced by software(Partial) Autocorrelation Function
Date of computationTue, 20 Dec 2016 12:08:36 +0100
Cite this page as followsStatistical Computations at FreeStatistics.org, Office for Research Development and Education, URL https://freestatistics.org/blog/index.php?v=date/2016/Dec/20/t1482232198zes3r7693ete4l9.htm/, Retrieved Sun, 28 Apr 2024 12:14:03 +0000
Statistical Computations at FreeStatistics.org, Office for Research Development and Education, URL https://freestatistics.org/blog/index.php?pk=301606, Retrieved Sun, 28 Apr 2024 12:14:03 +0000
QR Codes:

Original text written by user:
IsPrivate?No (this computation is public)
User-defined keywords
Estimated Impact55
Family? (F = Feedback message, R = changed R code, M = changed R Module, P = changed Parameters, D = changed Data)
-       [(Partial) Autocorrelation Function] [] [2016-12-20 11:08:36] [b7216e4bc5ee29192acbe9c506cee18c] [Current]
Feedback Forum

Post a new message
Dataseries X:
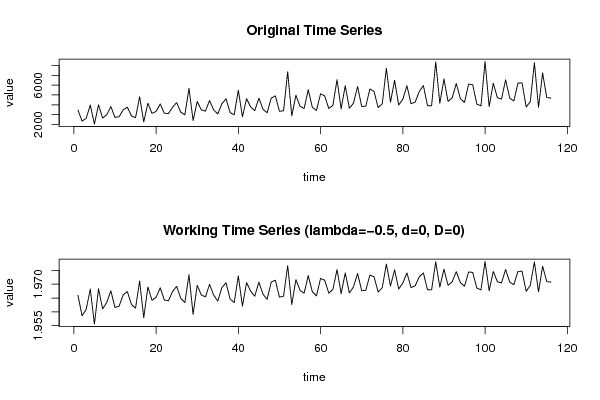
3450.3
2328.96
2610.24
3974.04
2025.3
3991.02
2636.88
2980.98
3813.36
2709.42
2772
3482.64
3752.64
2873.16
2667.84
4810.8
2247.54
4156.92
3121.02
3312.54
4081.14
3135.06
3089.64
3744.24
4227.24
3241.26
2976.36
5675.58
2387.64
4329.06
3478.2
3346.56
4428.48
3473.16
3069.78
4091.58
4602.6
3202.2
2973.42
5486.28
2774.76
4621.44
3778.44
3391.38
4680.78
3540.72
3178.02
4682.1
4906.26
3327.78
3390.9
7373.82
2861.46
4976.7
3853.38
3612.78
5544.6
3737.7
3414.9
5128.14
4904.4
3616.74
3939.84
6555.96
3578.1
5948.4
3637.86
4163.4
5864.52
3814.92
3859.2
5619.3
5358.36
3713.82
4092.3
7733.52
4261.5
6494.94
3971.46
4568.16
5953.98
4105.56
4272.78
5347.8
5971.44
3908.46
3888.3
8376.24
4151.16
6636.06
4339.74
4707.72
6176.34
4619.16
4230.42
6114
6042.78
4059.42
3888.3
8422.8
3813.6
6203.34
4715.58
4585.56
6561
4683.9
4385.7
6218.16
6241.86
3764.82
4327.62
8301.06
3731.04
7252.68
4743
4686.06


Summary of computational transaction
Raw Input view raw input (R code)
Raw Outputview raw output of R engine
Computing time1 seconds
R ServerBig Analytics Cloud Computing Center

\begin{tabular}{lllllllll}
\hline
Summary of computational transaction \tabularnewline
Raw Input view raw input (R code)  \tabularnewline
Raw Outputview raw output of R engine  \tabularnewline
Computing time1 seconds \tabularnewline
R ServerBig Analytics Cloud Computing Center \tabularnewline
\hline
\end{tabular}
%Source: https://freestatistics.org/blog/index.php?pk=301606&T=0

[TABLE]
[ROW]
Summary of computational transaction[/C][/ROW] [ROW]Raw Input[/C] view raw input (R code) [/C][/ROW] [ROW]Raw Output[/C]view raw output of R engine [/C][/ROW] [ROW]Computing time[/C]1 seconds[/C][/ROW] [ROW]R Server[/C]Big Analytics Cloud Computing Center[/C][/ROW] [/TABLE] Source: https://freestatistics.org/blog/index.php?pk=301606&T=0

Globally Unique Identifier (entire table): ba.freestatistics.org/blog/index.php?pk=301606&T=0

As an alternative you can also use a QR Code:  

The GUIDs for individual cells are displayed in the table below:

Summary of computational transaction
Raw Input view raw input (R code)
Raw Outputview raw output of R engine
Computing time1 seconds
R ServerBig Analytics Cloud Computing Center


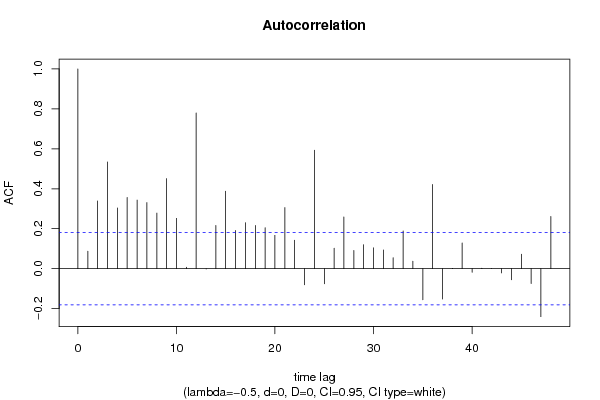
Autocorrelation Function
Time lag kACF(k)T-STATP-value
10.0871110.93820.175042
20.3388753.64980.000197
30.5341015.75240
40.3040423.27460.000698
50.3565633.84031e-04
60.3430933.69520.000168
70.3307293.56210.000267
80.2779012.99310.001688
90.4507764.8552e-06
100.2518712.71270.003845
110.0069660.0750.470164
120.7793328.39370
13-0.001186-0.01280.494914
140.2160422.32680.010854
150.3872194.17052.9e-05
160.1909652.05680.020976
170.2302372.47970.007292
180.2157772.3240.010934
190.2048562.20640.014664
200.1666521.79490.037637
210.3055123.29050.000663
220.1425711.53550.063687
23-0.080524-0.86730.193793
240.5929756.38650
25-0.075372-0.81180.20929
260.1019511.0980.13723
270.2584542.78360.003139
280.0908750.97880.16487
290.1195661.28780.100196
300.1039591.11970.132584
310.0934741.00670.158076
320.0548790.59110.277813
330.1888192.03360.022134
340.0370660.39920.345235
35-0.156171-1.6820.047628
360.4211384.53587e-06
37-0.152467-1.64210.051637
38-0.000906-0.00980.496117
390.1282591.38140.084906
40-0.018217-0.19620.422396
410.0016520.01780.492918
42-1.1e-05-1e-040.499952
43-0.021385-0.23030.409124
44-0.055714-0.60010.274818
450.0725230.78110.218169
46-0.074079-0.79790.213292
47-0.240435-2.58960.00542
480.2609422.81040.002905

\begin{tabular}{lllllllll}
\hline
Autocorrelation Function \tabularnewline
Time lag k & ACF(k) & T-STAT & P-value \tabularnewline
1 & 0.087111 & 0.9382 & 0.175042 \tabularnewline
2 & 0.338875 & 3.6498 & 0.000197 \tabularnewline
3 & 0.534101 & 5.7524 & 0 \tabularnewline
4 & 0.304042 & 3.2746 & 0.000698 \tabularnewline
5 & 0.356563 & 3.8403 & 1e-04 \tabularnewline
6 & 0.343093 & 3.6952 & 0.000168 \tabularnewline
7 & 0.330729 & 3.5621 & 0.000267 \tabularnewline
8 & 0.277901 & 2.9931 & 0.001688 \tabularnewline
9 & 0.450776 & 4.855 & 2e-06 \tabularnewline
10 & 0.251871 & 2.7127 & 0.003845 \tabularnewline
11 & 0.006966 & 0.075 & 0.470164 \tabularnewline
12 & 0.779332 & 8.3937 & 0 \tabularnewline
13 & -0.001186 & -0.0128 & 0.494914 \tabularnewline
14 & 0.216042 & 2.3268 & 0.010854 \tabularnewline
15 & 0.387219 & 4.1705 & 2.9e-05 \tabularnewline
16 & 0.190965 & 2.0568 & 0.020976 \tabularnewline
17 & 0.230237 & 2.4797 & 0.007292 \tabularnewline
18 & 0.215777 & 2.324 & 0.010934 \tabularnewline
19 & 0.204856 & 2.2064 & 0.014664 \tabularnewline
20 & 0.166652 & 1.7949 & 0.037637 \tabularnewline
21 & 0.305512 & 3.2905 & 0.000663 \tabularnewline
22 & 0.142571 & 1.5355 & 0.063687 \tabularnewline
23 & -0.080524 & -0.8673 & 0.193793 \tabularnewline
24 & 0.592975 & 6.3865 & 0 \tabularnewline
25 & -0.075372 & -0.8118 & 0.20929 \tabularnewline
26 & 0.101951 & 1.098 & 0.13723 \tabularnewline
27 & 0.258454 & 2.7836 & 0.003139 \tabularnewline
28 & 0.090875 & 0.9788 & 0.16487 \tabularnewline
29 & 0.119566 & 1.2878 & 0.100196 \tabularnewline
30 & 0.103959 & 1.1197 & 0.132584 \tabularnewline
31 & 0.093474 & 1.0067 & 0.158076 \tabularnewline
32 & 0.054879 & 0.5911 & 0.277813 \tabularnewline
33 & 0.188819 & 2.0336 & 0.022134 \tabularnewline
34 & 0.037066 & 0.3992 & 0.345235 \tabularnewline
35 & -0.156171 & -1.682 & 0.047628 \tabularnewline
36 & 0.421138 & 4.5358 & 7e-06 \tabularnewline
37 & -0.152467 & -1.6421 & 0.051637 \tabularnewline
38 & -0.000906 & -0.0098 & 0.496117 \tabularnewline
39 & 0.128259 & 1.3814 & 0.084906 \tabularnewline
40 & -0.018217 & -0.1962 & 0.422396 \tabularnewline
41 & 0.001652 & 0.0178 & 0.492918 \tabularnewline
42 & -1.1e-05 & -1e-04 & 0.499952 \tabularnewline
43 & -0.021385 & -0.2303 & 0.409124 \tabularnewline
44 & -0.055714 & -0.6001 & 0.274818 \tabularnewline
45 & 0.072523 & 0.7811 & 0.218169 \tabularnewline
46 & -0.074079 & -0.7979 & 0.213292 \tabularnewline
47 & -0.240435 & -2.5896 & 0.00542 \tabularnewline
48 & 0.260942 & 2.8104 & 0.002905 \tabularnewline
\hline
\end{tabular}
%Source: https://freestatistics.org/blog/index.php?pk=301606&T=1

[TABLE]
[ROW][C]Autocorrelation Function[/C][/ROW]
[ROW][C]Time lag k[/C][C]ACF(k)[/C][C]T-STAT[/C][C]P-value[/C][/ROW]
[ROW][C]1[/C][C]0.087111[/C][C]0.9382[/C][C]0.175042[/C][/ROW]
[ROW][C]2[/C][C]0.338875[/C][C]3.6498[/C][C]0.000197[/C][/ROW]
[ROW][C]3[/C][C]0.534101[/C][C]5.7524[/C][C]0[/C][/ROW]
[ROW][C]4[/C][C]0.304042[/C][C]3.2746[/C][C]0.000698[/C][/ROW]
[ROW][C]5[/C][C]0.356563[/C][C]3.8403[/C][C]1e-04[/C][/ROW]
[ROW][C]6[/C][C]0.343093[/C][C]3.6952[/C][C]0.000168[/C][/ROW]
[ROW][C]7[/C][C]0.330729[/C][C]3.5621[/C][C]0.000267[/C][/ROW]
[ROW][C]8[/C][C]0.277901[/C][C]2.9931[/C][C]0.001688[/C][/ROW]
[ROW][C]9[/C][C]0.450776[/C][C]4.855[/C][C]2e-06[/C][/ROW]
[ROW][C]10[/C][C]0.251871[/C][C]2.7127[/C][C]0.003845[/C][/ROW]
[ROW][C]11[/C][C]0.006966[/C][C]0.075[/C][C]0.470164[/C][/ROW]
[ROW][C]12[/C][C]0.779332[/C][C]8.3937[/C][C]0[/C][/ROW]
[ROW][C]13[/C][C]-0.001186[/C][C]-0.0128[/C][C]0.494914[/C][/ROW]
[ROW][C]14[/C][C]0.216042[/C][C]2.3268[/C][C]0.010854[/C][/ROW]
[ROW][C]15[/C][C]0.387219[/C][C]4.1705[/C][C]2.9e-05[/C][/ROW]
[ROW][C]16[/C][C]0.190965[/C][C]2.0568[/C][C]0.020976[/C][/ROW]
[ROW][C]17[/C][C]0.230237[/C][C]2.4797[/C][C]0.007292[/C][/ROW]
[ROW][C]18[/C][C]0.215777[/C][C]2.324[/C][C]0.010934[/C][/ROW]
[ROW][C]19[/C][C]0.204856[/C][C]2.2064[/C][C]0.014664[/C][/ROW]
[ROW][C]20[/C][C]0.166652[/C][C]1.7949[/C][C]0.037637[/C][/ROW]
[ROW][C]21[/C][C]0.305512[/C][C]3.2905[/C][C]0.000663[/C][/ROW]
[ROW][C]22[/C][C]0.142571[/C][C]1.5355[/C][C]0.063687[/C][/ROW]
[ROW][C]23[/C][C]-0.080524[/C][C]-0.8673[/C][C]0.193793[/C][/ROW]
[ROW][C]24[/C][C]0.592975[/C][C]6.3865[/C][C]0[/C][/ROW]
[ROW][C]25[/C][C]-0.075372[/C][C]-0.8118[/C][C]0.20929[/C][/ROW]
[ROW][C]26[/C][C]0.101951[/C][C]1.098[/C][C]0.13723[/C][/ROW]
[ROW][C]27[/C][C]0.258454[/C][C]2.7836[/C][C]0.003139[/C][/ROW]
[ROW][C]28[/C][C]0.090875[/C][C]0.9788[/C][C]0.16487[/C][/ROW]
[ROW][C]29[/C][C]0.119566[/C][C]1.2878[/C][C]0.100196[/C][/ROW]
[ROW][C]30[/C][C]0.103959[/C][C]1.1197[/C][C]0.132584[/C][/ROW]
[ROW][C]31[/C][C]0.093474[/C][C]1.0067[/C][C]0.158076[/C][/ROW]
[ROW][C]32[/C][C]0.054879[/C][C]0.5911[/C][C]0.277813[/C][/ROW]
[ROW][C]33[/C][C]0.188819[/C][C]2.0336[/C][C]0.022134[/C][/ROW]
[ROW][C]34[/C][C]0.037066[/C][C]0.3992[/C][C]0.345235[/C][/ROW]
[ROW][C]35[/C][C]-0.156171[/C][C]-1.682[/C][C]0.047628[/C][/ROW]
[ROW][C]36[/C][C]0.421138[/C][C]4.5358[/C][C]7e-06[/C][/ROW]
[ROW][C]37[/C][C]-0.152467[/C][C]-1.6421[/C][C]0.051637[/C][/ROW]
[ROW][C]38[/C][C]-0.000906[/C][C]-0.0098[/C][C]0.496117[/C][/ROW]
[ROW][C]39[/C][C]0.128259[/C][C]1.3814[/C][C]0.084906[/C][/ROW]
[ROW][C]40[/C][C]-0.018217[/C][C]-0.1962[/C][C]0.422396[/C][/ROW]
[ROW][C]41[/C][C]0.001652[/C][C]0.0178[/C][C]0.492918[/C][/ROW]
[ROW][C]42[/C][C]-1.1e-05[/C][C]-1e-04[/C][C]0.499952[/C][/ROW]
[ROW][C]43[/C][C]-0.021385[/C][C]-0.2303[/C][C]0.409124[/C][/ROW]
[ROW][C]44[/C][C]-0.055714[/C][C]-0.6001[/C][C]0.274818[/C][/ROW]
[ROW][C]45[/C][C]0.072523[/C][C]0.7811[/C][C]0.218169[/C][/ROW]
[ROW][C]46[/C][C]-0.074079[/C][C]-0.7979[/C][C]0.213292[/C][/ROW]
[ROW][C]47[/C][C]-0.240435[/C][C]-2.5896[/C][C]0.00542[/C][/ROW]
[ROW][C]48[/C][C]0.260942[/C][C]2.8104[/C][C]0.002905[/C][/ROW]
[/TABLE]
Source: https://freestatistics.org/blog/index.php?pk=301606&T=1

Globally Unique Identifier (entire table): ba.freestatistics.org/blog/index.php?pk=301606&T=1

As an alternative you can also use a QR Code:  

The GUIDs for individual cells are displayed in the table below:

Autocorrelation Function
Time lag kACF(k)T-STATP-value
10.0871110.93820.175042
20.3388753.64980.000197
30.5341015.75240
40.3040423.27460.000698
50.3565633.84031e-04
60.3430933.69520.000168
70.3307293.56210.000267
80.2779012.99310.001688
90.4507764.8552e-06
100.2518712.71270.003845
110.0069660.0750.470164
120.7793328.39370
13-0.001186-0.01280.494914
140.2160422.32680.010854
150.3872194.17052.9e-05
160.1909652.05680.020976
170.2302372.47970.007292
180.2157772.3240.010934
190.2048562.20640.014664
200.1666521.79490.037637
210.3055123.29050.000663
220.1425711.53550.063687
23-0.080524-0.86730.193793
240.5929756.38650
25-0.075372-0.81180.20929
260.1019511.0980.13723
270.2584542.78360.003139
280.0908750.97880.16487
290.1195661.28780.100196
300.1039591.11970.132584
310.0934741.00670.158076
320.0548790.59110.277813
330.1888192.03360.022134
340.0370660.39920.345235
35-0.156171-1.6820.047628
360.4211384.53587e-06
37-0.152467-1.64210.051637
38-0.000906-0.00980.496117
390.1282591.38140.084906
40-0.018217-0.19620.422396
410.0016520.01780.492918
42-1.1e-05-1e-040.499952
43-0.021385-0.23030.409124
44-0.055714-0.60010.274818
450.0725230.78110.218169
46-0.074079-0.79790.213292
47-0.240435-2.58960.00542
480.2609422.81040.002905


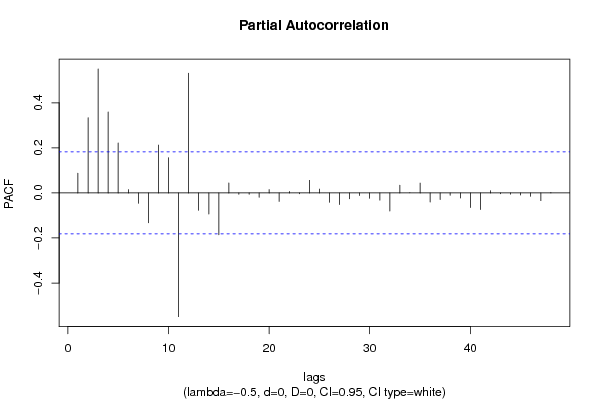
Partial Autocorrelation Function
Time lag kPACF(k)T-STATP-value
10.0871110.93820.175042
20.3338193.59530.000239
30.5504025.9280
40.359433.87129e-05
50.2214052.38460.00936
60.0147920.15930.43685
7-0.045512-0.49020.312468
8-0.132758-1.42980.077724
90.2121372.28480.012072
100.1561671.6820.047633
11-0.549254-5.91570
120.5312855.72210
13-0.07665-0.82550.205379
14-0.093369-1.00560.158347
15-0.185529-1.99820.024017
160.0444630.47890.316463
17-0.00561-0.06040.47596
18-0.005863-0.06310.474879
19-0.019043-0.20510.418926
200.0146320.15760.437526
21-0.037505-0.40390.343499
220.0060690.06540.473998
23-0.003405-0.03670.485403
240.0557810.60080.27458
250.0168980.1820.427953
26-0.041141-0.44310.329257
27-0.051254-0.5520.290997
28-0.025527-0.27490.391929
29-0.011509-0.1240.450782
30-0.023884-0.25720.398726
31-0.03201-0.34480.365451
32-0.080077-0.86250.195109
330.0337860.36390.358304
340.0002970.00320.498725
350.0435950.46950.319784
36-0.040689-0.43820.331016
37-0.029271-0.31530.376566
38-0.01043-0.11230.455377
39-0.022298-0.24020.405316
40-0.06439-0.69350.244691
41-0.07383-0.79520.214068
420.0099660.10730.457355
43-0.003873-0.04170.483401
44-0.005309-0.05720.477249
45-0.009151-0.09860.460828
46-0.014588-0.15710.437713
47-0.034365-0.37010.355981
480.0006780.00730.497092

\begin{tabular}{lllllllll}
\hline
Partial Autocorrelation Function \tabularnewline
Time lag k & PACF(k) & T-STAT & P-value \tabularnewline
1 & 0.087111 & 0.9382 & 0.175042 \tabularnewline
2 & 0.333819 & 3.5953 & 0.000239 \tabularnewline
3 & 0.550402 & 5.928 & 0 \tabularnewline
4 & 0.35943 & 3.8712 & 9e-05 \tabularnewline
5 & 0.221405 & 2.3846 & 0.00936 \tabularnewline
6 & 0.014792 & 0.1593 & 0.43685 \tabularnewline
7 & -0.045512 & -0.4902 & 0.312468 \tabularnewline
8 & -0.132758 & -1.4298 & 0.077724 \tabularnewline
9 & 0.212137 & 2.2848 & 0.012072 \tabularnewline
10 & 0.156167 & 1.682 & 0.047633 \tabularnewline
11 & -0.549254 & -5.9157 & 0 \tabularnewline
12 & 0.531285 & 5.7221 & 0 \tabularnewline
13 & -0.07665 & -0.8255 & 0.205379 \tabularnewline
14 & -0.093369 & -1.0056 & 0.158347 \tabularnewline
15 & -0.185529 & -1.9982 & 0.024017 \tabularnewline
16 & 0.044463 & 0.4789 & 0.316463 \tabularnewline
17 & -0.00561 & -0.0604 & 0.47596 \tabularnewline
18 & -0.005863 & -0.0631 & 0.474879 \tabularnewline
19 & -0.019043 & -0.2051 & 0.418926 \tabularnewline
20 & 0.014632 & 0.1576 & 0.437526 \tabularnewline
21 & -0.037505 & -0.4039 & 0.343499 \tabularnewline
22 & 0.006069 & 0.0654 & 0.473998 \tabularnewline
23 & -0.003405 & -0.0367 & 0.485403 \tabularnewline
24 & 0.055781 & 0.6008 & 0.27458 \tabularnewline
25 & 0.016898 & 0.182 & 0.427953 \tabularnewline
26 & -0.041141 & -0.4431 & 0.329257 \tabularnewline
27 & -0.051254 & -0.552 & 0.290997 \tabularnewline
28 & -0.025527 & -0.2749 & 0.391929 \tabularnewline
29 & -0.011509 & -0.124 & 0.450782 \tabularnewline
30 & -0.023884 & -0.2572 & 0.398726 \tabularnewline
31 & -0.03201 & -0.3448 & 0.365451 \tabularnewline
32 & -0.080077 & -0.8625 & 0.195109 \tabularnewline
33 & 0.033786 & 0.3639 & 0.358304 \tabularnewline
34 & 0.000297 & 0.0032 & 0.498725 \tabularnewline
35 & 0.043595 & 0.4695 & 0.319784 \tabularnewline
36 & -0.040689 & -0.4382 & 0.331016 \tabularnewline
37 & -0.029271 & -0.3153 & 0.376566 \tabularnewline
38 & -0.01043 & -0.1123 & 0.455377 \tabularnewline
39 & -0.022298 & -0.2402 & 0.405316 \tabularnewline
40 & -0.06439 & -0.6935 & 0.244691 \tabularnewline
41 & -0.07383 & -0.7952 & 0.214068 \tabularnewline
42 & 0.009966 & 0.1073 & 0.457355 \tabularnewline
43 & -0.003873 & -0.0417 & 0.483401 \tabularnewline
44 & -0.005309 & -0.0572 & 0.477249 \tabularnewline
45 & -0.009151 & -0.0986 & 0.460828 \tabularnewline
46 & -0.014588 & -0.1571 & 0.437713 \tabularnewline
47 & -0.034365 & -0.3701 & 0.355981 \tabularnewline
48 & 0.000678 & 0.0073 & 0.497092 \tabularnewline
\hline
\end{tabular}
%Source: https://freestatistics.org/blog/index.php?pk=301606&T=2

[TABLE]
[ROW][C]Partial Autocorrelation Function[/C][/ROW]
[ROW][C]Time lag k[/C][C]PACF(k)[/C][C]T-STAT[/C][C]P-value[/C][/ROW]
[ROW][C]1[/C][C]0.087111[/C][C]0.9382[/C][C]0.175042[/C][/ROW]
[ROW][C]2[/C][C]0.333819[/C][C]3.5953[/C][C]0.000239[/C][/ROW]
[ROW][C]3[/C][C]0.550402[/C][C]5.928[/C][C]0[/C][/ROW]
[ROW][C]4[/C][C]0.35943[/C][C]3.8712[/C][C]9e-05[/C][/ROW]
[ROW][C]5[/C][C]0.221405[/C][C]2.3846[/C][C]0.00936[/C][/ROW]
[ROW][C]6[/C][C]0.014792[/C][C]0.1593[/C][C]0.43685[/C][/ROW]
[ROW][C]7[/C][C]-0.045512[/C][C]-0.4902[/C][C]0.312468[/C][/ROW]
[ROW][C]8[/C][C]-0.132758[/C][C]-1.4298[/C][C]0.077724[/C][/ROW]
[ROW][C]9[/C][C]0.212137[/C][C]2.2848[/C][C]0.012072[/C][/ROW]
[ROW][C]10[/C][C]0.156167[/C][C]1.682[/C][C]0.047633[/C][/ROW]
[ROW][C]11[/C][C]-0.549254[/C][C]-5.9157[/C][C]0[/C][/ROW]
[ROW][C]12[/C][C]0.531285[/C][C]5.7221[/C][C]0[/C][/ROW]
[ROW][C]13[/C][C]-0.07665[/C][C]-0.8255[/C][C]0.205379[/C][/ROW]
[ROW][C]14[/C][C]-0.093369[/C][C]-1.0056[/C][C]0.158347[/C][/ROW]
[ROW][C]15[/C][C]-0.185529[/C][C]-1.9982[/C][C]0.024017[/C][/ROW]
[ROW][C]16[/C][C]0.044463[/C][C]0.4789[/C][C]0.316463[/C][/ROW]
[ROW][C]17[/C][C]-0.00561[/C][C]-0.0604[/C][C]0.47596[/C][/ROW]
[ROW][C]18[/C][C]-0.005863[/C][C]-0.0631[/C][C]0.474879[/C][/ROW]
[ROW][C]19[/C][C]-0.019043[/C][C]-0.2051[/C][C]0.418926[/C][/ROW]
[ROW][C]20[/C][C]0.014632[/C][C]0.1576[/C][C]0.437526[/C][/ROW]
[ROW][C]21[/C][C]-0.037505[/C][C]-0.4039[/C][C]0.343499[/C][/ROW]
[ROW][C]22[/C][C]0.006069[/C][C]0.0654[/C][C]0.473998[/C][/ROW]
[ROW][C]23[/C][C]-0.003405[/C][C]-0.0367[/C][C]0.485403[/C][/ROW]
[ROW][C]24[/C][C]0.055781[/C][C]0.6008[/C][C]0.27458[/C][/ROW]
[ROW][C]25[/C][C]0.016898[/C][C]0.182[/C][C]0.427953[/C][/ROW]
[ROW][C]26[/C][C]-0.041141[/C][C]-0.4431[/C][C]0.329257[/C][/ROW]
[ROW][C]27[/C][C]-0.051254[/C][C]-0.552[/C][C]0.290997[/C][/ROW]
[ROW][C]28[/C][C]-0.025527[/C][C]-0.2749[/C][C]0.391929[/C][/ROW]
[ROW][C]29[/C][C]-0.011509[/C][C]-0.124[/C][C]0.450782[/C][/ROW]
[ROW][C]30[/C][C]-0.023884[/C][C]-0.2572[/C][C]0.398726[/C][/ROW]
[ROW][C]31[/C][C]-0.03201[/C][C]-0.3448[/C][C]0.365451[/C][/ROW]
[ROW][C]32[/C][C]-0.080077[/C][C]-0.8625[/C][C]0.195109[/C][/ROW]
[ROW][C]33[/C][C]0.033786[/C][C]0.3639[/C][C]0.358304[/C][/ROW]
[ROW][C]34[/C][C]0.000297[/C][C]0.0032[/C][C]0.498725[/C][/ROW]
[ROW][C]35[/C][C]0.043595[/C][C]0.4695[/C][C]0.319784[/C][/ROW]
[ROW][C]36[/C][C]-0.040689[/C][C]-0.4382[/C][C]0.331016[/C][/ROW]
[ROW][C]37[/C][C]-0.029271[/C][C]-0.3153[/C][C]0.376566[/C][/ROW]
[ROW][C]38[/C][C]-0.01043[/C][C]-0.1123[/C][C]0.455377[/C][/ROW]
[ROW][C]39[/C][C]-0.022298[/C][C]-0.2402[/C][C]0.405316[/C][/ROW]
[ROW][C]40[/C][C]-0.06439[/C][C]-0.6935[/C][C]0.244691[/C][/ROW]
[ROW][C]41[/C][C]-0.07383[/C][C]-0.7952[/C][C]0.214068[/C][/ROW]
[ROW][C]42[/C][C]0.009966[/C][C]0.1073[/C][C]0.457355[/C][/ROW]
[ROW][C]43[/C][C]-0.003873[/C][C]-0.0417[/C][C]0.483401[/C][/ROW]
[ROW][C]44[/C][C]-0.005309[/C][C]-0.0572[/C][C]0.477249[/C][/ROW]
[ROW][C]45[/C][C]-0.009151[/C][C]-0.0986[/C][C]0.460828[/C][/ROW]
[ROW][C]46[/C][C]-0.014588[/C][C]-0.1571[/C][C]0.437713[/C][/ROW]
[ROW][C]47[/C][C]-0.034365[/C][C]-0.3701[/C][C]0.355981[/C][/ROW]
[ROW][C]48[/C][C]0.000678[/C][C]0.0073[/C][C]0.497092[/C][/ROW]
[/TABLE]
Source: https://freestatistics.org/blog/index.php?pk=301606&T=2

Globally Unique Identifier (entire table): ba.freestatistics.org/blog/index.php?pk=301606&T=2

As an alternative you can also use a QR Code:  

The GUIDs for individual cells are displayed in the table below:

Partial Autocorrelation Function
Time lag kPACF(k)T-STATP-value
10.0871110.93820.175042
20.3338193.59530.000239
30.5504025.9280
40.359433.87129e-05
50.2214052.38460.00936
60.0147920.15930.43685
7-0.045512-0.49020.312468
8-0.132758-1.42980.077724
90.2121372.28480.012072
100.1561671.6820.047633
11-0.549254-5.91570
120.5312855.72210
13-0.07665-0.82550.205379
14-0.093369-1.00560.158347
15-0.185529-1.99820.024017
160.0444630.47890.316463
17-0.00561-0.06040.47596
18-0.005863-0.06310.474879
19-0.019043-0.20510.418926
200.0146320.15760.437526
21-0.037505-0.40390.343499
220.0060690.06540.473998
23-0.003405-0.03670.485403
240.0557810.60080.27458
250.0168980.1820.427953
26-0.041141-0.44310.329257
27-0.051254-0.5520.290997
28-0.025527-0.27490.391929
29-0.011509-0.1240.450782
30-0.023884-0.25720.398726
31-0.03201-0.34480.365451
32-0.080077-0.86250.195109
330.0337860.36390.358304
340.0002970.00320.498725
350.0435950.46950.319784
36-0.040689-0.43820.331016
37-0.029271-0.31530.376566
38-0.01043-0.11230.455377
39-0.022298-0.24020.405316
40-0.06439-0.69350.244691
41-0.07383-0.79520.214068
420.0099660.10730.457355
43-0.003873-0.04170.483401
44-0.005309-0.05720.477249
45-0.009151-0.09860.460828
46-0.014588-0.15710.437713
47-0.034365-0.37010.355981
480.0006780.00730.497092


Parameters (Session):
par1 = 48 ; par2 = -0.5 ; par3 = 0 ; par4 = 0 ; par5 = 12 ; par6 = White Noise ; par7 = 0.95 ;
Parameters (R input):
par1 = 48 ; par2 = -0.5 ; par3 = 0 ; par4 = 0 ; par5 = 12 ; par6 = White Noise ; par7 = 0.95 ; par8 = ;
R code (references can be found in the software module):
par8 <- ''
par7 <- '0.95'
par6 <- 'White Noise'
par5 <- '12'
par4 <- '0'
par3 <- '0'
par2 <- '-0.5'
par1 <- 'Default'
if (par1 == 'Default') {
par1 = 10*log10(length(x))
} else {
par1 <- as.numeric(par1)
}
par2 <- as.numeric(par2)
par3 <- as.numeric(par3)
par4 <- as.numeric(par4)
par5 <- as.numeric(par5)
if (par6 == 'White Noise') par6 <- 'white' else par6 <- 'ma'
par7 <- as.numeric(par7)
if (par8 != '') par8 <- as.numeric(par8)
x <- na.omit(x)
ox <- x
if (par8 == '') {
if (par2 == 0) {
x <- log(x)
} else {
x <- (x ^ par2 - 1) / par2
}
} else {
x <- log(x,base=par8)
}
if (par3 > 0) x <- diff(x,lag=1,difference=par3)
if (par4 > 0) x <- diff(x,lag=par5,difference=par4)
bitmap(file='picts.png')
op <- par(mfrow=c(2,1))
plot(ox,type='l',main='Original Time Series',xlab='time',ylab='value')
if (par8=='') {
mytitle <- paste('Working Time Series (lambda=',par2,', d=',par3,', D=',par4,')',sep='')
mysub <- paste('(lambda=',par2,', d=',par3,', D=',par4,', CI=', par7, ', CI type=',par6,')',sep='')
} else {
mytitle <- paste('Working Time Series (base=',par8,', d=',par3,', D=',par4,')',sep='')
mysub <- paste('(base=',par8,', d=',par3,', D=',par4,', CI=', par7, ', CI type=',par6,')',sep='')
}
plot(x,type='l', main=mytitle,xlab='time',ylab='value')
par(op)
dev.off()
bitmap(file='pic1.png')
racf <- acf(x, par1, main='Autocorrelation', xlab='time lag', ylab='ACF', ci.type=par6, ci=par7, sub=mysub)
dev.off()
bitmap(file='pic2.png')
rpacf <- pacf(x,par1,main='Partial Autocorrelation',xlab='lags',ylab='PACF',sub=mysub)
dev.off()
(myacf <- c(racf$acf))
(mypacf <- c(rpacf$acf))
lengthx <- length(x)
sqrtn <- sqrt(lengthx)
load(file='createtable')
a<-table.start()
a<-table.row.start(a)
a<-table.element(a,'Autocorrelation Function',4,TRUE)
a<-table.row.end(a)
a<-table.row.start(a)
a<-table.element(a,'Time lag k',header=TRUE)
a<-table.element(a,'ACF(k)',header=TRUE)
a<-table.element(a,'T-STAT',header=TRUE)
a<-table.element(a,'P-value',header=TRUE)
a<-table.row.end(a)
for (i in 2:(par1+1)) {
a<-table.row.start(a)
a<-table.element(a,i-1,header=TRUE)
a<-table.element(a,round(myacf[i],6))
mytstat <- myacf[i]*sqrtn
a<-table.element(a,round(mytstat,4))
a<-table.element(a,round(1-pt(abs(mytstat),lengthx),6))
a<-table.row.end(a)
}
a<-table.end(a)
table.save(a,file='mytable.tab')
a<-table.start()
a<-table.row.start(a)
a<-table.element(a,'Partial Autocorrelation Function',4,TRUE)
a<-table.row.end(a)
a<-table.row.start(a)
a<-table.element(a,'Time lag k',header=TRUE)
a<-table.element(a,'PACF(k)',header=TRUE)
a<-table.element(a,'T-STAT',header=TRUE)
a<-table.element(a,'P-value',header=TRUE)
a<-table.row.end(a)
for (i in 1:par1) {
a<-table.row.start(a)
a<-table.element(a,i,header=TRUE)
a<-table.element(a,round(mypacf[i],6))
mytstat <- mypacf[i]*sqrtn
a<-table.element(a,round(mytstat,4))
a<-table.element(a,round(1-pt(abs(mytstat),lengthx),6))
a<-table.row.end(a)
}
a<-table.end(a)
table.save(a,file='mytable1.tab')