Free Statistics

of Irreproducible Research!

Author's title

Author*The author of this computation has been verified*
R Software Modulerwasp_smp.wasp
Title produced by softwareStandard Deviation-Mean Plot
Date of computationThu, 22 Dec 2016 11:00:56 +0100
Cite this page as followsStatistical Computations at FreeStatistics.org, Office for Research Development and Education, URL https://freestatistics.org/blog/index.php?v=date/2016/Dec/22/t14824010655gz2tbnxqsoc1kv.htm/, Retrieved Mon, 29 Apr 2024 04:02:24 +0000
Statistical Computations at FreeStatistics.org, Office for Research Development and Education, URL https://freestatistics.org/blog/index.php?pk=302525, Retrieved Mon, 29 Apr 2024 04:02:24 +0000
QR Codes:

Original text written by user:
IsPrivate?No (this computation is public)
User-defined keywords
Estimated Impact118
Family? (F = Feedback message, R = changed R code, M = changed R Module, P = changed Parameters, D = changed Data)
-       [Standard Deviation-Mean Plot] [] [2016-12-22 10:00:56] [6deb082de88ded72ec069288c69f9f98] [Current]
Feedback Forum

Post a new message
Dataseries X:
5410.4
5432.2
5452.9
5477.6
5472.5
5454.9
5446
5010.6
5395.9
5360
5336.9
5333.9
5329.6
5345.7
5353.8
5377.2
5334.1
5351.1
5001
5246.4
5230
5115.8
4972.6
5077.6
5056.9
5070.7
4799.3
5076
5021.5
5026.4
4981.9
4936.6
4901.8
4853.8
4839.2
4821.3
4840.5
4847.6
4832.3
4814.7
4806.4
4803.4
4770.3
4723.4
4667.1
4636.8
4613.2
4605.3
4590.4
4595.4
4600.1
4543.3
4596.4
4575.4
4547.9
4503.7
4446.3
4401.4
4354.3
4336.3
4300.9
4304.1
4273.2
4279.9
4243.1
4199.1
4177.6
4141.7
4088.3
4021.4
3981.2
3937.2
3893.1
3864.7
3847.8
3840.8
3828.4
3798.6
3773
3737.8
3699
3674
3648.8
3645.6
3331
3674.7
3714.5
3739.7
3759.7
3708.6
3717.3
3705.3
3612.8
3665
3670.8
3687.6
3708.2
3737.2
3748.7
3785.3
3787.1
3785.8
3749.7
3716.3
3650
3096.9
3703.2
3716
3736.9
3771.9
3704
3824.2
3733.5
3827.5
3827.6
3696.5
3675.8
3757.5
3753.3
3418.7
3772.9


Summary of computational transaction
Raw Input view raw input (R code)
Raw Outputview raw output of R engine
Computing time1 seconds
R ServerBig Analytics Cloud Computing Center

\begin{tabular}{lllllllll}
\hline
Summary of computational transaction \tabularnewline
Raw Input view raw input (R code)  \tabularnewline
Raw Outputview raw output of R engine  \tabularnewline
Computing time1 seconds \tabularnewline
R ServerBig Analytics Cloud Computing Center \tabularnewline
\hline
\end{tabular}
%Source: https://freestatistics.org/blog/index.php?pk=302525&T=0

[TABLE]
[ROW]
Summary of computational transaction[/C][/ROW] [ROW]Raw Input[/C] view raw input (R code) [/C][/ROW] [ROW]Raw Output[/C]view raw output of R engine [/C][/ROW] [ROW]Computing time[/C]1 seconds[/C][/ROW] [ROW]R Server[/C]Big Analytics Cloud Computing Center[/C][/ROW] [/TABLE] Source: https://freestatistics.org/blog/index.php?pk=302525&T=0

Globally Unique Identifier (entire table): ba.freestatistics.org/blog/index.php?pk=302525&T=0

As an alternative you can also use a QR Code:  

The GUIDs for individual cells are displayed in the table below:

Summary of computational transaction
Raw Input view raw input (R code)
Raw Outputview raw output of R engine
Computing time1 seconds
R ServerBig Analytics Cloud Computing Center


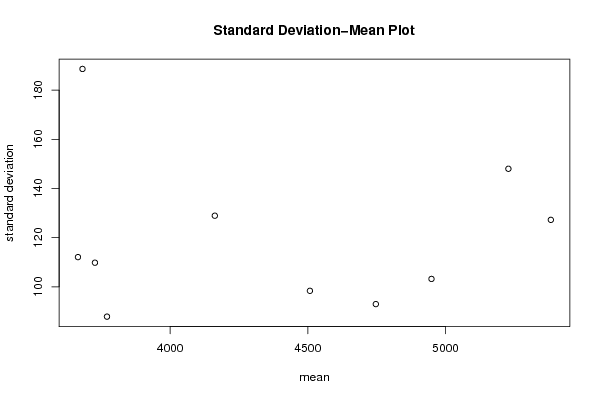
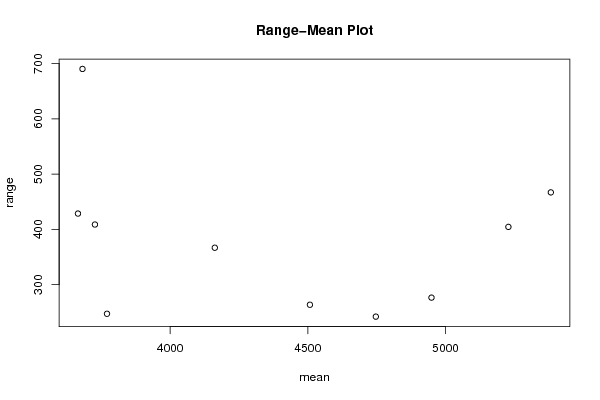
Standard Deviation-Mean Plot
SectionMeanStandard DeviationRange
15381.98333333333127.227861680839467
25227.90833333333148.01184509315404.599999999999
34948.78333333333103.189682653163276.7
44746.7592.951497616181242.3
54507.57598.3489624200016263.8
64162.30833333333128.905578258121366.900000000001
73770.9666666666787.8387606856328247.5
83665.58333333333112.07709062259428.7
93682.03333333333188.632621941715690.2
103727.28333333333109.782958052641408.9

\begin{tabular}{lllllllll}
\hline
Standard Deviation-Mean Plot \tabularnewline
Section & Mean & Standard Deviation & Range \tabularnewline
1 & 5381.98333333333 & 127.227861680839 & 467 \tabularnewline
2 & 5227.90833333333 & 148.01184509315 & 404.599999999999 \tabularnewline
3 & 4948.78333333333 & 103.189682653163 & 276.7 \tabularnewline
4 & 4746.75 & 92.951497616181 & 242.3 \tabularnewline
5 & 4507.575 & 98.3489624200016 & 263.8 \tabularnewline
6 & 4162.30833333333 & 128.905578258121 & 366.900000000001 \tabularnewline
7 & 3770.96666666667 & 87.8387606856328 & 247.5 \tabularnewline
8 & 3665.58333333333 & 112.07709062259 & 428.7 \tabularnewline
9 & 3682.03333333333 & 188.632621941715 & 690.2 \tabularnewline
10 & 3727.28333333333 & 109.782958052641 & 408.9 \tabularnewline
\hline
\end{tabular}
%Source: https://freestatistics.org/blog/index.php?pk=302525&T=1

[TABLE]
[ROW][C]Standard Deviation-Mean Plot[/C][/ROW]
[ROW][C]Section[/C][C]Mean[/C][C]Standard Deviation[/C][C]Range[/C][/ROW]
[ROW][C]1[/C][C]5381.98333333333[/C][C]127.227861680839[/C][C]467[/C][/ROW]
[ROW][C]2[/C][C]5227.90833333333[/C][C]148.01184509315[/C][C]404.599999999999[/C][/ROW]
[ROW][C]3[/C][C]4948.78333333333[/C][C]103.189682653163[/C][C]276.7[/C][/ROW]
[ROW][C]4[/C][C]4746.75[/C][C]92.951497616181[/C][C]242.3[/C][/ROW]
[ROW][C]5[/C][C]4507.575[/C][C]98.3489624200016[/C][C]263.8[/C][/ROW]
[ROW][C]6[/C][C]4162.30833333333[/C][C]128.905578258121[/C][C]366.900000000001[/C][/ROW]
[ROW][C]7[/C][C]3770.96666666667[/C][C]87.8387606856328[/C][C]247.5[/C][/ROW]
[ROW][C]8[/C][C]3665.58333333333[/C][C]112.07709062259[/C][C]428.7[/C][/ROW]
[ROW][C]9[/C][C]3682.03333333333[/C][C]188.632621941715[/C][C]690.2[/C][/ROW]
[ROW][C]10[/C][C]3727.28333333333[/C][C]109.782958052641[/C][C]408.9[/C][/ROW]
[/TABLE]
Source: https://freestatistics.org/blog/index.php?pk=302525&T=1

Globally Unique Identifier (entire table): ba.freestatistics.org/blog/index.php?pk=302525&T=1

As an alternative you can also use a QR Code:  

The GUIDs for individual cells are displayed in the table below:

Standard Deviation-Mean Plot
SectionMeanStandard DeviationRange
15381.98333333333127.227861680839467
25227.90833333333148.01184509315404.599999999999
34948.78333333333103.189682653163276.7
44746.7592.951497616181242.3
54507.57598.3489624200016263.8
64162.30833333333128.905578258121366.900000000001
73770.9666666666787.8387606856328247.5
83665.58333333333112.07709062259428.7
93682.03333333333188.632621941715690.2
103727.28333333333109.782958052641408.9


Regression: S.E.(k) = alpha + beta * Mean(k)
alpha129.64453634441
beta-0.00227010125630055
S.D.0.0160168050551911
T-STAT-0.141732464650608
p-value0.890795554478042

\begin{tabular}{lllllllll}
\hline
Regression: S.E.(k) = alpha + beta * Mean(k) \tabularnewline
alpha & 129.64453634441 \tabularnewline
beta & -0.00227010125630055 \tabularnewline
S.D. & 0.0160168050551911 \tabularnewline
T-STAT & -0.141732464650608 \tabularnewline
p-value & 0.890795554478042 \tabularnewline
\hline
\end{tabular}
%Source: https://freestatistics.org/blog/index.php?pk=302525&T=2

[TABLE]
[ROW][C]Regression: S.E.(k) = alpha + beta * Mean(k)[/C][/ROW]
[ROW][C]alpha[/C][C]129.64453634441[/C][/ROW]
[ROW][C]beta[/C][C]-0.00227010125630055[/C][/ROW]
[ROW][C]S.D.[/C][C]0.0160168050551911[/C][/ROW]
[ROW][C]T-STAT[/C][C]-0.141732464650608[/C][/ROW]
[ROW][C]p-value[/C][C]0.890795554478042[/C][/ROW]
[/TABLE]
Source: https://freestatistics.org/blog/index.php?pk=302525&T=2

Globally Unique Identifier (entire table): ba.freestatistics.org/blog/index.php?pk=302525&T=2

As an alternative you can also use a QR Code:  

The GUIDs for individual cells are displayed in the table below:

Regression: S.E.(k) = alpha + beta * Mean(k)
alpha129.64453634441
beta-0.00227010125630055
S.D.0.0160168050551911
T-STAT-0.141732464650608
p-value0.890795554478042


Regression: ln S.E.(k) = alpha + beta * ln Mean(k)
alpha5.05108372199489
beta-0.0348462286279654
S.D.0.540870028550188
T-STAT-0.0644262517584331
p-value0.950211608542544
Lambda1.03484622862797

\begin{tabular}{lllllllll}
\hline
Regression: ln S.E.(k) = alpha + beta * ln Mean(k) \tabularnewline
alpha & 5.05108372199489 \tabularnewline
beta & -0.0348462286279654 \tabularnewline
S.D. & 0.540870028550188 \tabularnewline
T-STAT & -0.0644262517584331 \tabularnewline
p-value & 0.950211608542544 \tabularnewline
Lambda & 1.03484622862797 \tabularnewline
\hline
\end{tabular}
%Source: https://freestatistics.org/blog/index.php?pk=302525&T=3

[TABLE]
[ROW][C]Regression: ln S.E.(k) = alpha + beta * ln Mean(k)[/C][/ROW]
[ROW][C]alpha[/C][C]5.05108372199489[/C][/ROW]
[ROW][C]beta[/C][C]-0.0348462286279654[/C][/ROW]
[ROW][C]S.D.[/C][C]0.540870028550188[/C][/ROW]
[ROW][C]T-STAT[/C][C]-0.0644262517584331[/C][/ROW]
[ROW][C]p-value[/C][C]0.950211608542544[/C][/ROW]
[ROW][C]Lambda[/C][C]1.03484622862797[/C][/ROW]
[/TABLE]
Source: https://freestatistics.org/blog/index.php?pk=302525&T=3

Globally Unique Identifier (entire table): ba.freestatistics.org/blog/index.php?pk=302525&T=3

As an alternative you can also use a QR Code:  

The GUIDs for individual cells are displayed in the table below:

Regression: ln S.E.(k) = alpha + beta * ln Mean(k)
alpha5.05108372199489
beta-0.0348462286279654
S.D.0.540870028550188
T-STAT-0.0644262517584331
p-value0.950211608542544
Lambda1.03484622862797


Parameters (Session):
par1 = 12 ;
Parameters (R input):
par1 = 12 ;
R code (references can be found in the software module):
par1 <- as.numeric(par1)
(n <- length(x))
(np <- floor(n / par1))
arr <- array(NA,dim=c(par1,np))
j <- 0
k <- 1
for (i in 1:(np*par1))
{
j = j + 1
arr[j,k] <- x[i]
if (j == par1) {
j = 0
k=k+1
}
}
arr
arr.mean <- array(NA,dim=np)
arr.sd <- array(NA,dim=np)
arr.range <- array(NA,dim=np)
for (j in 1:np)
{
arr.mean[j] <- mean(arr[,j],na.rm=TRUE)
arr.sd[j] <- sd(arr[,j],na.rm=TRUE)
arr.range[j] <- max(arr[,j],na.rm=TRUE) - min(arr[,j],na.rm=TRUE)
}
arr.mean
arr.sd
arr.range
(lm1 <- lm(arr.sd~arr.mean))
(lnlm1 <- lm(log(arr.sd)~log(arr.mean)))
(lm2 <- lm(arr.range~arr.mean))
bitmap(file='test1.png')
plot(arr.mean,arr.sd,main='Standard Deviation-Mean Plot',xlab='mean',ylab='standard deviation')
dev.off()
bitmap(file='test2.png')
plot(arr.mean,arr.range,main='Range-Mean Plot',xlab='mean',ylab='range')
dev.off()
load(file='createtable')
a<-table.start()
a<-table.row.start(a)
a<-table.element(a,'Standard Deviation-Mean Plot',4,TRUE)
a<-table.row.end(a)
a<-table.row.start(a)
a<-table.element(a,'Section',header=TRUE)
a<-table.element(a,'Mean',header=TRUE)
a<-table.element(a,'Standard Deviation',header=TRUE)
a<-table.element(a,'Range',header=TRUE)
a<-table.row.end(a)
for (j in 1:np) {
a<-table.row.start(a)
a<-table.element(a,j,header=TRUE)
a<-table.element(a,arr.mean[j])
a<-table.element(a,arr.sd[j] )
a<-table.element(a,arr.range[j] )
a<-table.row.end(a)
}
a<-table.end(a)
table.save(a,file='mytable.tab')
a<-table.start()
a<-table.row.start(a)
a<-table.element(a,'Regression: S.E.(k) = alpha + beta * Mean(k)',2,TRUE)
a<-table.row.end(a)
a<-table.row.start(a)
a<-table.element(a,'alpha',header=TRUE)
a<-table.element(a,lm1$coefficients[[1]])
a<-table.row.end(a)
a<-table.row.start(a)
a<-table.element(a,'beta',header=TRUE)
a<-table.element(a,lm1$coefficients[[2]])
a<-table.row.end(a)
a<-table.row.start(a)
a<-table.element(a,'S.D.',header=TRUE)
a<-table.element(a,summary(lm1)$coefficients[2,2])
a<-table.row.end(a)
a<-table.row.start(a)
a<-table.element(a,'T-STAT',header=TRUE)
a<-table.element(a,summary(lm1)$coefficients[2,3])
a<-table.row.end(a)
a<-table.row.start(a)
a<-table.element(a,'p-value',header=TRUE)
a<-table.element(a,summary(lm1)$coefficients[2,4])
a<-table.row.end(a)
a<-table.end(a)
table.save(a,file='mytable1.tab')
a<-table.start()
a<-table.row.start(a)
a<-table.element(a,'Regression: ln S.E.(k) = alpha + beta * ln Mean(k)',2,TRUE)
a<-table.row.end(a)
a<-table.row.start(a)
a<-table.element(a,'alpha',header=TRUE)
a<-table.element(a,lnlm1$coefficients[[1]])
a<-table.row.end(a)
a<-table.row.start(a)
a<-table.element(a,'beta',header=TRUE)
a<-table.element(a,lnlm1$coefficients[[2]])
a<-table.row.end(a)
a<-table.row.start(a)
a<-table.element(a,'S.D.',header=TRUE)
a<-table.element(a,summary(lnlm1)$coefficients[2,2])
a<-table.row.end(a)
a<-table.row.start(a)
a<-table.element(a,'T-STAT',header=TRUE)
a<-table.element(a,summary(lnlm1)$coefficients[2,3])
a<-table.row.end(a)
a<-table.row.start(a)
a<-table.element(a,'p-value',header=TRUE)
a<-table.element(a,summary(lnlm1)$coefficients[2,4])
a<-table.row.end(a)
a<-table.row.start(a)
a<-table.element(a,'Lambda',header=TRUE)
a<-table.element(a,1-lnlm1$coefficients[[2]])
a<-table.row.end(a)
a<-table.end(a)
table.save(a,file='mytable2.tab')