Free Statistics

of Irreproducible Research!

Author's title

Author*Unverified author*
R Software Modulerwasp_smp.wasp
Title produced by softwareStandard Deviation-Mean Plot
Date of computationSat, 21 May 2016 11:02:45 +0100
Cite this page as followsStatistical Computations at FreeStatistics.org, Office for Research Development and Education, URL https://freestatistics.org/blog/index.php?v=date/2016/May/21/t14638250761brp85s814d3m5k.htm/, Retrieved Mon, 20 May 2024 05:24:32 +0000
Statistical Computations at FreeStatistics.org, Office for Research Development and Education, URL https://freestatistics.org/blog/index.php?pk=295423, Retrieved Mon, 20 May 2024 05:24:32 +0000
QR Codes:

Original text written by user:
IsPrivate?No (this computation is public)
User-defined keywords
Estimated Impact96
Family? (F = Feedback message, R = changed R code, M = changed R Module, P = changed Parameters, D = changed Data)
-     [Blocked Bootstrap Plot - Central Tendency] [] [2016-04-28 13:59:09] [e0e331a99625eea606a98e25ad565fcb]
- RMPD    [Standard Deviation-Mean Plot] [] [2016-05-21 10:02:45] [9d122f8260d20611f07666190c7f1fd6] [Current]
Feedback Forum

Post a new message
Dataseries X:
45564.6
47295.5
46465.5
50679.5
47452.8
49415.4
48165.3
51814
49030.7
50820.8
49729.5
53501.6
50524.9
52095
51290.3
55064
52505.2
54318.3
53039.6
57607.6
54236.4
56586.4
55614
60085.9
56963.5
59152.8
57804.6
62541.5
59449.3
61704.7
60399
65724.7
62679.4
65526.5
64274.8
68769.1
63542.8
66198
64544.9
71041.8
66087.2
69005.8
66897
73702
68485.3
71457
69774.6
76479.7
71204.7
73783.9
71651
78541.6
72714.4
75258
73168.1
79701.6
73944.5
76401.2
73948.1
80583.3


Summary of computational transaction
Raw Inputview raw input (R code)
Raw Outputview raw output of R engine
Computing time1 seconds
R Server'Gertrude Mary Cox' @ cox.wessa.net

\begin{tabular}{lllllllll}
\hline
Summary of computational transaction \tabularnewline
Raw Input & view raw input (R code)  \tabularnewline
Raw Output & view raw output of R engine  \tabularnewline
Computing time & 1 seconds \tabularnewline
R Server & 'Gertrude Mary Cox' @ cox.wessa.net \tabularnewline
\hline
\end{tabular}
%Source: https://freestatistics.org/blog/index.php?pk=295423&T=0

[TABLE]
[ROW][C]Summary of computational transaction[/C][/ROW]
[ROW][C]Raw Input[/C][C]view raw input (R code) [/C][/ROW]
[ROW][C]Raw Output[/C][C]view raw output of R engine [/C][/ROW]
[ROW][C]Computing time[/C][C]1 seconds[/C][/ROW]
[ROW][C]R Server[/C][C]'Gertrude Mary Cox' @ cox.wessa.net[/C][/ROW]
[/TABLE]
Source: https://freestatistics.org/blog/index.php?pk=295423&T=0

Globally Unique Identifier (entire table): ba.freestatistics.org/blog/index.php?pk=295423&T=0

As an alternative you can also use a QR Code:  

The GUIDs for individual cells are displayed in the table below:

Summary of computational transaction
Raw Inputview raw input (R code)
Raw Outputview raw output of R engine
Computing time1 seconds
R Server'Gertrude Mary Cox' @ cox.wessa.net


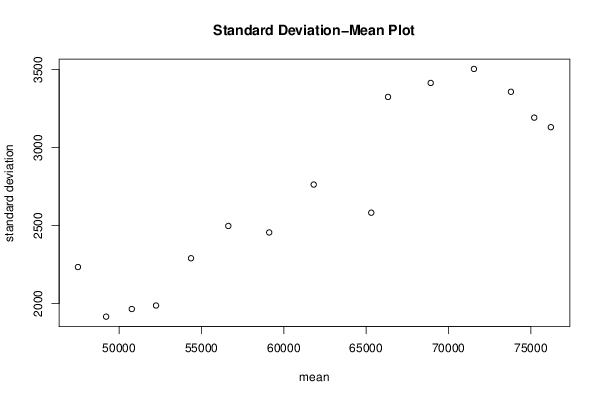
Standard Deviation-Mean Plot
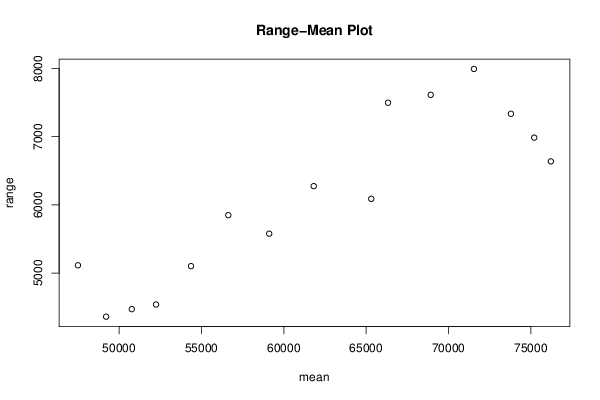
SectionMeanStandard DeviationRange
147501.2752233.60675496685114.9
249211.8751915.040558969964361.2
350770.651964.011392533154470.9
452243.551986.575671014494539.1
554367.6752289.988953939885102.4
656630.6752497.113060282485849.5
759115.62455.499274417875578
861819.4252762.814648596616275.39999999999
965312.452582.2416908576089.7
1066331.8753325.333819207737499
11689233415.26643567777614.8
1271549.153504.997358534437994.39999999999
1373795.33358.408576493747336.90000000001
1475210.5253192.394525926696987.20000000001
1576219.2753131.062018309446638.8

\begin{tabular}{lllllllll}
\hline
Standard Deviation-Mean Plot \tabularnewline
Section & Mean & Standard Deviation & Range \tabularnewline
1 & 47501.275 & 2233.6067549668 & 5114.9 \tabularnewline
2 & 49211.875 & 1915.04055896996 & 4361.2 \tabularnewline
3 & 50770.65 & 1964.01139253315 & 4470.9 \tabularnewline
4 & 52243.55 & 1986.57567101449 & 4539.1 \tabularnewline
5 & 54367.675 & 2289.98895393988 & 5102.4 \tabularnewline
6 & 56630.675 & 2497.11306028248 & 5849.5 \tabularnewline
7 & 59115.6 & 2455.49927441787 & 5578 \tabularnewline
8 & 61819.425 & 2762.81464859661 & 6275.39999999999 \tabularnewline
9 & 65312.45 & 2582.241690857 & 6089.7 \tabularnewline
10 & 66331.875 & 3325.33381920773 & 7499 \tabularnewline
11 & 68923 & 3415.2664356777 & 7614.8 \tabularnewline
12 & 71549.15 & 3504.99735853443 & 7994.39999999999 \tabularnewline
13 & 73795.3 & 3358.40857649374 & 7336.90000000001 \tabularnewline
14 & 75210.525 & 3192.39452592669 & 6987.20000000001 \tabularnewline
15 & 76219.275 & 3131.06201830944 & 6638.8 \tabularnewline
\hline
\end{tabular}
%Source: https://freestatistics.org/blog/index.php?pk=295423&T=1

[TABLE]
[ROW][C]Standard Deviation-Mean Plot[/C][/ROW]
[ROW][C]Section[/C][C]Mean[/C][C]Standard Deviation[/C][C]Range[/C][/ROW]
[ROW][C]1[/C][C]47501.275[/C][C]2233.6067549668[/C][C]5114.9[/C][/ROW]
[ROW][C]2[/C][C]49211.875[/C][C]1915.04055896996[/C][C]4361.2[/C][/ROW]
[ROW][C]3[/C][C]50770.65[/C][C]1964.01139253315[/C][C]4470.9[/C][/ROW]
[ROW][C]4[/C][C]52243.55[/C][C]1986.57567101449[/C][C]4539.1[/C][/ROW]
[ROW][C]5[/C][C]54367.675[/C][C]2289.98895393988[/C][C]5102.4[/C][/ROW]
[ROW][C]6[/C][C]56630.675[/C][C]2497.11306028248[/C][C]5849.5[/C][/ROW]
[ROW][C]7[/C][C]59115.6[/C][C]2455.49927441787[/C][C]5578[/C][/ROW]
[ROW][C]8[/C][C]61819.425[/C][C]2762.81464859661[/C][C]6275.39999999999[/C][/ROW]
[ROW][C]9[/C][C]65312.45[/C][C]2582.241690857[/C][C]6089.7[/C][/ROW]
[ROW][C]10[/C][C]66331.875[/C][C]3325.33381920773[/C][C]7499[/C][/ROW]
[ROW][C]11[/C][C]68923[/C][C]3415.2664356777[/C][C]7614.8[/C][/ROW]
[ROW][C]12[/C][C]71549.15[/C][C]3504.99735853443[/C][C]7994.39999999999[/C][/ROW]
[ROW][C]13[/C][C]73795.3[/C][C]3358.40857649374[/C][C]7336.90000000001[/C][/ROW]
[ROW][C]14[/C][C]75210.525[/C][C]3192.39452592669[/C][C]6987.20000000001[/C][/ROW]
[ROW][C]15[/C][C]76219.275[/C][C]3131.06201830944[/C][C]6638.8[/C][/ROW]
[/TABLE]
Source: https://freestatistics.org/blog/index.php?pk=295423&T=1

Globally Unique Identifier (entire table): ba.freestatistics.org/blog/index.php?pk=295423&T=1

As an alternative you can also use a QR Code:  

The GUIDs for individual cells are displayed in the table below:

Standard Deviation-Mean Plot
SectionMeanStandard DeviationRange
147501.2752233.60675496685114.9
249211.8751915.040558969964361.2
350770.651964.011392533154470.9
452243.551986.575671014494539.1
554367.6752289.988953939885102.4
656630.6752497.113060282485849.5
759115.62455.499274417875578
861819.4252762.814648596616275.39999999999
965312.452582.2416908576089.7
1066331.8753325.333819207737499
11689233415.26643567777614.8
1271549.153504.997358534437994.39999999999
1373795.33358.408576493747336.90000000001
1475210.5253192.394525926696987.20000000001
1576219.2753131.062018309446638.8


Regression: S.E.(k) = alpha + beta * Mean(k)
alpha-548.89850232024
beta0.0525809594599836
S.D.0.0066097053774109
T-STAT7.95511395102156
p-value2.37811953392521e-06

\begin{tabular}{lllllllll}
\hline
Regression: S.E.(k) = alpha + beta * Mean(k) \tabularnewline
alpha & -548.89850232024 \tabularnewline
beta & 0.0525809594599836 \tabularnewline
S.D. & 0.0066097053774109 \tabularnewline
T-STAT & 7.95511395102156 \tabularnewline
p-value & 2.37811953392521e-06 \tabularnewline
\hline
\end{tabular}
%Source: https://freestatistics.org/blog/index.php?pk=295423&T=2

[TABLE]
[ROW][C]Regression: S.E.(k) = alpha + beta * Mean(k)[/C][/ROW]
[ROW][C]alpha[/C][C]-548.89850232024[/C][/ROW]
[ROW][C]beta[/C][C]0.0525809594599836[/C][/ROW]
[ROW][C]S.D.[/C][C]0.0066097053774109[/C][/ROW]
[ROW][C]T-STAT[/C][C]7.95511395102156[/C][/ROW]
[ROW][C]p-value[/C][C]2.37811953392521e-06[/C][/ROW]
[/TABLE]
Source: https://freestatistics.org/blog/index.php?pk=295423&T=2

Globally Unique Identifier (entire table): ba.freestatistics.org/blog/index.php?pk=295423&T=2

As an alternative you can also use a QR Code:  

The GUIDs for individual cells are displayed in the table below:

Regression: S.E.(k) = alpha + beta * Mean(k)
alpha-548.89850232024
beta0.0525809594599836
S.D.0.0066097053774109
T-STAT7.95511395102156
p-value2.37811953392521e-06


Regression: ln S.E.(k) = alpha + beta * ln Mean(k)
alpha-5.60961954630554
beta1.22413445125855
S.D.0.14596826289387
T-STAT8.38630553648902
p-value1.32940534213359e-06
Lambda-0.22413445125855

\begin{tabular}{lllllllll}
\hline
Regression: ln S.E.(k) = alpha + beta * ln Mean(k) \tabularnewline
alpha & -5.60961954630554 \tabularnewline
beta & 1.22413445125855 \tabularnewline
S.D. & 0.14596826289387 \tabularnewline
T-STAT & 8.38630553648902 \tabularnewline
p-value & 1.32940534213359e-06 \tabularnewline
Lambda & -0.22413445125855 \tabularnewline
\hline
\end{tabular}
%Source: https://freestatistics.org/blog/index.php?pk=295423&T=3

[TABLE]
[ROW][C]Regression: ln S.E.(k) = alpha + beta * ln Mean(k)[/C][/ROW]
[ROW][C]alpha[/C][C]-5.60961954630554[/C][/ROW]
[ROW][C]beta[/C][C]1.22413445125855[/C][/ROW]
[ROW][C]S.D.[/C][C]0.14596826289387[/C][/ROW]
[ROW][C]T-STAT[/C][C]8.38630553648902[/C][/ROW]
[ROW][C]p-value[/C][C]1.32940534213359e-06[/C][/ROW]
[ROW][C]Lambda[/C][C]-0.22413445125855[/C][/ROW]
[/TABLE]
Source: https://freestatistics.org/blog/index.php?pk=295423&T=3

Globally Unique Identifier (entire table): ba.freestatistics.org/blog/index.php?pk=295423&T=3

As an alternative you can also use a QR Code:  

The GUIDs for individual cells are displayed in the table below:

Regression: ln S.E.(k) = alpha + beta * ln Mean(k)
alpha-5.60961954630554
beta1.22413445125855
S.D.0.14596826289387
T-STAT8.38630553648902
p-value1.32940534213359e-06
Lambda-0.22413445125855


Parameters (Session):
par1 = 4 ;
Parameters (R input):
par1 = 4 ;
R code (references can be found in the software module):
par1 <- as.numeric(par1)
(n <- length(x))
(np <- floor(n / par1))
arr <- array(NA,dim=c(par1,np))
j <- 0
k <- 1
for (i in 1:(np*par1))
{
j = j + 1
arr[j,k] <- x[i]
if (j == par1) {
j = 0
k=k+1
}
}
arr
arr.mean <- array(NA,dim=np)
arr.sd <- array(NA,dim=np)
arr.range <- array(NA,dim=np)
for (j in 1:np)
{
arr.mean[j] <- mean(arr[,j],na.rm=TRUE)
arr.sd[j] <- sd(arr[,j],na.rm=TRUE)
arr.range[j] <- max(arr[,j],na.rm=TRUE) - min(arr[,j],na.rm=TRUE)
}
arr.mean
arr.sd
arr.range
(lm1 <- lm(arr.sd~arr.mean))
(lnlm1 <- lm(log(arr.sd)~log(arr.mean)))
(lm2 <- lm(arr.range~arr.mean))
bitmap(file='test1.png')
plot(arr.mean,arr.sd,main='Standard Deviation-Mean Plot',xlab='mean',ylab='standard deviation')
dev.off()
bitmap(file='test2.png')
plot(arr.mean,arr.range,main='Range-Mean Plot',xlab='mean',ylab='range')
dev.off()
load(file='createtable')
a<-table.start()
a<-table.row.start(a)
a<-table.element(a,'Standard Deviation-Mean Plot',4,TRUE)
a<-table.row.end(a)
a<-table.row.start(a)
a<-table.element(a,'Section',header=TRUE)
a<-table.element(a,'Mean',header=TRUE)
a<-table.element(a,'Standard Deviation',header=TRUE)
a<-table.element(a,'Range',header=TRUE)
a<-table.row.end(a)
for (j in 1:np) {
a<-table.row.start(a)
a<-table.element(a,j,header=TRUE)
a<-table.element(a,arr.mean[j])
a<-table.element(a,arr.sd[j] )
a<-table.element(a,arr.range[j] )
a<-table.row.end(a)
}
a<-table.end(a)
table.save(a,file='mytable.tab')
a<-table.start()
a<-table.row.start(a)
a<-table.element(a,'Regression: S.E.(k) = alpha + beta * Mean(k)',2,TRUE)
a<-table.row.end(a)
a<-table.row.start(a)
a<-table.element(a,'alpha',header=TRUE)
a<-table.element(a,lm1$coefficients[[1]])
a<-table.row.end(a)
a<-table.row.start(a)
a<-table.element(a,'beta',header=TRUE)
a<-table.element(a,lm1$coefficients[[2]])
a<-table.row.end(a)
a<-table.row.start(a)
a<-table.element(a,'S.D.',header=TRUE)
a<-table.element(a,summary(lm1)$coefficients[2,2])
a<-table.row.end(a)
a<-table.row.start(a)
a<-table.element(a,'T-STAT',header=TRUE)
a<-table.element(a,summary(lm1)$coefficients[2,3])
a<-table.row.end(a)
a<-table.row.start(a)
a<-table.element(a,'p-value',header=TRUE)
a<-table.element(a,summary(lm1)$coefficients[2,4])
a<-table.row.end(a)
a<-table.end(a)
table.save(a,file='mytable1.tab')
a<-table.start()
a<-table.row.start(a)
a<-table.element(a,'Regression: ln S.E.(k) = alpha + beta * ln Mean(k)',2,TRUE)
a<-table.row.end(a)
a<-table.row.start(a)
a<-table.element(a,'alpha',header=TRUE)
a<-table.element(a,lnlm1$coefficients[[1]])
a<-table.row.end(a)
a<-table.row.start(a)
a<-table.element(a,'beta',header=TRUE)
a<-table.element(a,lnlm1$coefficients[[2]])
a<-table.row.end(a)
a<-table.row.start(a)
a<-table.element(a,'S.D.',header=TRUE)
a<-table.element(a,summary(lnlm1)$coefficients[2,2])
a<-table.row.end(a)
a<-table.row.start(a)
a<-table.element(a,'T-STAT',header=TRUE)
a<-table.element(a,summary(lnlm1)$coefficients[2,3])
a<-table.row.end(a)
a<-table.row.start(a)
a<-table.element(a,'p-value',header=TRUE)
a<-table.element(a,summary(lnlm1)$coefficients[2,4])
a<-table.row.end(a)
a<-table.row.start(a)
a<-table.element(a,'Lambda',header=TRUE)
a<-table.element(a,1-lnlm1$coefficients[[2]])
a<-table.row.end(a)
a<-table.end(a)
table.save(a,file='mytable2.tab')