Free Statistics

of Irreproducible Research!

Author's title

Author*The author of this computation has been verified*
R Software Modulerwasp_Simple Regression Y ~ X.wasp
Title produced by softwareSimple Linear Regression
Date of computationWed, 30 Jan 2019 13:01:18 +0100
Cite this page as followsStatistical Computations at FreeStatistics.org, Office for Research Development and Education, URL https://freestatistics.org/blog/index.php?v=date/2019/Jan/30/t1548849737z10jhvf5k0a6hjs.htm/, Retrieved Sun, 28 Apr 2024 08:36:51 +0000
Statistical Computations at FreeStatistics.org, Office for Research Development and Education, URL https://freestatistics.org/blog/index.php?pk=317039, Retrieved Sun, 28 Apr 2024 08:36:51 +0000
QR Codes:

Original text written by user:
IsPrivate?No (this computation is public)
User-defined keywords
Estimated Impact84
Family? (F = Feedback message, R = changed R code, M = changed R Module, P = changed Parameters, D = changed Data)
-       [Simple Linear Regression] [] [2019-01-30 12:01:18] [d1dc865c153eafcb494ab05c20260d87] [Current]
Feedback Forum

Post a new message
Dataseries X:
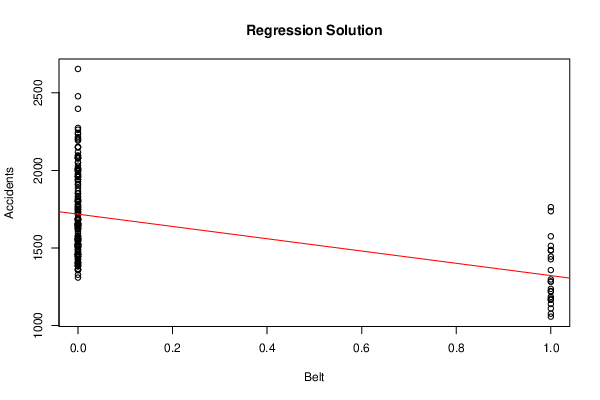
1687 0
1508 0
1507 0
1385 0
1632 0
1511 0
1559 0
1630 0
1579 0
1653 0
2152 0
2148 0
1752 0
1765 0
1717 0
1558 0
1575 0
1520 0
1805 0
1800 0
1719 0
2008 0
2242 0
2478 0
2030 0
1655 0
1693 0
1623 0
1805 0
1746 0
1795 0
1926 0
1619 0
1992 0
2233 0
2192 0
2080 0
1768 0
1835 0
1569 0
1976 0
1853 0
1965 0
1689 0
1778 0
1976 0
2397 0
2654 0
2097 0
1963 0
1677 0
1941 0
2003 0
1813 0
2012 0
1912 0
2084 0
2080 0
2118 0
2150 0
1608 0
1503 0
1548 0
1382 0
1731 0
1798 0
1779 0
1887 0
2004 0
2077 0
2092 0
2051 0
1577 0
1356 0
1652 0
1382 0
1519 0
1421 0
1442 0
1543 0
1656 0
1561 0
1905 0
2199 0
1473 0
1655 0
1407 0
1395 0
1530 0
1309 0
1526 0
1327 0
1627 0
1748 0
1958 0
2274 0
1648 0
1401 0
1411 0
1403 0
1394 0
1520 0
1528 0
1643 0
1515 0
1685 0
2000 0
2215 0
1956 0
1462 0
1563 0
1459 0
1446 0
1622 0
1657 0
1638 0
1643 0
1683 0
2050 0
2262 0
1813 0
1445 0
1762 0
1461 0
1556 0
1431 0
1427 0
1554 0
1645 0
1653 0
2016 0
2207 0
1665 0
1361 0
1506 0
1360 0
1453 0
1522 0
1460 0
1552 0
1548 0
1827 0
1737 0
1941 0
1474 0
1458 0
1542 0
1404 0
1522 0
1385 0
1641 0
1510 0
1681 0
1938 0
1868 0
1726 0
1456 0
1445 0
1456 0
1365 0
1487 0
1558 0
1488 0
1684 0
1594 0
1850 0
1998 0
2079 0
1494 0
1057 1
1218 1
1168 1
1236 1
1076 1
1174 1
1139 1
1427 1
1487 1
1483 1
1513 1
1357 1
1165 1
1282 1
1110 1
1297 1
1185 1
1222 1
1284 1
1444 1
1575 1
1737 1
1763 1


Summary of computational transaction
Raw Input view raw input (R code)
Raw Outputview raw output of R engine
Computing time7 seconds
R ServerBig Analytics Cloud Computing Center

\begin{tabular}{lllllllll}
\hline
Summary of computational transaction \tabularnewline
Raw Input view raw input (R code)  \tabularnewline
Raw Outputview raw output of R engine  \tabularnewline
Computing time7 seconds \tabularnewline
R ServerBig Analytics Cloud Computing Center \tabularnewline
\hline
\end{tabular}
%Source: https://freestatistics.org/blog/index.php?pk=317039&T=0

[TABLE]
[ROW]
Summary of computational transaction[/C][/ROW] [ROW]Raw Input[/C] view raw input (R code) [/C][/ROW] [ROW]Raw Output[/C]view raw output of R engine [/C][/ROW] [ROW]Computing time[/C]7 seconds[/C][/ROW] [ROW]R Server[/C]Big Analytics Cloud Computing Center[/C][/ROW] [/TABLE] Source: https://freestatistics.org/blog/index.php?pk=317039&T=0

Globally Unique Identifier (entire table): ba.freestatistics.org/blog/index.php?pk=317039&T=0

As an alternative you can also use a QR Code:  

The GUIDs for individual cells are displayed in the table below:

Summary of computational transaction
Raw Input view raw input (R code)
Raw Outputview raw output of R engine
Computing time7 seconds
R ServerBig Analytics Cloud Computing Center


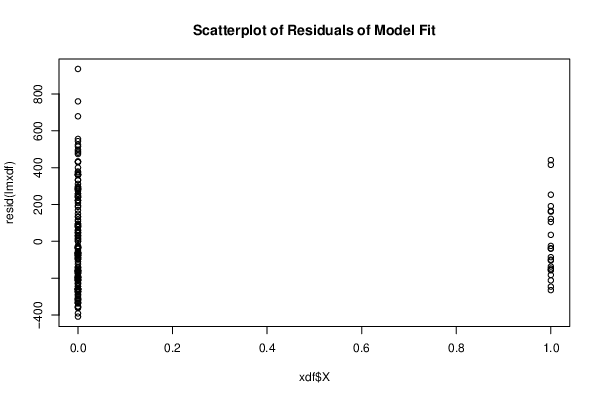
Linear Regression Model
Y ~ X
coefficients:
EstimateStd. Errort valuePr(>|t|)
(Intercept)1717.7512085.8860
X-396.05657.786-6.8540
- - -
Residual Std. Err. 260.004 on 190 df
Multiple R-sq. 0.198
95% CI Multiple R-sq. [0.113, 0.296]
Adjusted R-sq. 0.194

\begin{tabular}{lllllllll}
\hline
Linear Regression Model \tabularnewline
Y ~ X \tabularnewline
coefficients: &   \tabularnewline
  & Estimate & Std. Error & t value & Pr(>|t|) \tabularnewline
(Intercept) & 1717.751 & 20 & 85.886 & 0 \tabularnewline
X & -396.056 & 57.786 & -6.854 & 0 \tabularnewline
- - -  &   \tabularnewline
Residual Std. Err.  & 260.004  on  190 df \tabularnewline
Multiple R-sq.  & 0.198 \tabularnewline
95% CI Multiple R-sq.  & [0.113, 0.296] \tabularnewline
Adjusted R-sq.  & 0.194 \tabularnewline
\hline
\end{tabular}
%Source: https://freestatistics.org/blog/index.php?pk=317039&T=1

[TABLE]
[ROW][C]Linear Regression Model[/C][/ROW]
[ROW][C]Y ~ X[/C][/ROW]
[ROW][C]coefficients:[/C][C] [/C][/ROW]
[ROW][C] [/C][C]Estimate[/C][C]Std. Error[/C][C]t value[/C][C]Pr(>|t|)[/C][/ROW]
[C](Intercept)[/C][C]1717.751[/C][C]20[/C][C]85.886[/C][C]0[/C][/ROW]
[C]X[/C][C]-396.056[/C][C]57.786[/C][C]-6.854[/C][C]0[/C][/ROW]
[ROW][C]- - - [/C][C] [/C][/ROW]
[ROW][C]Residual Std. Err. [/C][C]260.004  on  190 df[/C][/ROW]
[ROW][C]Multiple R-sq. [/C][C]0.198[/C][/ROW]
[ROW][C]95% CI Multiple R-sq. [/C][C][0.113, 0.296][/C][/ROW]
[ROW][C]Adjusted R-sq. [/C][C]0.194[/C][/ROW]
[/TABLE]
Source: https://freestatistics.org/blog/index.php?pk=317039&T=1

Globally Unique Identifier (entire table): ba.freestatistics.org/blog/index.php?pk=317039&T=1

As an alternative you can also use a QR Code:  

The GUIDs for individual cells are displayed in the table below:

Linear Regression Model
Y ~ X
coefficients:
EstimateStd. Errort valuePr(>|t|)
(Intercept)1717.7512085.8860
X-396.05657.786-6.8540
- - -
Residual Std. Err. 260.004 on 190 df
Multiple R-sq. 0.198
95% CI Multiple R-sq. [0.113, 0.296]
Adjusted R-sq. 0.194


ANOVA Statistics
DfSum SqMean SqF valuePr(>F)
Belt13175602.4383175602.43846.9750
Residuals19012844428.43267602.255

\begin{tabular}{lllllllll}
\hline
ANOVA Statistics \tabularnewline
  & Df & Sum Sq & Mean Sq & F value & Pr(>F) \tabularnewline
Belt & 1 & 3175602.438 & 3175602.438 & 46.975 & 0 \tabularnewline
Residuals & 190 & 12844428.432 & 67602.255 &   &   \tabularnewline
\hline
\end{tabular}
%Source: https://freestatistics.org/blog/index.php?pk=317039&T=2

[TABLE]
[ROW][C]ANOVA Statistics[/C][/ROW]
[ROW][C] [/C][C]Df[/C][C]Sum Sq[/C][C]Mean Sq[/C][C]F value[/C][C]Pr(>F)[/C][/ROW]
[ROW][C]Belt[/C][C]1[/C][C]3175602.438[/C][C]3175602.438[/C][C]46.975[/C][C]0[/C][/ROW]
[ROW][C]Residuals[/C][C]190[/C][C]12844428.432[/C][C]67602.255[/C][C] [/C][C] [/C][/ROW]
[/TABLE]
Source: https://freestatistics.org/blog/index.php?pk=317039&T=2

Globally Unique Identifier (entire table): ba.freestatistics.org/blog/index.php?pk=317039&T=2

As an alternative you can also use a QR Code:  

The GUIDs for individual cells are displayed in the table below:

ANOVA Statistics
DfSum SqMean SqF valuePr(>F)
Belt13175602.4383175602.43846.9750
Residuals19012844428.43267602.255


Parameters (Session):
par1 = 1 ; par2 = 2 ; par3 = TRUE ;
Parameters (R input):
par1 = 1 ; par2 = 2 ; par3 = TRUE ;
R code (references can be found in the software module):
library(boot)
cat1 <- as.numeric(par1)
cat2<- as.numeric(par2)
intercept<-as.logical(par3)
x <- na.omit(t(x))
rsq <- function(formula, data, indices) {
d <- data[indices,] # allows boot to select sample
fit <- lm(formula, data=d)
return(summary(fit)$r.square)
}
xdf<-data.frame(na.omit(t(y)))
(V1<-dimnames(y)[[1]][cat1])
(V2<-dimnames(y)[[1]][cat2])
xdf <- data.frame(xdf[[cat1]], xdf[[cat2]])
names(xdf)<-c('Y', 'X')
if(intercept == FALSE) (lmxdf<-lm(Y~ X - 1, data = xdf) ) else (lmxdf<-lm(Y~ X, data = xdf) )
(results <- boot(data=xdf, statistic=rsq, R=1000, formula=Y~X))
sumlmxdf<-summary(lmxdf)
(aov.xdf<-aov(lmxdf) )
(anova.xdf<-anova(lmxdf) )
load(file='createtable')
a<-table.start()
nc <- ncol(sumlmxdf$'coefficients')
nr <- nrow(sumlmxdf$'coefficients')
a<-table.row.start(a)
a<-table.element(a,'Linear Regression Model', nc+1,TRUE)
a<-table.row.end(a)
a<-table.row.start(a)
a<-table.element(a, lmxdf$call['formula'],nc+1)
a<-table.row.end(a)
a<-table.row.start(a)
a<-table.element(a, 'coefficients:',1,TRUE)
a<-table.element(a, ' ',nc,TRUE)
a<-table.row.end(a)
a<-table.row.start(a)
a<-table.element(a, ' ',1,TRUE)
for(i in 1 : nc){
a<-table.element(a, dimnames(sumlmxdf$'coefficients')[[2]][i],1,TRUE)
}#end header
a<-table.row.end(a)
for(i in 1: nr){
a<-table.element(a,dimnames(sumlmxdf$'coefficients')[[1]][i] ,1,TRUE)
for(j in 1 : nc){
a<-table.element(a, round(sumlmxdf$coefficients[i, j], digits=3), 1 ,FALSE)
}
a<-table.row.end(a)
}
a<-table.row.start(a)
a<-table.element(a, '- - - ',1,TRUE)
a<-table.element(a, ' ',nc,FALSE)
a<-table.row.end(a)
a<-table.row.start(a)
a<-table.element(a, 'Residual Std. Err. ',1,TRUE)
a<-table.element(a, paste(round(sumlmxdf$'sigma', digits=3), ' on ', sumlmxdf$'df'[2], 'df') ,nc, FALSE)
a<-table.row.end(a)
a<-table.row.start(a)
a<-table.element(a, 'Multiple R-sq. ',1,TRUE)
a<-table.element(a, round(sumlmxdf$'r.squared', digits=3) ,nc, FALSE)
a<-table.row.end(a)
a<-table.row.start(a)
a<-table.element(a, '95% CI Multiple R-sq. ',1,TRUE)
a<-table.element(a, paste('[',round(boot.ci(results,type='bca')$bca[1,4], digits=3),', ', round(boot.ci(results,type='bca')$bca[1,5], digits=3), ']',sep='') ,nc, FALSE)
a<-table.row.end(a)
a<-table.row.start(a)
a<-table.element(a, 'Adjusted R-sq. ',1,TRUE)
a<-table.element(a, round(sumlmxdf$'adj.r.squared', digits=3) ,nc, FALSE)
a<-table.row.end(a)
a<-table.end(a)
table.save(a,file='mytable.tab')
a<-table.start()
a<-table.row.start(a)
a<-table.element(a,'ANOVA Statistics', 5+1,TRUE)
a<-table.row.end(a)
a<-table.row.start(a)
a<-table.element(a, ' ',1,TRUE)
a<-table.element(a, 'Df',1,TRUE)
a<-table.element(a, 'Sum Sq',1,TRUE)
a<-table.element(a, 'Mean Sq',1,TRUE)
a<-table.element(a, 'F value',1,TRUE)
a<-table.element(a, 'Pr(>F)',1,TRUE)
a<-table.row.end(a)
a<-table.row.start(a)
a<-table.element(a, V2,1,TRUE)
a<-table.element(a, anova.xdf$Df[1])
a<-table.element(a, round(anova.xdf$'Sum Sq'[1], digits=3))
a<-table.element(a, round(anova.xdf$'Mean Sq'[1], digits=3))
a<-table.element(a, round(anova.xdf$'F value'[1], digits=3))
a<-table.element(a, round(anova.xdf$'Pr(>F)'[1], digits=3))
a<-table.row.end(a)
a<-table.row.start(a)
a<-table.element(a, 'Residuals',1,TRUE)
a<-table.element(a, anova.xdf$Df[2])
a<-table.element(a, round(anova.xdf$'Sum Sq'[2], digits=3))
a<-table.element(a, round(anova.xdf$'Mean Sq'[2], digits=3))
a<-table.element(a, ' ')
a<-table.row.end(a)
a<-table.end(a)
table.save(a,file='mytable1.tab')
bitmap(file='regressionplot.png')
plot(Y~ X, data=xdf, xlab=V2, ylab=V1, main='Regression Solution')
if(intercept == TRUE) abline(coef(lmxdf), col='red')
if(intercept == FALSE) abline(0.0, coef(lmxdf), col='red')
dev.off()
library(car)
bitmap(file='residualsQQplot.png')
qqPlot(resid(lmxdf), main='QQplot of Residuals of Fit')
dev.off()
bitmap(file='residualsplot.png')
plot(xdf$X, resid(lmxdf), main='Scatterplot of Residuals of Model Fit')
dev.off()
bitmap(file='cooksDistanceLmplot.png')
plot(lmxdf, which=4)
dev.off()