Free Statistics

of Irreproducible Research!

Author's title

Author*Unverified author*
R Software ModulePatrick.Wessarwasp_demand_forecasting_croston.wasp
Title produced by softwareCroston Forecasting
Date of computationThu, 13 May 2010 12:18:19 +0000
Cite this page as followsStatistical Computations at FreeStatistics.org, Office for Research Development and Education, URL https://freestatistics.org/blog/index.php?v=date/2010/May/13/t1273753140bhn7ary7lzfd4l0.htm/, Retrieved Mon, 06 May 2024 07:30:33 +0000
Statistical Computations at FreeStatistics.org, Office for Research Development and Education, URL https://freestatistics.org/blog/index.php?pk=75896, Retrieved Mon, 06 May 2024 07:30:33 +0000
QR Codes:

Original text written by user:
IsPrivate?No (this computation is public)
User-defined keywordsFM50,steven,coomans,thesis,ETS
Estimated Impact160
Family? (F = Feedback message, R = changed R code, M = changed R Module, P = changed Parameters, D = changed Data)
-       [Croston Forecasting] [FM50,steven,cooma...] [2010-05-13 12:18:19] [d41d8cd98f00b204e9800998ecf8427e] [Current]
Feedback Forum

Post a new message
Dataseries X:
1216,67
1186,17
1217,475
1096,95
1685,6
1758,5
1786,6
2049,895
1845,895
2015,02
1609,63
918,725
1240,96
1671,785
2451,83
1886,14
2110,66
1856,87
1775,765
1569,625
1835,69
2041,46
1667,035
948,25
1365,66
1681,025
1661,9
2194,88
2051,025
2365,845
2398,5
2181,85
2626,77
2529,72
1700,3
605,38
1200,495
1597,02
1174,955
1612,88
1683,55
2260,955
2455,335
2365,62
2417,755
2308,785
1629,94
1053,275
1330,235
1543,85


Summary of computational transaction
Raw Inputview raw input (R code)
Raw Outputview raw output of R engine
Computing time11 seconds
R Serverwessa.org @ wessa.org

\begin{tabular}{lllllllll}
\hline
Summary of computational transaction \tabularnewline
Raw Input & view raw input (R code)  \tabularnewline
Raw Output & view raw output of R engine  \tabularnewline
Computing time & 11 seconds \tabularnewline
R Server & wessa.org @ wessa.org \tabularnewline
\hline
\end{tabular}
%Source: https://freestatistics.org/blog/index.php?pk=75896&T=0

[TABLE]
[ROW][C]Summary of computational transaction[/C][/ROW]
[ROW][C]Raw Input[/C][C]view raw input (R code) [/C][/ROW]
[ROW][C]Raw Output[/C][C]view raw output of R engine [/C][/ROW]
[ROW][C]Computing time[/C][C]11 seconds[/C][/ROW]
[ROW][C]R Server[/C][C]wessa.org @ wessa.org[/C][/ROW]
[/TABLE]
Source: https://freestatistics.org/blog/index.php?pk=75896&T=0

Globally Unique Identifier (entire table): ba.freestatistics.org/blog/index.php?pk=75896&T=0

As an alternative you can also use a QR Code:  

The GUIDs for individual cells are displayed in the table below:

Summary of computational transaction
Raw Inputview raw input (R code)
Raw Outputview raw output of R engine
Computing time11 seconds
R Serverwessa.org @ wessa.org


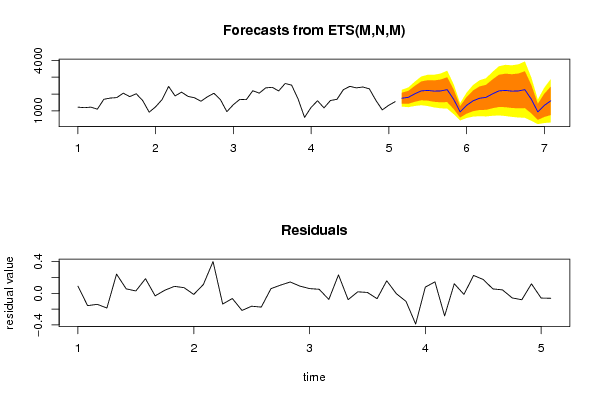
Demand Forecast
PointForecast95% LB80% LB80% UB95% UB
511749.221558314411251.457834864641423.751353713662074.691762915162246.98528176417
521801.443837042421219.646045560191421.026708775942181.860965308902383.24162852466
532009.918505692011291.470411859831540.150547364332479.686464019692728.36659952419
542186.633017685391335.872310369301630.350491595702742.915543775083037.39372500148
552213.617010651101287.263589203561607.907065535812819.326955766383139.97043209863
562172.710867649391203.444652011291538.941754605202806.479980693583141.97708328750
572183.437208840761152.254316921741509.182957270042857.691460411483214.62010075977
582259.218703394071135.914441041451524.729525349942993.70788143823382.52296574669
591688.49893365773808.6403354043421113.190319344532263.807547970922568.35753191111
60935.568157727725426.567815813190602.7507232296171268.385592225831444.56849964226
611323.77986581384574.231971210276833.6768407803061813.882890847372073.3277604174
621593.38738693285657.001167384723981.1173477474622205.657426118252529.77360648099
631749.22467663797684.8221813579031053.249293949572445.200059326372813.62717191803
641801.44704846223668.7957253149281060.846155871732542.047941052722934.09837160953
652009.92208875797706.539957968281157.686321472502862.157856043453313.30421954766
662186.63691577893726.5492102108791231.936880644223141.336950913643646.72462134698
672213.62095684879693.8373253228641219.887853774363207.354059923223733.40458837472
682172.71474092403640.9666192550741171.158478243263174.271003604803704.46286259298
692183.44110123715604.6796592750131151.144480724083215.737721750223762.20254319929
702259.22273088554585.607430758261164.904506206103353.540955564993932.83803101283
711688.50194373154408.261046800651851.3974159557262525.606471507352968.74284066243
72935.569825557746210.186488806952461.2671556282781409.872495487211660.95316230854
731323.78222570583275.089464321736638.0788858852952009.485565526362372.47498708992
741593.39022745206304.662570097208750.7365053065932436.043949597532882.11788480691

\begin{tabular}{lllllllll}
\hline
Demand Forecast \tabularnewline
Point & Forecast & 95% LB & 80% LB & 80% UB & 95% UB \tabularnewline
51 & 1749.22155831441 & 1251.45783486464 & 1423.75135371366 & 2074.69176291516 & 2246.98528176417 \tabularnewline
52 & 1801.44383704242 & 1219.64604556019 & 1421.02670877594 & 2181.86096530890 & 2383.24162852466 \tabularnewline
53 & 2009.91850569201 & 1291.47041185983 & 1540.15054736433 & 2479.68646401969 & 2728.36659952419 \tabularnewline
54 & 2186.63301768539 & 1335.87231036930 & 1630.35049159570 & 2742.91554377508 & 3037.39372500148 \tabularnewline
55 & 2213.61701065110 & 1287.26358920356 & 1607.90706553581 & 2819.32695576638 & 3139.97043209863 \tabularnewline
56 & 2172.71086764939 & 1203.44465201129 & 1538.94175460520 & 2806.47998069358 & 3141.97708328750 \tabularnewline
57 & 2183.43720884076 & 1152.25431692174 & 1509.18295727004 & 2857.69146041148 & 3214.62010075977 \tabularnewline
58 & 2259.21870339407 & 1135.91444104145 & 1524.72952534994 & 2993.7078814382 & 3382.52296574669 \tabularnewline
59 & 1688.49893365773 & 808.640335404342 & 1113.19031934453 & 2263.80754797092 & 2568.35753191111 \tabularnewline
60 & 935.568157727725 & 426.567815813190 & 602.750723229617 & 1268.38559222583 & 1444.56849964226 \tabularnewline
61 & 1323.77986581384 & 574.231971210276 & 833.676840780306 & 1813.88289084737 & 2073.3277604174 \tabularnewline
62 & 1593.38738693285 & 657.001167384723 & 981.117347747462 & 2205.65742611825 & 2529.77360648099 \tabularnewline
63 & 1749.22467663797 & 684.822181357903 & 1053.24929394957 & 2445.20005932637 & 2813.62717191803 \tabularnewline
64 & 1801.44704846223 & 668.795725314928 & 1060.84615587173 & 2542.04794105272 & 2934.09837160953 \tabularnewline
65 & 2009.92208875797 & 706.53995796828 & 1157.68632147250 & 2862.15785604345 & 3313.30421954766 \tabularnewline
66 & 2186.63691577893 & 726.549210210879 & 1231.93688064422 & 3141.33695091364 & 3646.72462134698 \tabularnewline
67 & 2213.62095684879 & 693.837325322864 & 1219.88785377436 & 3207.35405992322 & 3733.40458837472 \tabularnewline
68 & 2172.71474092403 & 640.966619255074 & 1171.15847824326 & 3174.27100360480 & 3704.46286259298 \tabularnewline
69 & 2183.44110123715 & 604.679659275013 & 1151.14448072408 & 3215.73772175022 & 3762.20254319929 \tabularnewline
70 & 2259.22273088554 & 585.60743075826 & 1164.90450620610 & 3353.54095556499 & 3932.83803101283 \tabularnewline
71 & 1688.50194373154 & 408.261046800651 & 851.397415955726 & 2525.60647150735 & 2968.74284066243 \tabularnewline
72 & 935.569825557746 & 210.186488806952 & 461.267155628278 & 1409.87249548721 & 1660.95316230854 \tabularnewline
73 & 1323.78222570583 & 275.089464321736 & 638.078885885295 & 2009.48556552636 & 2372.47498708992 \tabularnewline
74 & 1593.39022745206 & 304.662570097208 & 750.736505306593 & 2436.04394959753 & 2882.11788480691 \tabularnewline
\hline
\end{tabular}
%Source: https://freestatistics.org/blog/index.php?pk=75896&T=1

[TABLE]
[ROW][C]Demand Forecast[/C][/ROW]
[ROW][C]Point[/C][C]Forecast[/C][C]95% LB[/C][C]80% LB[/C][C]80% UB[/C][C]95% UB[/C][/ROW]
[ROW][C]51[/C][C]1749.22155831441[/C][C]1251.45783486464[/C][C]1423.75135371366[/C][C]2074.69176291516[/C][C]2246.98528176417[/C][/ROW]
[ROW][C]52[/C][C]1801.44383704242[/C][C]1219.64604556019[/C][C]1421.02670877594[/C][C]2181.86096530890[/C][C]2383.24162852466[/C][/ROW]
[ROW][C]53[/C][C]2009.91850569201[/C][C]1291.47041185983[/C][C]1540.15054736433[/C][C]2479.68646401969[/C][C]2728.36659952419[/C][/ROW]
[ROW][C]54[/C][C]2186.63301768539[/C][C]1335.87231036930[/C][C]1630.35049159570[/C][C]2742.91554377508[/C][C]3037.39372500148[/C][/ROW]
[ROW][C]55[/C][C]2213.61701065110[/C][C]1287.26358920356[/C][C]1607.90706553581[/C][C]2819.32695576638[/C][C]3139.97043209863[/C][/ROW]
[ROW][C]56[/C][C]2172.71086764939[/C][C]1203.44465201129[/C][C]1538.94175460520[/C][C]2806.47998069358[/C][C]3141.97708328750[/C][/ROW]
[ROW][C]57[/C][C]2183.43720884076[/C][C]1152.25431692174[/C][C]1509.18295727004[/C][C]2857.69146041148[/C][C]3214.62010075977[/C][/ROW]
[ROW][C]58[/C][C]2259.21870339407[/C][C]1135.91444104145[/C][C]1524.72952534994[/C][C]2993.7078814382[/C][C]3382.52296574669[/C][/ROW]
[ROW][C]59[/C][C]1688.49893365773[/C][C]808.640335404342[/C][C]1113.19031934453[/C][C]2263.80754797092[/C][C]2568.35753191111[/C][/ROW]
[ROW][C]60[/C][C]935.568157727725[/C][C]426.567815813190[/C][C]602.750723229617[/C][C]1268.38559222583[/C][C]1444.56849964226[/C][/ROW]
[ROW][C]61[/C][C]1323.77986581384[/C][C]574.231971210276[/C][C]833.676840780306[/C][C]1813.88289084737[/C][C]2073.3277604174[/C][/ROW]
[ROW][C]62[/C][C]1593.38738693285[/C][C]657.001167384723[/C][C]981.117347747462[/C][C]2205.65742611825[/C][C]2529.77360648099[/C][/ROW]
[ROW][C]63[/C][C]1749.22467663797[/C][C]684.822181357903[/C][C]1053.24929394957[/C][C]2445.20005932637[/C][C]2813.62717191803[/C][/ROW]
[ROW][C]64[/C][C]1801.44704846223[/C][C]668.795725314928[/C][C]1060.84615587173[/C][C]2542.04794105272[/C][C]2934.09837160953[/C][/ROW]
[ROW][C]65[/C][C]2009.92208875797[/C][C]706.53995796828[/C][C]1157.68632147250[/C][C]2862.15785604345[/C][C]3313.30421954766[/C][/ROW]
[ROW][C]66[/C][C]2186.63691577893[/C][C]726.549210210879[/C][C]1231.93688064422[/C][C]3141.33695091364[/C][C]3646.72462134698[/C][/ROW]
[ROW][C]67[/C][C]2213.62095684879[/C][C]693.837325322864[/C][C]1219.88785377436[/C][C]3207.35405992322[/C][C]3733.40458837472[/C][/ROW]
[ROW][C]68[/C][C]2172.71474092403[/C][C]640.966619255074[/C][C]1171.15847824326[/C][C]3174.27100360480[/C][C]3704.46286259298[/C][/ROW]
[ROW][C]69[/C][C]2183.44110123715[/C][C]604.679659275013[/C][C]1151.14448072408[/C][C]3215.73772175022[/C][C]3762.20254319929[/C][/ROW]
[ROW][C]70[/C][C]2259.22273088554[/C][C]585.60743075826[/C][C]1164.90450620610[/C][C]3353.54095556499[/C][C]3932.83803101283[/C][/ROW]
[ROW][C]71[/C][C]1688.50194373154[/C][C]408.261046800651[/C][C]851.397415955726[/C][C]2525.60647150735[/C][C]2968.74284066243[/C][/ROW]
[ROW][C]72[/C][C]935.569825557746[/C][C]210.186488806952[/C][C]461.267155628278[/C][C]1409.87249548721[/C][C]1660.95316230854[/C][/ROW]
[ROW][C]73[/C][C]1323.78222570583[/C][C]275.089464321736[/C][C]638.078885885295[/C][C]2009.48556552636[/C][C]2372.47498708992[/C][/ROW]
[ROW][C]74[/C][C]1593.39022745206[/C][C]304.662570097208[/C][C]750.736505306593[/C][C]2436.04394959753[/C][C]2882.11788480691[/C][/ROW]
[/TABLE]
Source: https://freestatistics.org/blog/index.php?pk=75896&T=1

Globally Unique Identifier (entire table): ba.freestatistics.org/blog/index.php?pk=75896&T=1

As an alternative you can also use a QR Code:  

The GUIDs for individual cells are displayed in the table below:

Demand Forecast
PointForecast95% LB80% LB80% UB95% UB
511749.221558314411251.457834864641423.751353713662074.691762915162246.98528176417
521801.443837042421219.646045560191421.026708775942181.860965308902383.24162852466
532009.918505692011291.470411859831540.150547364332479.686464019692728.36659952419
542186.633017685391335.872310369301630.350491595702742.915543775083037.39372500148
552213.617010651101287.263589203561607.907065535812819.326955766383139.97043209863
562172.710867649391203.444652011291538.941754605202806.479980693583141.97708328750
572183.437208840761152.254316921741509.182957270042857.691460411483214.62010075977
582259.218703394071135.914441041451524.729525349942993.70788143823382.52296574669
591688.49893365773808.6403354043421113.190319344532263.807547970922568.35753191111
60935.568157727725426.567815813190602.7507232296171268.385592225831444.56849964226
611323.77986581384574.231971210276833.6768407803061813.882890847372073.3277604174
621593.38738693285657.001167384723981.1173477474622205.657426118252529.77360648099
631749.22467663797684.8221813579031053.249293949572445.200059326372813.62717191803
641801.44704846223668.7957253149281060.846155871732542.047941052722934.09837160953
652009.92208875797706.539957968281157.686321472502862.157856043453313.30421954766
662186.63691577893726.5492102108791231.936880644223141.336950913643646.72462134698
672213.62095684879693.8373253228641219.887853774363207.354059923223733.40458837472
682172.71474092403640.9666192550741171.158478243263174.271003604803704.46286259298
692183.44110123715604.6796592750131151.144480724083215.737721750223762.20254319929
702259.22273088554585.607430758261164.904506206103353.540955564993932.83803101283
711688.50194373154408.261046800651851.3974159557262525.606471507352968.74284066243
72935.569825557746210.186488806952461.2671556282781409.872495487211660.95316230854
731323.78222570583275.089464321736638.0788858852952009.485565526362372.47498708992
741593.39022745206304.662570097208750.7365053065932436.043949597532882.11788480691


Actuals and Interpolation
TimeActualForecast
11216.671216.57896906222
21186.171186.32706637457
31217.4751217.61518741362
41096.951097.13722496335
51685.61685.35698835458
61758.51758.44429928912
71786.61786.57095582242
82049.8952049.71036034501
91845.8951845.92826649821
102015.022014.98176910371
111609.631609.54241047328
12918.725918.654492873966
131240.961240.97493327842
141671.7851671.67364264948
152451.832451.42825634976
161886.141886.27704742758
172110.662110.72659138529
181856.871857.08748894488
191775.7651775.92924079464
201569.6251569.80044248696
211835.691835.63172097274
222041.462041.35676313207
231667.0351666.89228111939
24948.25948.159567965853
251365.661365.60094114980
261681.0251680.97488911353
271661.91661.97891553469
282194.882194.64696222739
292051.0252051.10610598749
302365.8452365.8268033643
312398.52398.49010356152
322181.852181.91895239553
332626.772626.61215634528
342529.722529.72574330652
351700.31700.40313375847
36605.38605.770298247161
371200.4951200.41697572286
381597.021596.87595983126
391174.9551175.24282736234
401612.881612.75933399255
411683.551683.56473508225
422260.9552260.72911247337
432455.3352455.16084014401
442365.622365.56505712385
452417.7552417.71252994142
462308.7852308.84414672757
471629.941630.02245147924
481053.2751053.15585122134
491330.2351330.29555655607
501543.851543.91407603040

\begin{tabular}{lllllllll}
\hline
Actuals and Interpolation \tabularnewline
Time & Actual & Forecast \tabularnewline
1 & 1216.67 & 1216.57896906222 \tabularnewline
2 & 1186.17 & 1186.32706637457 \tabularnewline
3 & 1217.475 & 1217.61518741362 \tabularnewline
4 & 1096.95 & 1097.13722496335 \tabularnewline
5 & 1685.6 & 1685.35698835458 \tabularnewline
6 & 1758.5 & 1758.44429928912 \tabularnewline
7 & 1786.6 & 1786.57095582242 \tabularnewline
8 & 2049.895 & 2049.71036034501 \tabularnewline
9 & 1845.895 & 1845.92826649821 \tabularnewline
10 & 2015.02 & 2014.98176910371 \tabularnewline
11 & 1609.63 & 1609.54241047328 \tabularnewline
12 & 918.725 & 918.654492873966 \tabularnewline
13 & 1240.96 & 1240.97493327842 \tabularnewline
14 & 1671.785 & 1671.67364264948 \tabularnewline
15 & 2451.83 & 2451.42825634976 \tabularnewline
16 & 1886.14 & 1886.27704742758 \tabularnewline
17 & 2110.66 & 2110.72659138529 \tabularnewline
18 & 1856.87 & 1857.08748894488 \tabularnewline
19 & 1775.765 & 1775.92924079464 \tabularnewline
20 & 1569.625 & 1569.80044248696 \tabularnewline
21 & 1835.69 & 1835.63172097274 \tabularnewline
22 & 2041.46 & 2041.35676313207 \tabularnewline
23 & 1667.035 & 1666.89228111939 \tabularnewline
24 & 948.25 & 948.159567965853 \tabularnewline
25 & 1365.66 & 1365.60094114980 \tabularnewline
26 & 1681.025 & 1680.97488911353 \tabularnewline
27 & 1661.9 & 1661.97891553469 \tabularnewline
28 & 2194.88 & 2194.64696222739 \tabularnewline
29 & 2051.025 & 2051.10610598749 \tabularnewline
30 & 2365.845 & 2365.8268033643 \tabularnewline
31 & 2398.5 & 2398.49010356152 \tabularnewline
32 & 2181.85 & 2181.91895239553 \tabularnewline
33 & 2626.77 & 2626.61215634528 \tabularnewline
34 & 2529.72 & 2529.72574330652 \tabularnewline
35 & 1700.3 & 1700.40313375847 \tabularnewline
36 & 605.38 & 605.770298247161 \tabularnewline
37 & 1200.495 & 1200.41697572286 \tabularnewline
38 & 1597.02 & 1596.87595983126 \tabularnewline
39 & 1174.955 & 1175.24282736234 \tabularnewline
40 & 1612.88 & 1612.75933399255 \tabularnewline
41 & 1683.55 & 1683.56473508225 \tabularnewline
42 & 2260.955 & 2260.72911247337 \tabularnewline
43 & 2455.335 & 2455.16084014401 \tabularnewline
44 & 2365.62 & 2365.56505712385 \tabularnewline
45 & 2417.755 & 2417.71252994142 \tabularnewline
46 & 2308.785 & 2308.84414672757 \tabularnewline
47 & 1629.94 & 1630.02245147924 \tabularnewline
48 & 1053.275 & 1053.15585122134 \tabularnewline
49 & 1330.235 & 1330.29555655607 \tabularnewline
50 & 1543.85 & 1543.91407603040 \tabularnewline
\hline
\end{tabular}
%Source: https://freestatistics.org/blog/index.php?pk=75896&T=2

[TABLE]
[ROW][C]Actuals and Interpolation[/C][/ROW]
[ROW][C]Time[/C][C]Actual[/C][C]Forecast[/C][/ROW]
[ROW][C]1[/C][C]1216.67[/C][C]1216.57896906222[/C][/ROW]
[ROW][C]2[/C][C]1186.17[/C][C]1186.32706637457[/C][/ROW]
[ROW][C]3[/C][C]1217.475[/C][C]1217.61518741362[/C][/ROW]
[ROW][C]4[/C][C]1096.95[/C][C]1097.13722496335[/C][/ROW]
[ROW][C]5[/C][C]1685.6[/C][C]1685.35698835458[/C][/ROW]
[ROW][C]6[/C][C]1758.5[/C][C]1758.44429928912[/C][/ROW]
[ROW][C]7[/C][C]1786.6[/C][C]1786.57095582242[/C][/ROW]
[ROW][C]8[/C][C]2049.895[/C][C]2049.71036034501[/C][/ROW]
[ROW][C]9[/C][C]1845.895[/C][C]1845.92826649821[/C][/ROW]
[ROW][C]10[/C][C]2015.02[/C][C]2014.98176910371[/C][/ROW]
[ROW][C]11[/C][C]1609.63[/C][C]1609.54241047328[/C][/ROW]
[ROW][C]12[/C][C]918.725[/C][C]918.654492873966[/C][/ROW]
[ROW][C]13[/C][C]1240.96[/C][C]1240.97493327842[/C][/ROW]
[ROW][C]14[/C][C]1671.785[/C][C]1671.67364264948[/C][/ROW]
[ROW][C]15[/C][C]2451.83[/C][C]2451.42825634976[/C][/ROW]
[ROW][C]16[/C][C]1886.14[/C][C]1886.27704742758[/C][/ROW]
[ROW][C]17[/C][C]2110.66[/C][C]2110.72659138529[/C][/ROW]
[ROW][C]18[/C][C]1856.87[/C][C]1857.08748894488[/C][/ROW]
[ROW][C]19[/C][C]1775.765[/C][C]1775.92924079464[/C][/ROW]
[ROW][C]20[/C][C]1569.625[/C][C]1569.80044248696[/C][/ROW]
[ROW][C]21[/C][C]1835.69[/C][C]1835.63172097274[/C][/ROW]
[ROW][C]22[/C][C]2041.46[/C][C]2041.35676313207[/C][/ROW]
[ROW][C]23[/C][C]1667.035[/C][C]1666.89228111939[/C][/ROW]
[ROW][C]24[/C][C]948.25[/C][C]948.159567965853[/C][/ROW]
[ROW][C]25[/C][C]1365.66[/C][C]1365.60094114980[/C][/ROW]
[ROW][C]26[/C][C]1681.025[/C][C]1680.97488911353[/C][/ROW]
[ROW][C]27[/C][C]1661.9[/C][C]1661.97891553469[/C][/ROW]
[ROW][C]28[/C][C]2194.88[/C][C]2194.64696222739[/C][/ROW]
[ROW][C]29[/C][C]2051.025[/C][C]2051.10610598749[/C][/ROW]
[ROW][C]30[/C][C]2365.845[/C][C]2365.8268033643[/C][/ROW]
[ROW][C]31[/C][C]2398.5[/C][C]2398.49010356152[/C][/ROW]
[ROW][C]32[/C][C]2181.85[/C][C]2181.91895239553[/C][/ROW]
[ROW][C]33[/C][C]2626.77[/C][C]2626.61215634528[/C][/ROW]
[ROW][C]34[/C][C]2529.72[/C][C]2529.72574330652[/C][/ROW]
[ROW][C]35[/C][C]1700.3[/C][C]1700.40313375847[/C][/ROW]
[ROW][C]36[/C][C]605.38[/C][C]605.770298247161[/C][/ROW]
[ROW][C]37[/C][C]1200.495[/C][C]1200.41697572286[/C][/ROW]
[ROW][C]38[/C][C]1597.02[/C][C]1596.87595983126[/C][/ROW]
[ROW][C]39[/C][C]1174.955[/C][C]1175.24282736234[/C][/ROW]
[ROW][C]40[/C][C]1612.88[/C][C]1612.75933399255[/C][/ROW]
[ROW][C]41[/C][C]1683.55[/C][C]1683.56473508225[/C][/ROW]
[ROW][C]42[/C][C]2260.955[/C][C]2260.72911247337[/C][/ROW]
[ROW][C]43[/C][C]2455.335[/C][C]2455.16084014401[/C][/ROW]
[ROW][C]44[/C][C]2365.62[/C][C]2365.56505712385[/C][/ROW]
[ROW][C]45[/C][C]2417.755[/C][C]2417.71252994142[/C][/ROW]
[ROW][C]46[/C][C]2308.785[/C][C]2308.84414672757[/C][/ROW]
[ROW][C]47[/C][C]1629.94[/C][C]1630.02245147924[/C][/ROW]
[ROW][C]48[/C][C]1053.275[/C][C]1053.15585122134[/C][/ROW]
[ROW][C]49[/C][C]1330.235[/C][C]1330.29555655607[/C][/ROW]
[ROW][C]50[/C][C]1543.85[/C][C]1543.91407603040[/C][/ROW]
[/TABLE]
Source: https://freestatistics.org/blog/index.php?pk=75896&T=2

Globally Unique Identifier (entire table): ba.freestatistics.org/blog/index.php?pk=75896&T=2

As an alternative you can also use a QR Code:  

The GUIDs for individual cells are displayed in the table below:

Actuals and Interpolation
TimeActualForecast
11216.671216.57896906222
21186.171186.32706637457
31217.4751217.61518741362
41096.951097.13722496335
51685.61685.35698835458
61758.51758.44429928912
71786.61786.57095582242
82049.8952049.71036034501
91845.8951845.92826649821
102015.022014.98176910371
111609.631609.54241047328
12918.725918.654492873966
131240.961240.97493327842
141671.7851671.67364264948
152451.832451.42825634976
161886.141886.27704742758
172110.662110.72659138529
181856.871857.08748894488
191775.7651775.92924079464
201569.6251569.80044248696
211835.691835.63172097274
222041.462041.35676313207
231667.0351666.89228111939
24948.25948.159567965853
251365.661365.60094114980
261681.0251680.97488911353
271661.91661.97891553469
282194.882194.64696222739
292051.0252051.10610598749
302365.8452365.8268033643
312398.52398.49010356152
322181.852181.91895239553
332626.772626.61215634528
342529.722529.72574330652
351700.31700.40313375847
36605.38605.770298247161
371200.4951200.41697572286
381597.021596.87595983126
391174.9551175.24282736234
401612.881612.75933399255
411683.551683.56473508225
422260.9552260.72911247337
432455.3352455.16084014401
442365.622365.56505712385
452417.7552417.71252994142
462308.7852308.84414672757
471629.941630.02245147924
481053.2751053.15585122134
491330.2351330.29555655607
501543.851543.91407603040


\begin{tabular}{lllllllll}
\hline
What is next? \tabularnewline
Simulate Time Series \tabularnewline
Generate Forecasts \tabularnewline
Forecast Analysis \tabularnewline
\hline
\end{tabular}
%Source: https://freestatistics.org/blog/index.php?pk=75896&T=3

[TABLE]
[ROW][C]What is next?[/C][/ROW]
[ROW][C]Simulate Time Series[/C][/ROW]
[ROW][C]Generate Forecasts[/C][/ROW]
[ROW][C]Forecast Analysis[/C][/ROW]
[/TABLE]
Source: https://freestatistics.org/blog/index.php?pk=75896&T=3

Globally Unique Identifier (entire table): ba.freestatistics.org/blog/index.php?pk=75896&T=3

As an alternative you can also use a QR Code:  

The GUIDs for individual cells are displayed in the table below:

What is next?
Simulate Time Series
Generate Forecasts
Forecast Analysis


Parameters (Session):
par1 = Input box ; par2 = ARIMA ; par3 = NA ; par4 = NA ; par5 = ZZZ ; par6 = 12 ; par7 = dum ; par8 = dumresult ; par9 = 3 ; par10 = 0.1 ;
Parameters (R input):
par1 = Input box ; par2 = ETS ; par3 = NA ; par4 = NA ; par5 = ZZZ ; par6 = 12 ; par7 = dum ; par8 = dumresult ; par9 = 3 ; par10 = 0.1 ;
R code (references can be found in the software module):
if(par3!='NA') par3 <- as.numeric(par3) else par3 <- NA
if(par4!='NA') par4 <- as.numeric(par4) else par4 <- NA
par6 <- as.numeric(par6) #Seasonal Period
par9 <- as.numeric(par9) #Forecast Horizon
par10 <- as.numeric(par10) #Alpha
library(forecast)
if (par1 == 'CSV') {
xarr <- read.csv(file=paste('tmp/',par7,'.csv',sep=''),header=T)
numseries <- length(xarr[1,])-1
n <- length(xarr[,1])
nmh <- n - par9
nmhp1 <- nmh + 1
rarr <- array(NA,dim=c(n,numseries))
farr <- array(NA,dim=c(n,numseries))
parr <- array(NA,dim=c(numseries,8))
colnames(parr) = list('ME','RMSE','MAE','MPE','MAPE','MASE','ACF1','TheilU')
for(i in 1:numseries) {
sindex <- i+1
x <- xarr[,sindex]
if(par2=='Croston') {
if (i==1) m <- croston(x,alpha=par10)
if (i==1) mydemand <- m$model$demand[]
fit <- croston(x[1:nmh],h=par9,alpha=par10)
}
if(par2=='ARIMA') {
m <- auto.arima(ts(x,freq=par6),d=par3,D=par4)
mydemand <- forecast(m)
fit <- auto.arima(ts(x[1:nmh],freq=par6),d=par3,D=par4)
}
if(par2=='ETS') {
m <- ets(ts(x,freq=par6),model=par5)
mydemand <- forecast(m)
fit <- ets(ts(x[1:nmh],freq=par6),model=par5)
}
try(rarr[,i] <- mydemand$resid,silent=T)
try(farr[,i] <- mydemand$mean,silent=T)
if (par2!='Croston') parr[i,] <- accuracy(forecast(fit,par9),x[nmhp1:n])
if (par2=='Croston') parr[i,] <- accuracy(fit,x[nmhp1:n])
}
write.csv(farr,file=paste('tmp/',par8,'_f.csv',sep=''))
write.csv(rarr,file=paste('tmp/',par8,'_r.csv',sep=''))
write.csv(parr,file=paste('tmp/',par8,'_p.csv',sep=''))
}
if (par1 == 'Input box') {
numseries <- 1
n <- length(x)
if(par2=='Croston') {
m <- croston(x)
mydemand <- m$model$demand[]
}
if(par2=='ARIMA') {
m <- auto.arima(ts(x,freq=par6),d=par3,D=par4)
mydemand <- forecast(m)
}
if(par2=='ETS') {
m <- ets(ts(x,freq=par6),model=par5)
mydemand <- forecast(m)
}
summary(m)
}
bitmap(file='test1.png')
op <- par(mfrow=c(2,1))
if (par2=='Croston') plot(m)
if ((par2=='ARIMA') | par2=='ETS') plot(forecast(m))
plot(mydemand$resid,type='l',main='Residuals', ylab='residual value', xlab='time')
par(op)
dev.off()
bitmap(file='pic2.png')
op <- par(mfrow=c(2,2))
acf(mydemand$resid, lag.max=n/3, main='Residual ACF', ylab='autocorrelation', xlab='time lag')
pacf(mydemand$resid,lag.max=n/3, main='Residual PACF', ylab='partial autocorrelation', xlab='time lag')
cpgram(mydemand$resid, main='Cumulative Periodogram of Residuals')
qqnorm(mydemand$resid); qqline(mydemand$resid, col=2)
par(op)
dev.off()
load(file='createtable')
a<-table.start()
a<-table.row.start(a)
a<-table.element(a,'Demand Forecast',6,TRUE)
a<-table.row.end(a)
a<-table.row.start(a)
a<-table.element(a,'Point',header=TRUE)
a<-table.element(a,'Forecast',header=TRUE)
a<-table.element(a,'95% LB',header=TRUE)
a<-table.element(a,'80% LB',header=TRUE)
a<-table.element(a,'80% UB',header=TRUE)
a<-table.element(a,'95% UB',header=TRUE)
a<-table.row.end(a)
for (i in 1:length(mydemand$mean)) {
a<-table.row.start(a)
a<-table.element(a,i+n,header=TRUE)
a<-table.element(a,as.numeric(mydemand$mean[i]))
a<-table.element(a,as.numeric(mydemand$lower[i,2]))
a<-table.element(a,as.numeric(mydemand$lower[i,1]))
a<-table.element(a,as.numeric(mydemand$upper[i,1]))
a<-table.element(a,as.numeric(mydemand$upper[i,2]))
a<-table.row.end(a)
}
a<-table.end(a)
table.save(a,file='mytable.tab')
a<-table.start()
a<-table.row.start(a)
a<-table.element(a,'Actuals and Interpolation',3,TRUE)
a<-table.row.end(a)
a<-table.row.start(a)
a<-table.element(a,'Time',header=TRUE)
a<-table.element(a,'Actual',header=TRUE)
a<-table.element(a,'Forecast',header=TRUE)
a<-table.row.end(a)
for (i in 1:n) {
a<-table.row.start(a)
a<-table.element(a,i,header=TRUE)
a<-table.element(a,x[i])
a<-table.element(a,x[i] - as.numeric(m$resid[i]))
a<-table.row.end(a)
}
a<-table.end(a)
table.save(a,file='mytable1.tab')
a<-table.start()
a<-table.row.start(a)
a<-table.element(a,'What is next?',1,TRUE)
a<-table.row.end(a)
a<-table.row.start(a)
a<-table.element(a,hyperlink(paste('https://automated.biganalytics.eu/Patrick.Wessa/rwasp_demand_forecasting_simulate.wasp',sep=''),'Simulate Time Series','',target=''))
a<-table.row.end(a)
a<-table.row.start(a)
a<-table.element(a,hyperlink(paste('https://automated.biganalytics.eu/Patrick.Wessa/rwasp_demand_forecasting_croston.wasp',sep=''),'Generate Forecasts','',target=''))
a<-table.row.end(a)
a<-table.row.start(a)
a<-table.element(a,hyperlink(paste('https://automated.biganalytics.eu/Patrick.Wessa/rwasp_demand_forecasting_analysis.wasp',sep=''),'Forecast Analysis','',target=''))
a<-table.row.end(a)
a<-table.end(a)
table.save(a,file='mytable0.tab')
-SERVER-wessa.org