Free Statistics

of Irreproducible Research!

Author's title

Author*The author of this computation has been verified*
R Software Modulerwasp_arimabackwardselection.wasp
Title produced by softwareARIMA Backward Selection
Date of computationSat, 17 Dec 2016 14:34:53 +0100
Cite this page as followsStatistical Computations at FreeStatistics.org, Office for Research Development and Education, URL https://freestatistics.org/blog/index.php?v=date/2016/Dec/17/t14819817414d5pl42y79s04pp.htm/, Retrieved Thu, 02 May 2024 00:19:15 +0000
Statistical Computations at FreeStatistics.org, Office for Research Development and Education, URL https://freestatistics.org/blog/index.php?pk=300783, Retrieved Thu, 02 May 2024 00:19:15 +0000
QR Codes:

Original text written by user:
IsPrivate?No (this computation is public)
User-defined keywords
Estimated Impact67
Family? (F = Feedback message, R = changed R code, M = changed R Module, P = changed Parameters, D = changed Data)
-       [ARIMA Backward Selection] [N2568] [2016-12-17 13:34:53] [563c2945bc7c763925d38f2fb19cdb55] [Current]
Feedback Forum

Post a new message
Dataseries X:
5750.5
3881.6
4350.4
6623.4
3375.5
6651.7
4394.8
4968.3
6355.6
4515.7
4620
5804.4
6254.4
4788.6
4446.4
8018
3745.9
6928.2
5201.7
5520.9
6801.9
5225.1
5149.4
6240.4
7045.4
5402.1
4960.6
9459.3
3979.4
7215.1
5797
5577.6
7380.8
5788.6
5116.3
6819.3
7671
5337
4955.7
9143.8
4624.6
7702.4
6297.4
5652.3
7801.3
5901.2
5296.7
7803.5
8177.1
5546.3
5651.5
12289.7
4769.1
8294.5
6422.3
6021.3
9241
6229.5
5691.5
8546.9
8174
6027.9
6566.4
10926.6
5963.5
9914
6063.1
6939
9774.2
6358.2
6432
9365.5
8930.6
6189.7
6820.5
12889.2
7102.5
10824.9
6619.1
7613.6
9923.3
6842.6
7121.3
8913
9952.4
6514.1
6480.5
13960.4
6918.6
11060.1
7232.9
7846.2
10293.9
7698.6
7050.7
10190
10071.3
6765.7
6480.5
14038
6356
10338.9
7859.3
7642.6
10935
7806.5
7309.5
10363.6
10403.1
6274.7
7212.7
13835.1
6218.4
12087.8
7905
7810.1


Summary of computational transaction
Raw Input view raw input (R code)
Raw Outputview raw output of R engine
Computing time9 seconds
R ServerBig Analytics Cloud Computing Center

\begin{tabular}{lllllllll}
\hline
Summary of computational transaction \tabularnewline
Raw Input view raw input (R code)  \tabularnewline
Raw Outputview raw output of R engine  \tabularnewline
Computing time9 seconds \tabularnewline
R ServerBig Analytics Cloud Computing Center \tabularnewline
\hline
\end{tabular}
%Source: https://freestatistics.org/blog/index.php?pk=300783&T=0

[TABLE]
[ROW]
Summary of computational transaction[/C][/ROW] [ROW]Raw Input[/C] view raw input (R code) [/C][/ROW] [ROW]Raw Output[/C]view raw output of R engine [/C][/ROW] [ROW]Computing time[/C]9 seconds[/C][/ROW] [ROW]R Server[/C]Big Analytics Cloud Computing Center[/C][/ROW] [/TABLE] Source: https://freestatistics.org/blog/index.php?pk=300783&T=0

Globally Unique Identifier (entire table): ba.freestatistics.org/blog/index.php?pk=300783&T=0

As an alternative you can also use a QR Code:  

The GUIDs for individual cells are displayed in the table below:

Summary of computational transaction
Raw Input view raw input (R code)
Raw Outputview raw output of R engine
Computing time9 seconds
R ServerBig Analytics Cloud Computing Center


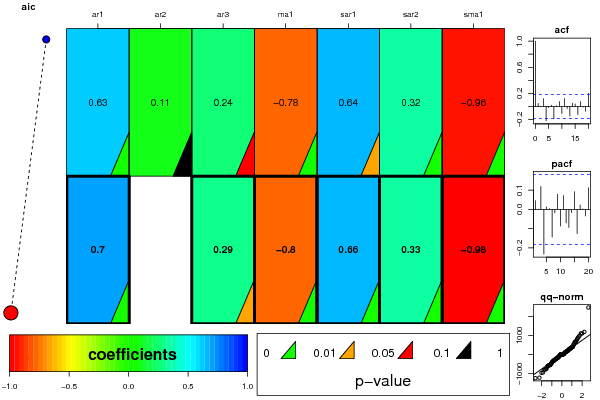
ARIMA Parameter Estimation and Backward Selection
Iterationar1ar2ar3ma1sar1sar2sma1
Estimates ( 1 )0.63480.1060.2436-0.78090.64390.3229-0.9557
(p-val)(0 )(0.3499 )(0.0573 )(0 )(0.0147 )(0.0096 )(8e-04 )
Estimates ( 2 )0.699800.2852-0.79560.66260.3289-0.9802
(p-val)(0 )(NA )(0.0109 )(0 )(0 )(0.0012 )(0 )
Estimates ( 3 )NANANANANANANA
(p-val)(NA )(NA )(NA )(NA )(NA )(NA )(NA )
Estimates ( 4 )NANANANANANANA
(p-val)(NA )(NA )(NA )(NA )(NA )(NA )(NA )
Estimates ( 5 )NANANANANANANA
(p-val)(NA )(NA )(NA )(NA )(NA )(NA )(NA )
Estimates ( 6 )NANANANANANANA
(p-val)(NA )(NA )(NA )(NA )(NA )(NA )(NA )
Estimates ( 7 )NANANANANANANA
(p-val)(NA )(NA )(NA )(NA )(NA )(NA )(NA )
Estimates ( 8 )NANANANANANANA
(p-val)(NA )(NA )(NA )(NA )(NA )(NA )(NA )
Estimates ( 9 )NANANANANANANA
(p-val)(NA )(NA )(NA )(NA )(NA )(NA )(NA )
Estimates ( 10 )NANANANANANANA
(p-val)(NA )(NA )(NA )(NA )(NA )(NA )(NA )
Estimates ( 11 )NANANANANANANA
(p-val)(NA )(NA )(NA )(NA )(NA )(NA )(NA )
Estimates ( 12 )NANANANANANANA
(p-val)(NA )(NA )(NA )(NA )(NA )(NA )(NA )
Estimates ( 13 )NANANANANANANA
(p-val)(NA )(NA )(NA )(NA )(NA )(NA )(NA )

\begin{tabular}{lllllllll}
\hline
ARIMA Parameter Estimation and Backward Selection \tabularnewline
Iteration & ar1 & ar2 & ar3 & ma1 & sar1 & sar2 & sma1 \tabularnewline
Estimates ( 1 ) & 0.6348 & 0.106 & 0.2436 & -0.7809 & 0.6439 & 0.3229 & -0.9557 \tabularnewline
(p-val) & (0 ) & (0.3499 ) & (0.0573 ) & (0 ) & (0.0147 ) & (0.0096 ) & (8e-04 ) \tabularnewline
Estimates ( 2 ) & 0.6998 & 0 & 0.2852 & -0.7956 & 0.6626 & 0.3289 & -0.9802 \tabularnewline
(p-val) & (0 ) & (NA ) & (0.0109 ) & (0 ) & (0 ) & (0.0012 ) & (0 ) \tabularnewline
Estimates ( 3 ) & NA & NA & NA & NA & NA & NA & NA \tabularnewline
(p-val) & (NA ) & (NA ) & (NA ) & (NA ) & (NA ) & (NA ) & (NA ) \tabularnewline
Estimates ( 4 ) & NA & NA & NA & NA & NA & NA & NA \tabularnewline
(p-val) & (NA ) & (NA ) & (NA ) & (NA ) & (NA ) & (NA ) & (NA ) \tabularnewline
Estimates ( 5 ) & NA & NA & NA & NA & NA & NA & NA \tabularnewline
(p-val) & (NA ) & (NA ) & (NA ) & (NA ) & (NA ) & (NA ) & (NA ) \tabularnewline
Estimates ( 6 ) & NA & NA & NA & NA & NA & NA & NA \tabularnewline
(p-val) & (NA ) & (NA ) & (NA ) & (NA ) & (NA ) & (NA ) & (NA ) \tabularnewline
Estimates ( 7 ) & NA & NA & NA & NA & NA & NA & NA \tabularnewline
(p-val) & (NA ) & (NA ) & (NA ) & (NA ) & (NA ) & (NA ) & (NA ) \tabularnewline
Estimates ( 8 ) & NA & NA & NA & NA & NA & NA & NA \tabularnewline
(p-val) & (NA ) & (NA ) & (NA ) & (NA ) & (NA ) & (NA ) & (NA ) \tabularnewline
Estimates ( 9 ) & NA & NA & NA & NA & NA & NA & NA \tabularnewline
(p-val) & (NA ) & (NA ) & (NA ) & (NA ) & (NA ) & (NA ) & (NA ) \tabularnewline
Estimates ( 10 ) & NA & NA & NA & NA & NA & NA & NA \tabularnewline
(p-val) & (NA ) & (NA ) & (NA ) & (NA ) & (NA ) & (NA ) & (NA ) \tabularnewline
Estimates ( 11 ) & NA & NA & NA & NA & NA & NA & NA \tabularnewline
(p-val) & (NA ) & (NA ) & (NA ) & (NA ) & (NA ) & (NA ) & (NA ) \tabularnewline
Estimates ( 12 ) & NA & NA & NA & NA & NA & NA & NA \tabularnewline
(p-val) & (NA ) & (NA ) & (NA ) & (NA ) & (NA ) & (NA ) & (NA ) \tabularnewline
Estimates ( 13 ) & NA & NA & NA & NA & NA & NA & NA \tabularnewline
(p-val) & (NA ) & (NA ) & (NA ) & (NA ) & (NA ) & (NA ) & (NA ) \tabularnewline
\hline
\end{tabular}
%Source: https://freestatistics.org/blog/index.php?pk=300783&T=1

[TABLE]
[ROW][C]ARIMA Parameter Estimation and Backward Selection[/C][/ROW]
[ROW][C]Iteration[/C][C]ar1[/C][C]ar2[/C][C]ar3[/C][C]ma1[/C][C]sar1[/C][C]sar2[/C][C]sma1[/C][/ROW]
[ROW][C]Estimates ( 1 )[/C][C]0.6348[/C][C]0.106[/C][C]0.2436[/C][C]-0.7809[/C][C]0.6439[/C][C]0.3229[/C][C]-0.9557[/C][/ROW]
[ROW][C](p-val)[/C][C](0 )[/C][C](0.3499 )[/C][C](0.0573 )[/C][C](0 )[/C][C](0.0147 )[/C][C](0.0096 )[/C][C](8e-04 )[/C][/ROW]
[ROW][C]Estimates ( 2 )[/C][C]0.6998[/C][C]0[/C][C]0.2852[/C][C]-0.7956[/C][C]0.6626[/C][C]0.3289[/C][C]-0.9802[/C][/ROW]
[ROW][C](p-val)[/C][C](0 )[/C][C](NA )[/C][C](0.0109 )[/C][C](0 )[/C][C](0 )[/C][C](0.0012 )[/C][C](0 )[/C][/ROW]
[ROW][C]Estimates ( 3 )[/C][C]NA[/C][C]NA[/C][C]NA[/C][C]NA[/C][C]NA[/C][C]NA[/C][C]NA[/C][/ROW]
[ROW][C](p-val)[/C][C](NA )[/C][C](NA )[/C][C](NA )[/C][C](NA )[/C][C](NA )[/C][C](NA )[/C][C](NA )[/C][/ROW]
[ROW][C]Estimates ( 4 )[/C][C]NA[/C][C]NA[/C][C]NA[/C][C]NA[/C][C]NA[/C][C]NA[/C][C]NA[/C][/ROW]
[ROW][C](p-val)[/C][C](NA )[/C][C](NA )[/C][C](NA )[/C][C](NA )[/C][C](NA )[/C][C](NA )[/C][C](NA )[/C][/ROW]
[ROW][C]Estimates ( 5 )[/C][C]NA[/C][C]NA[/C][C]NA[/C][C]NA[/C][C]NA[/C][C]NA[/C][C]NA[/C][/ROW]
[ROW][C](p-val)[/C][C](NA )[/C][C](NA )[/C][C](NA )[/C][C](NA )[/C][C](NA )[/C][C](NA )[/C][C](NA )[/C][/ROW]
[ROW][C]Estimates ( 6 )[/C][C]NA[/C][C]NA[/C][C]NA[/C][C]NA[/C][C]NA[/C][C]NA[/C][C]NA[/C][/ROW]
[ROW][C](p-val)[/C][C](NA )[/C][C](NA )[/C][C](NA )[/C][C](NA )[/C][C](NA )[/C][C](NA )[/C][C](NA )[/C][/ROW]
[ROW][C]Estimates ( 7 )[/C][C]NA[/C][C]NA[/C][C]NA[/C][C]NA[/C][C]NA[/C][C]NA[/C][C]NA[/C][/ROW]
[ROW][C](p-val)[/C][C](NA )[/C][C](NA )[/C][C](NA )[/C][C](NA )[/C][C](NA )[/C][C](NA )[/C][C](NA )[/C][/ROW]
[ROW][C]Estimates ( 8 )[/C][C]NA[/C][C]NA[/C][C]NA[/C][C]NA[/C][C]NA[/C][C]NA[/C][C]NA[/C][/ROW]
[ROW][C](p-val)[/C][C](NA )[/C][C](NA )[/C][C](NA )[/C][C](NA )[/C][C](NA )[/C][C](NA )[/C][C](NA )[/C][/ROW]
[ROW][C]Estimates ( 9 )[/C][C]NA[/C][C]NA[/C][C]NA[/C][C]NA[/C][C]NA[/C][C]NA[/C][C]NA[/C][/ROW]
[ROW][C](p-val)[/C][C](NA )[/C][C](NA )[/C][C](NA )[/C][C](NA )[/C][C](NA )[/C][C](NA )[/C][C](NA )[/C][/ROW]
[ROW][C]Estimates ( 10 )[/C][C]NA[/C][C]NA[/C][C]NA[/C][C]NA[/C][C]NA[/C][C]NA[/C][C]NA[/C][/ROW]
[ROW][C](p-val)[/C][C](NA )[/C][C](NA )[/C][C](NA )[/C][C](NA )[/C][C](NA )[/C][C](NA )[/C][C](NA )[/C][/ROW]
[ROW][C]Estimates ( 11 )[/C][C]NA[/C][C]NA[/C][C]NA[/C][C]NA[/C][C]NA[/C][C]NA[/C][C]NA[/C][/ROW]
[ROW][C](p-val)[/C][C](NA )[/C][C](NA )[/C][C](NA )[/C][C](NA )[/C][C](NA )[/C][C](NA )[/C][C](NA )[/C][/ROW]
[ROW][C]Estimates ( 12 )[/C][C]NA[/C][C]NA[/C][C]NA[/C][C]NA[/C][C]NA[/C][C]NA[/C][C]NA[/C][/ROW]
[ROW][C](p-val)[/C][C](NA )[/C][C](NA )[/C][C](NA )[/C][C](NA )[/C][C](NA )[/C][C](NA )[/C][C](NA )[/C][/ROW]
[ROW][C]Estimates ( 13 )[/C][C]NA[/C][C]NA[/C][C]NA[/C][C]NA[/C][C]NA[/C][C]NA[/C][C]NA[/C][/ROW]
[ROW][C](p-val)[/C][C](NA )[/C][C](NA )[/C][C](NA )[/C][C](NA )[/C][C](NA )[/C][C](NA )[/C][C](NA )[/C][/ROW]
[/TABLE]
Source: https://freestatistics.org/blog/index.php?pk=300783&T=1

Globally Unique Identifier (entire table): ba.freestatistics.org/blog/index.php?pk=300783&T=1

As an alternative you can also use a QR Code:  

The GUIDs for individual cells are displayed in the table below:

ARIMA Parameter Estimation and Backward Selection
Iterationar1ar2ar3ma1sar1sar2sma1
Estimates ( 1 )0.63480.1060.2436-0.78090.64390.3229-0.9557
(p-val)(0 )(0.3499 )(0.0573 )(0 )(0.0147 )(0.0096 )(8e-04 )
Estimates ( 2 )0.699800.2852-0.79560.66260.3289-0.9802
(p-val)(0 )(NA )(0.0109 )(0 )(0 )(0.0012 )(0 )
Estimates ( 3 )NANANANANANANA
(p-val)(NA )(NA )(NA )(NA )(NA )(NA )(NA )
Estimates ( 4 )NANANANANANANA
(p-val)(NA )(NA )(NA )(NA )(NA )(NA )(NA )
Estimates ( 5 )NANANANANANANA
(p-val)(NA )(NA )(NA )(NA )(NA )(NA )(NA )
Estimates ( 6 )NANANANANANANA
(p-val)(NA )(NA )(NA )(NA )(NA )(NA )(NA )
Estimates ( 7 )NANANANANANANA
(p-val)(NA )(NA )(NA )(NA )(NA )(NA )(NA )
Estimates ( 8 )NANANANANANANA
(p-val)(NA )(NA )(NA )(NA )(NA )(NA )(NA )
Estimates ( 9 )NANANANANANANA
(p-val)(NA )(NA )(NA )(NA )(NA )(NA )(NA )
Estimates ( 10 )NANANANANANANA
(p-val)(NA )(NA )(NA )(NA )(NA )(NA )(NA )
Estimates ( 11 )NANANANANANANA
(p-val)(NA )(NA )(NA )(NA )(NA )(NA )(NA )
Estimates ( 12 )NANANANANANANA
(p-val)(NA )(NA )(NA )(NA )(NA )(NA )(NA )
Estimates ( 13 )NANANANANANANA
(p-val)(NA )(NA )(NA )(NA )(NA )(NA )(NA )


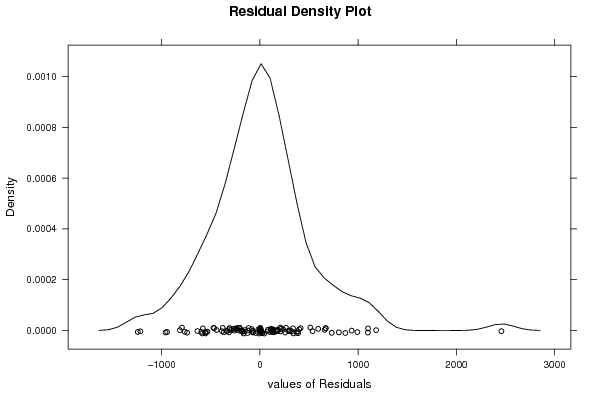
Estimated ARIMA Residuals
Value
5.80435517819141
372.738968709699
593.322441615601
-176.12254124628
869.588919567148
-72.0298064845098
-169.963769165257
111.498108627911
14.8781958010149
-42.6151235669198
133.584277471147
20.6516723951206
-83.6560865412668
207.941679679858
208.996185058568
-114.29337955828
1100.33038209786
-265.420799065851
-387.385142827028
-188.439790871266
-581.13257934815
-65.7257540202096
43.166070996225
-466.762918558351
5.85028337420182
213.670540550413
-379.155854927933
-472.177124178915
-596.694191234086
139.980032824474
179.160572513486
340.372023741127
-309.892372902092
81.6513884120001
-213.825082516659
-264.160807458691
668.875019157854
384.657722101684
-126.13034787345
133.994415755257
2457.97844465366
256.034446260373
236.657389584483
-794.253109835823
-554.270339150571
658.533169771989
-234.337716033555
-210.628224863006
160.536543404226
-534.657096759184
-181.989857494664
388.17927502403
-945.49309657806
512.987143754692
1182.00947094771
-587.107386601371
307.938003131462
135.183752150291
-312.724832647264
128.538355626316
301.747843445113
171.620258036911
-340.46615280308
-251.627123145181
669.271725192181
991.515798399382
933.391485250631
-234.537495832826
-7.02671762513084
-741.127839907436
-442.079392674083
-14.7808089129265
-961.77183972951
413.8851434542
-294.412142738635
-815.020205968293
803.094837944567
-315.099328799209
25.8533775175935
105.879157181888
-73.1985381512353
-166.181822415748
399.227898180088
-333.933955086647
535.790771681314
-123.215956914917
-152.121003699527
-766.975965919895
-367.78534487422
-1217.40843683943
-1243.76561043273
289.410362030915
-204.451608028249
730.083680360395
298.411257818282
181.237713986205
323.427399944678
118.090673580783
-636.808724597566
336.280229094421
-550.114245791689
-557.169260379246
1098.29072325102
264.53779783036
76.8712194346358

\begin{tabular}{lllllllll}
\hline
Estimated ARIMA Residuals \tabularnewline
Value \tabularnewline
5.80435517819141 \tabularnewline
372.738968709699 \tabularnewline
593.322441615601 \tabularnewline
-176.12254124628 \tabularnewline
869.588919567148 \tabularnewline
-72.0298064845098 \tabularnewline
-169.963769165257 \tabularnewline
111.498108627911 \tabularnewline
14.8781958010149 \tabularnewline
-42.6151235669198 \tabularnewline
133.584277471147 \tabularnewline
20.6516723951206 \tabularnewline
-83.6560865412668 \tabularnewline
207.941679679858 \tabularnewline
208.996185058568 \tabularnewline
-114.29337955828 \tabularnewline
1100.33038209786 \tabularnewline
-265.420799065851 \tabularnewline
-387.385142827028 \tabularnewline
-188.439790871266 \tabularnewline
-581.13257934815 \tabularnewline
-65.7257540202096 \tabularnewline
43.166070996225 \tabularnewline
-466.762918558351 \tabularnewline
5.85028337420182 \tabularnewline
213.670540550413 \tabularnewline
-379.155854927933 \tabularnewline
-472.177124178915 \tabularnewline
-596.694191234086 \tabularnewline
139.980032824474 \tabularnewline
179.160572513486 \tabularnewline
340.372023741127 \tabularnewline
-309.892372902092 \tabularnewline
81.6513884120001 \tabularnewline
-213.825082516659 \tabularnewline
-264.160807458691 \tabularnewline
668.875019157854 \tabularnewline
384.657722101684 \tabularnewline
-126.13034787345 \tabularnewline
133.994415755257 \tabularnewline
2457.97844465366 \tabularnewline
256.034446260373 \tabularnewline
236.657389584483 \tabularnewline
-794.253109835823 \tabularnewline
-554.270339150571 \tabularnewline
658.533169771989 \tabularnewline
-234.337716033555 \tabularnewline
-210.628224863006 \tabularnewline
160.536543404226 \tabularnewline
-534.657096759184 \tabularnewline
-181.989857494664 \tabularnewline
388.17927502403 \tabularnewline
-945.49309657806 \tabularnewline
512.987143754692 \tabularnewline
1182.00947094771 \tabularnewline
-587.107386601371 \tabularnewline
307.938003131462 \tabularnewline
135.183752150291 \tabularnewline
-312.724832647264 \tabularnewline
128.538355626316 \tabularnewline
301.747843445113 \tabularnewline
171.620258036911 \tabularnewline
-340.46615280308 \tabularnewline
-251.627123145181 \tabularnewline
669.271725192181 \tabularnewline
991.515798399382 \tabularnewline
933.391485250631 \tabularnewline
-234.537495832826 \tabularnewline
-7.02671762513084 \tabularnewline
-741.127839907436 \tabularnewline
-442.079392674083 \tabularnewline
-14.7808089129265 \tabularnewline
-961.77183972951 \tabularnewline
413.8851434542 \tabularnewline
-294.412142738635 \tabularnewline
-815.020205968293 \tabularnewline
803.094837944567 \tabularnewline
-315.099328799209 \tabularnewline
25.8533775175935 \tabularnewline
105.879157181888 \tabularnewline
-73.1985381512353 \tabularnewline
-166.181822415748 \tabularnewline
399.227898180088 \tabularnewline
-333.933955086647 \tabularnewline
535.790771681314 \tabularnewline
-123.215956914917 \tabularnewline
-152.121003699527 \tabularnewline
-766.975965919895 \tabularnewline
-367.78534487422 \tabularnewline
-1217.40843683943 \tabularnewline
-1243.76561043273 \tabularnewline
289.410362030915 \tabularnewline
-204.451608028249 \tabularnewline
730.083680360395 \tabularnewline
298.411257818282 \tabularnewline
181.237713986205 \tabularnewline
323.427399944678 \tabularnewline
118.090673580783 \tabularnewline
-636.808724597566 \tabularnewline
336.280229094421 \tabularnewline
-550.114245791689 \tabularnewline
-557.169260379246 \tabularnewline
1098.29072325102 \tabularnewline
264.53779783036 \tabularnewline
76.8712194346358 \tabularnewline
\hline
\end{tabular}
%Source: https://freestatistics.org/blog/index.php?pk=300783&T=2

[TABLE]
[ROW][C]Estimated ARIMA Residuals[/C][/ROW]
[ROW][C]Value[/C][/ROW]
[ROW][C]5.80435517819141[/C][/ROW]
[ROW][C]372.738968709699[/C][/ROW]
[ROW][C]593.322441615601[/C][/ROW]
[ROW][C]-176.12254124628[/C][/ROW]
[ROW][C]869.588919567148[/C][/ROW]
[ROW][C]-72.0298064845098[/C][/ROW]
[ROW][C]-169.963769165257[/C][/ROW]
[ROW][C]111.498108627911[/C][/ROW]
[ROW][C]14.8781958010149[/C][/ROW]
[ROW][C]-42.6151235669198[/C][/ROW]
[ROW][C]133.584277471147[/C][/ROW]
[ROW][C]20.6516723951206[/C][/ROW]
[ROW][C]-83.6560865412668[/C][/ROW]
[ROW][C]207.941679679858[/C][/ROW]
[ROW][C]208.996185058568[/C][/ROW]
[ROW][C]-114.29337955828[/C][/ROW]
[ROW][C]1100.33038209786[/C][/ROW]
[ROW][C]-265.420799065851[/C][/ROW]
[ROW][C]-387.385142827028[/C][/ROW]
[ROW][C]-188.439790871266[/C][/ROW]
[ROW][C]-581.13257934815[/C][/ROW]
[ROW][C]-65.7257540202096[/C][/ROW]
[ROW][C]43.166070996225[/C][/ROW]
[ROW][C]-466.762918558351[/C][/ROW]
[ROW][C]5.85028337420182[/C][/ROW]
[ROW][C]213.670540550413[/C][/ROW]
[ROW][C]-379.155854927933[/C][/ROW]
[ROW][C]-472.177124178915[/C][/ROW]
[ROW][C]-596.694191234086[/C][/ROW]
[ROW][C]139.980032824474[/C][/ROW]
[ROW][C]179.160572513486[/C][/ROW]
[ROW][C]340.372023741127[/C][/ROW]
[ROW][C]-309.892372902092[/C][/ROW]
[ROW][C]81.6513884120001[/C][/ROW]
[ROW][C]-213.825082516659[/C][/ROW]
[ROW][C]-264.160807458691[/C][/ROW]
[ROW][C]668.875019157854[/C][/ROW]
[ROW][C]384.657722101684[/C][/ROW]
[ROW][C]-126.13034787345[/C][/ROW]
[ROW][C]133.994415755257[/C][/ROW]
[ROW][C]2457.97844465366[/C][/ROW]
[ROW][C]256.034446260373[/C][/ROW]
[ROW][C]236.657389584483[/C][/ROW]
[ROW][C]-794.253109835823[/C][/ROW]
[ROW][C]-554.270339150571[/C][/ROW]
[ROW][C]658.533169771989[/C][/ROW]
[ROW][C]-234.337716033555[/C][/ROW]
[ROW][C]-210.628224863006[/C][/ROW]
[ROW][C]160.536543404226[/C][/ROW]
[ROW][C]-534.657096759184[/C][/ROW]
[ROW][C]-181.989857494664[/C][/ROW]
[ROW][C]388.17927502403[/C][/ROW]
[ROW][C]-945.49309657806[/C][/ROW]
[ROW][C]512.987143754692[/C][/ROW]
[ROW][C]1182.00947094771[/C][/ROW]
[ROW][C]-587.107386601371[/C][/ROW]
[ROW][C]307.938003131462[/C][/ROW]
[ROW][C]135.183752150291[/C][/ROW]
[ROW][C]-312.724832647264[/C][/ROW]
[ROW][C]128.538355626316[/C][/ROW]
[ROW][C]301.747843445113[/C][/ROW]
[ROW][C]171.620258036911[/C][/ROW]
[ROW][C]-340.46615280308[/C][/ROW]
[ROW][C]-251.627123145181[/C][/ROW]
[ROW][C]669.271725192181[/C][/ROW]
[ROW][C]991.515798399382[/C][/ROW]
[ROW][C]933.391485250631[/C][/ROW]
[ROW][C]-234.537495832826[/C][/ROW]
[ROW][C]-7.02671762513084[/C][/ROW]
[ROW][C]-741.127839907436[/C][/ROW]
[ROW][C]-442.079392674083[/C][/ROW]
[ROW][C]-14.7808089129265[/C][/ROW]
[ROW][C]-961.77183972951[/C][/ROW]
[ROW][C]413.8851434542[/C][/ROW]
[ROW][C]-294.412142738635[/C][/ROW]
[ROW][C]-815.020205968293[/C][/ROW]
[ROW][C]803.094837944567[/C][/ROW]
[ROW][C]-315.099328799209[/C][/ROW]
[ROW][C]25.8533775175935[/C][/ROW]
[ROW][C]105.879157181888[/C][/ROW]
[ROW][C]-73.1985381512353[/C][/ROW]
[ROW][C]-166.181822415748[/C][/ROW]
[ROW][C]399.227898180088[/C][/ROW]
[ROW][C]-333.933955086647[/C][/ROW]
[ROW][C]535.790771681314[/C][/ROW]
[ROW][C]-123.215956914917[/C][/ROW]
[ROW][C]-152.121003699527[/C][/ROW]
[ROW][C]-766.975965919895[/C][/ROW]
[ROW][C]-367.78534487422[/C][/ROW]
[ROW][C]-1217.40843683943[/C][/ROW]
[ROW][C]-1243.76561043273[/C][/ROW]
[ROW][C]289.410362030915[/C][/ROW]
[ROW][C]-204.451608028249[/C][/ROW]
[ROW][C]730.083680360395[/C][/ROW]
[ROW][C]298.411257818282[/C][/ROW]
[ROW][C]181.237713986205[/C][/ROW]
[ROW][C]323.427399944678[/C][/ROW]
[ROW][C]118.090673580783[/C][/ROW]
[ROW][C]-636.808724597566[/C][/ROW]
[ROW][C]336.280229094421[/C][/ROW]
[ROW][C]-550.114245791689[/C][/ROW]
[ROW][C]-557.169260379246[/C][/ROW]
[ROW][C]1098.29072325102[/C][/ROW]
[ROW][C]264.53779783036[/C][/ROW]
[ROW][C]76.8712194346358[/C][/ROW]
[/TABLE]
Source: https://freestatistics.org/blog/index.php?pk=300783&T=2

Globally Unique Identifier (entire table): ba.freestatistics.org/blog/index.php?pk=300783&T=2

As an alternative you can also use a QR Code:  

The GUIDs for individual cells are displayed in the table below:

Estimated ARIMA Residuals
Value
5.80435517819141
372.738968709699
593.322441615601
-176.12254124628
869.588919567148
-72.0298064845098
-169.963769165257
111.498108627911
14.8781958010149
-42.6151235669198
133.584277471147
20.6516723951206
-83.6560865412668
207.941679679858
208.996185058568
-114.29337955828
1100.33038209786
-265.420799065851
-387.385142827028
-188.439790871266
-581.13257934815
-65.7257540202096
43.166070996225
-466.762918558351
5.85028337420182
213.670540550413
-379.155854927933
-472.177124178915
-596.694191234086
139.980032824474
179.160572513486
340.372023741127
-309.892372902092
81.6513884120001
-213.825082516659
-264.160807458691
668.875019157854
384.657722101684
-126.13034787345
133.994415755257
2457.97844465366
256.034446260373
236.657389584483
-794.253109835823
-554.270339150571
658.533169771989
-234.337716033555
-210.628224863006
160.536543404226
-534.657096759184
-181.989857494664
388.17927502403
-945.49309657806
512.987143754692
1182.00947094771
-587.107386601371
307.938003131462
135.183752150291
-312.724832647264
128.538355626316
301.747843445113
171.620258036911
-340.46615280308
-251.627123145181
669.271725192181
991.515798399382
933.391485250631
-234.537495832826
-7.02671762513084
-741.127839907436
-442.079392674083
-14.7808089129265
-961.77183972951
413.8851434542
-294.412142738635
-815.020205968293
803.094837944567
-315.099328799209
25.8533775175935
105.879157181888
-73.1985381512353
-166.181822415748
399.227898180088
-333.933955086647
535.790771681314
-123.215956914917
-152.121003699527
-766.975965919895
-367.78534487422
-1217.40843683943
-1243.76561043273
289.410362030915
-204.451608028249
730.083680360395
298.411257818282
181.237713986205
323.427399944678
118.090673580783
-636.808724597566
336.280229094421
-550.114245791689
-557.169260379246
1098.29072325102
264.53779783036
76.8712194346358


Parameters (Session):
par1 = 12 ; par2 = periodic ; par3 = 0 ; par5 = 1 ; par7 = 1 ; par8 = FALSE ;
Parameters (R input):
par1 = FALSE ; par2 = 1 ; par3 = 0 ; par4 = 1 ; par5 = 12 ; par6 = 3 ; par7 = 1 ; par8 = 2 ; par9 = 1 ;
R code (references can be found in the software module):
library(lattice)
if (par1 == 'TRUE') par1 <- TRUE
if (par1 == 'FALSE') par1 <- FALSE
par2 <- as.numeric(par2) #Box-Cox lambda transformation parameter
par3 <- as.numeric(par3) #degree of non-seasonal differencing
par4 <- as.numeric(par4) #degree of seasonal differencing
par5 <- as.numeric(par5) #seasonal period
par6 <- as.numeric(par6) #degree (p) of the non-seasonal AR(p) polynomial
par7 <- as.numeric(par7) #degree (q) of the non-seasonal MA(q) polynomial
par8 <- as.numeric(par8) #degree (P) of the seasonal AR(P) polynomial
par9 <- as.numeric(par9) #degree (Q) of the seasonal MA(Q) polynomial
armaGR <- function(arima.out, names, n){
try1 <- arima.out$coef
try2 <- sqrt(diag(arima.out$var.coef))
try.data.frame <- data.frame(matrix(NA,ncol=4,nrow=length(names)))
dimnames(try.data.frame) <- list(names,c('coef','std','tstat','pv'))
try.data.frame[,1] <- try1
for(i in 1:length(try2)) try.data.frame[which(rownames(try.data.frame)==names(try2)[i]),2] <- try2[i]
try.data.frame[,3] <- try.data.frame[,1] / try.data.frame[,2]
try.data.frame[,4] <- round((1-pt(abs(try.data.frame[,3]),df=n-(length(try2)+1)))*2,5)
vector <- rep(NA,length(names))
vector[is.na(try.data.frame[,4])] <- 0
maxi <- which.max(try.data.frame[,4])
continue <- max(try.data.frame[,4],na.rm=TRUE) > .05
vector[maxi] <- 0
list(summary=try.data.frame,next.vector=vector,continue=continue)
}
arimaSelect <- function(series, order=c(13,0,0), seasonal=list(order=c(2,0,0),period=12), include.mean=F){
nrc <- order[1]+order[3]+seasonal$order[1]+seasonal$order[3]
coeff <- matrix(NA, nrow=nrc*2, ncol=nrc)
pval <- matrix(NA, nrow=nrc*2, ncol=nrc)
mylist <- rep(list(NULL), nrc)
names <- NULL
if(order[1] > 0) names <- paste('ar',1:order[1],sep='')
if(order[3] > 0) names <- c( names , paste('ma',1:order[3],sep='') )
if(seasonal$order[1] > 0) names <- c(names, paste('sar',1:seasonal$order[1],sep=''))
if(seasonal$order[3] > 0) names <- c(names, paste('sma',1:seasonal$order[3],sep=''))
arima.out <- arima(series, order=order, seasonal=seasonal, include.mean=include.mean, method='ML')
mylist[[1]] <- arima.out
last.arma <- armaGR(arima.out, names, length(series))
mystop <- FALSE
i <- 1
coeff[i,] <- last.arma[[1]][,1]
pval [i,] <- last.arma[[1]][,4]
i <- 2
aic <- arima.out$aic
while(!mystop){
mylist[[i]] <- arima.out
arima.out <- arima(series, order=order, seasonal=seasonal, include.mean=include.mean, method='ML', fixed=last.arma$next.vector)
aic <- c(aic, arima.out$aic)
last.arma <- armaGR(arima.out, names, length(series))
mystop <- !last.arma$continue
coeff[i,] <- last.arma[[1]][,1]
pval [i,] <- last.arma[[1]][,4]
i <- i+1
}
list(coeff, pval, mylist, aic=aic)
}
arimaSelectplot <- function(arimaSelect.out,noms,choix){
noms <- names(arimaSelect.out[[3]][[1]]$coef)
coeff <- arimaSelect.out[[1]]
k <- min(which(is.na(coeff[,1])))-1
coeff <- coeff[1:k,]
pval <- arimaSelect.out[[2]][1:k,]
aic <- arimaSelect.out$aic[1:k]
coeff[coeff==0] <- NA
n <- ncol(coeff)
if(missing(choix)) choix <- k
layout(matrix(c(1,1,1,2,
3,3,3,2,
3,3,3,4,
5,6,7,7),nr=4),
widths=c(10,35,45,15),
heights=c(30,30,15,15))
couleurs <- rainbow(75)[1:50]#(50)
ticks <- pretty(coeff)
par(mar=c(1,1,3,1))
plot(aic,k:1-.5,type='o',pch=21,bg='blue',cex=2,axes=F,lty=2,xpd=NA)
points(aic[choix],k-choix+.5,pch=21,cex=4,bg=2,xpd=NA)
title('aic',line=2)
par(mar=c(3,0,0,0))
plot(0,axes=F,xlab='',ylab='',xlim=range(ticks),ylim=c(.1,1))
rect(xleft = min(ticks) + (0:49)/50*(max(ticks)-min(ticks)),
xright = min(ticks) + (1:50)/50*(max(ticks)-min(ticks)),
ytop = rep(1,50),
ybottom= rep(0,50),col=couleurs,border=NA)
axis(1,ticks)
rect(xleft=min(ticks),xright=max(ticks),ytop=1,ybottom=0)
text(mean(coeff,na.rm=T),.5,'coefficients',cex=2,font=2)
par(mar=c(1,1,3,1))
image(1:n,1:k,t(coeff[k:1,]),axes=F,col=couleurs,zlim=range(ticks))
for(i in 1:n) for(j in 1:k) if(!is.na(coeff[j,i])) {
if(pval[j,i]<.01) symb = 'green'
else if( (pval[j,i]<.05) & (pval[j,i]>=.01)) symb = 'orange'
else if( (pval[j,i]<.1) & (pval[j,i]>=.05)) symb = 'red'
else symb = 'black'
polygon(c(i+.5 ,i+.2 ,i+.5 ,i+.5),
c(k-j+0.5,k-j+0.5,k-j+0.8,k-j+0.5),
col=symb)
if(j==choix) {
rect(xleft=i-.5,
xright=i+.5,
ybottom=k-j+1.5,
ytop=k-j+.5,
lwd=4)
text(i,
k-j+1,
round(coeff[j,i],2),
cex=1.2,
font=2)
}
else{
rect(xleft=i-.5,xright=i+.5,ybottom=k-j+1.5,ytop=k-j+.5)
text(i,k-j+1,round(coeff[j,i],2),cex=1.2,font=1)
}
}
axis(3,1:n,noms)
par(mar=c(0.5,0,0,0.5))
plot(0,axes=F,xlab='',ylab='',type='n',xlim=c(0,8),ylim=c(-.2,.8))
cols <- c('green','orange','red','black')
niv <- c('0','0.01','0.05','0.1')
for(i in 0:3){
polygon(c(1+2*i ,1+2*i ,1+2*i-.5 ,1+2*i),
c(.4 ,.7 , .4 , .4),
col=cols[i+1])
text(2*i,0.5,niv[i+1],cex=1.5)
}
text(8,.5,1,cex=1.5)
text(4,0,'p-value',cex=2)
box()
residus <- arimaSelect.out[[3]][[choix]]$res
par(mar=c(1,2,4,1))
acf(residus,main='')
title('acf',line=.5)
par(mar=c(1,2,4,1))
pacf(residus,main='')
title('pacf',line=.5)
par(mar=c(2,2,4,1))
qqnorm(residus,main='')
title('qq-norm',line=.5)
qqline(residus)
residus
}
if (par2 == 0) x <- log(x)
if (par2 != 0) x <- x^par2
(selection <- arimaSelect(x, order=c(par6,par3,par7), seasonal=list(order=c(par8,par4,par9), period=par5)))
bitmap(file='test1.png')
resid <- arimaSelectplot(selection)
dev.off()
resid
bitmap(file='test2.png')
acf(resid,length(resid)/2, main='Residual Autocorrelation Function')
dev.off()
bitmap(file='test3.png')
pacf(resid,length(resid)/2, main='Residual Partial Autocorrelation Function')
dev.off()
bitmap(file='test4.png')
cpgram(resid, main='Residual Cumulative Periodogram')
dev.off()
bitmap(file='test5.png')
hist(resid, main='Residual Histogram', xlab='values of Residuals')
dev.off()
bitmap(file='test6.png')
densityplot(~resid,col='black',main='Residual Density Plot', xlab='values of Residuals')
dev.off()
bitmap(file='test7.png')
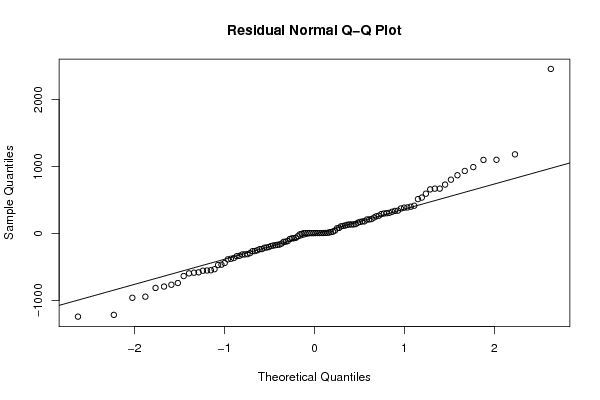
qqnorm(resid, main='Residual Normal Q-Q Plot')
qqline(resid)
dev.off()
ncols <- length(selection[[1]][1,])
nrows <- length(selection[[2]][,1])-1
load(file='createtable')
a<-table.start()
a<-table.row.start(a)
a<-table.element(a,'ARIMA Parameter Estimation and Backward Selection', ncols+1,TRUE)
a<-table.row.end(a)
a<-table.row.start(a)
a<-table.element(a,'Iteration', header=TRUE)
for (i in 1:ncols) {
a<-table.element(a,names(selection[[3]][[1]]$coef)[i],header=TRUE)
}
a<-table.row.end(a)
for (j in 1:nrows) {
a<-table.row.start(a)
mydum <- 'Estimates ('
mydum <- paste(mydum,j)
mydum <- paste(mydum,')')
a<-table.element(a,mydum, header=TRUE)
for (i in 1:ncols) {
a<-table.element(a,round(selection[[1]][j,i],4))
}
a<-table.row.end(a)
a<-table.row.start(a)
a<-table.element(a,'(p-val)', header=TRUE)
for (i in 1:ncols) {
mydum <- '('
mydum <- paste(mydum,round(selection[[2]][j,i],4),sep='')
mydum <- paste(mydum,')')
a<-table.element(a,mydum)
}
a<-table.row.end(a)
}
a<-table.end(a)
table.save(a,file='mytable.tab')
a<-table.start()
a<-table.row.start(a)
a<-table.element(a,'Estimated ARIMA Residuals', 1,TRUE)
a<-table.row.end(a)
a<-table.row.start(a)
a<-table.element(a,'Value', 1,TRUE)
a<-table.row.end(a)
for (i in (par4*par5+par3):length(resid)) {
a<-table.row.start(a)
a<-table.element(a,resid[i])
a<-table.row.end(a)
}
a<-table.end(a)
table.save(a,file='mytable1.tab')